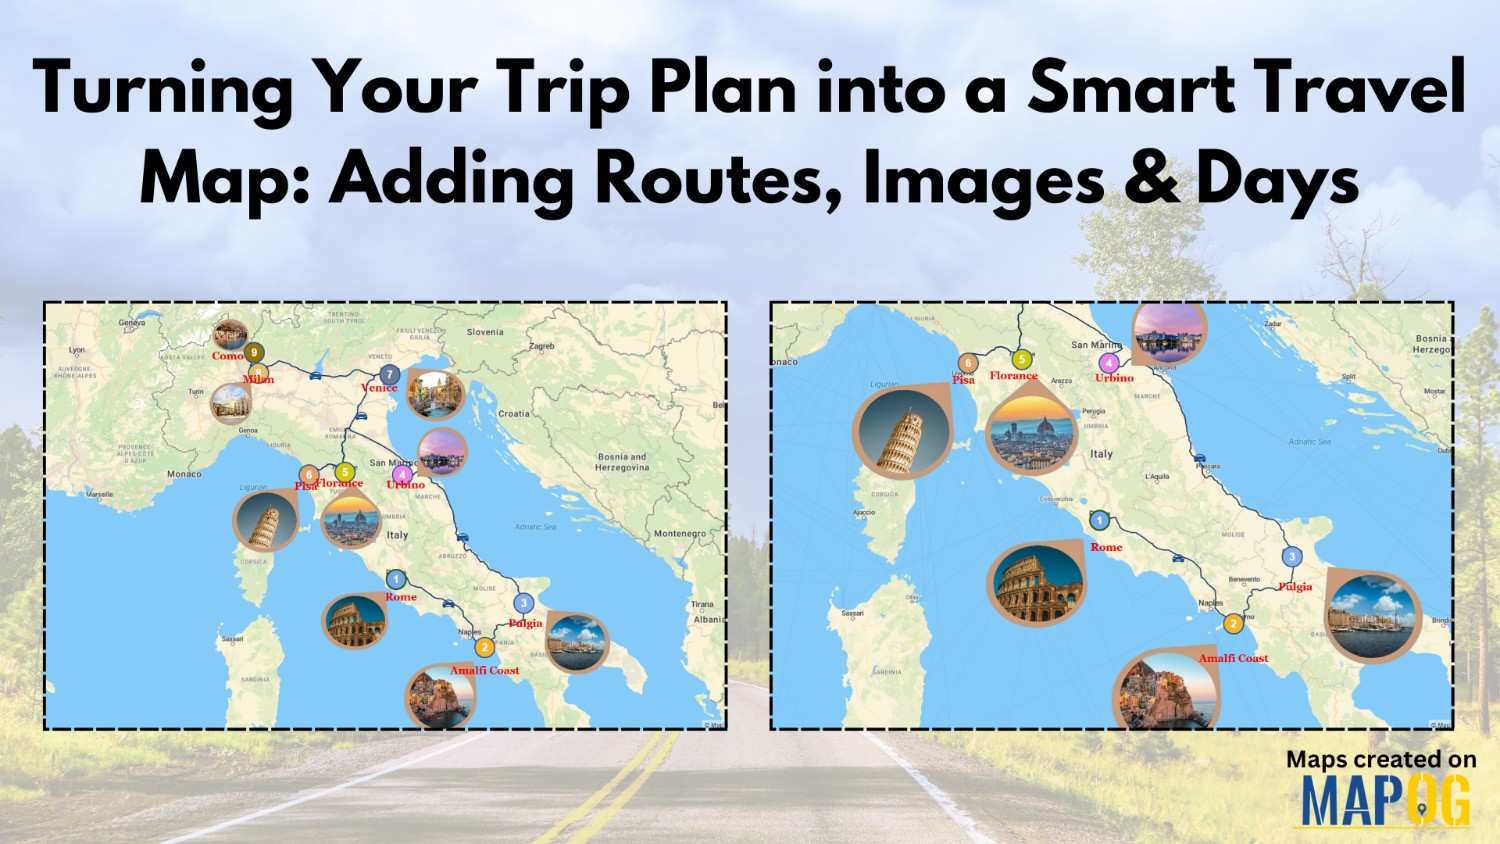
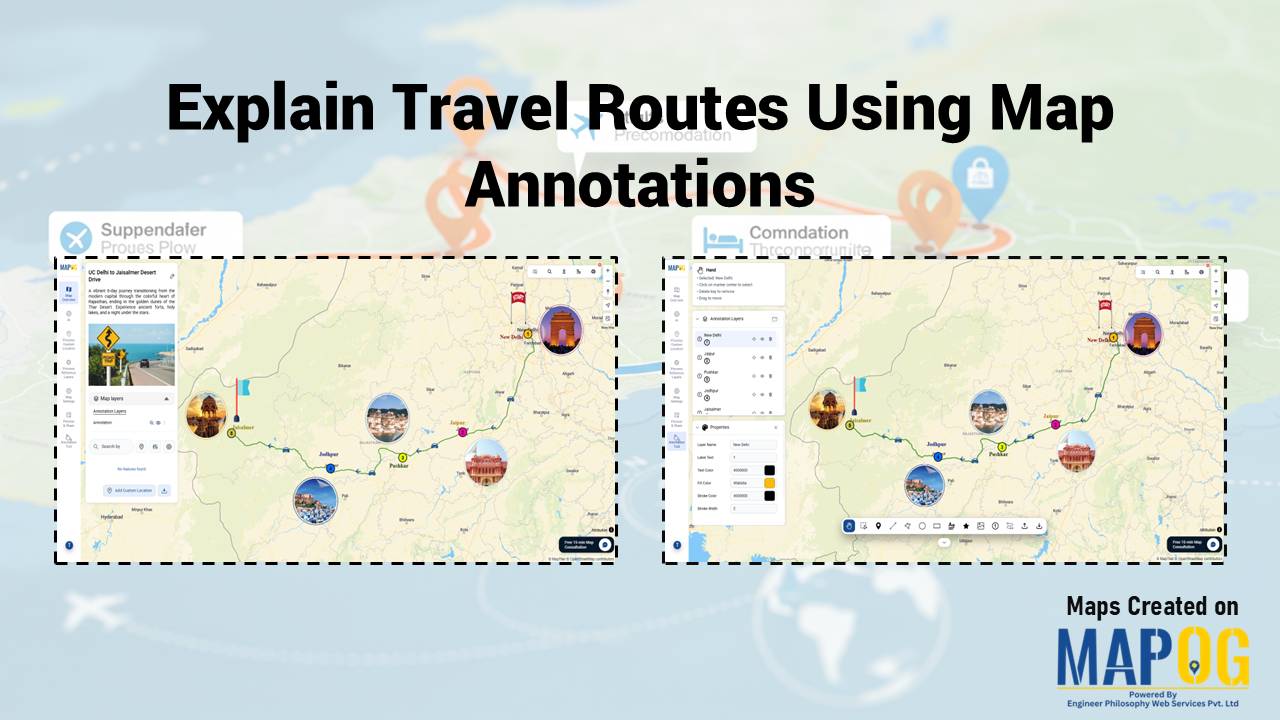
Easy Map Creation

Interactive map created on MAPOG showing how to add multimedia to your maps, with embedded videos, images, and links displayed in popups.

Add Multimedia to Your Maps: Videos, Images & Links in One View

Many mapped datasets feel incomplete because sometimes locations aren’t enough, context is needed too. Important details like site visuals, progress updates, or reference links often stay disconnected from the map itself. That’s why it’s essential to add multimedia to your maps. By including videos, images, and external links, you can turn each point into a … Read more

Create Story Maps Faster Using Reusable Custom Locations Library

Create Story Maps Faster Using Reusable Custom Locations Library

To begin with, using a reusable custom locations library is a simple yet powerful way to speed up story map creation. Moreover, this approach helps planners, teams, and organizations reuse existing location datasets instead of rebuilding maps each time. As a result, you can instantly drop in pre-saved places such as stores, offices, hotspots, or … Read more

Export Your Map with All Data and Details Intact (GeoJSON, SHP, CSV)

Export Your Map with All Data and Details Intact (GeoJSON, SHP, CSV)

In mapping and spatial data, live interactive maps are incredibly powerful; however, there are times when offline access becomes essential. That’s why MAPOG lets you export your map seamlessly, ensuring all data and details remain intact. As a result, you can analyse, present, or share your information with your team without losing any important elements. … Read more

tracking customer

How to track customer visits without calling the team again and again

Many organizations struggle to keep track of customer visits without calling in real time zones  , which often leads to repeated phone calls, confused updates, and inefficient coordination. As a result, teams end up relying on scattered verbal reports, causing delays, and inconsistent follow-ups. Consequently, managers find it difficult to monitor field activity, assign tasks, … Read more

Cover image

How to Combine All Customer Data from the Field Into One Clean Map

To combine all the customer data from the field is a common challenge for organizations. Teams collect location details, service feedback, and on-site observations through a mix of mobile apps, paper forms, and spreadsheets, but this mix of formats often leaves the data scattered and hard to interpret.  A unified map solves this problem by … Read more

Cover Image

How to Plot Multiple Locations from an Excel Sheet on a Map

If you have ever managed an extensive list of locations in an Excel sheet — such as customer addresses, store locations, survey sites, or well coordinates — and wanted to represent them spatially, you are not alone. Visualizing location-based data on a map enables you to clearly understand the spatial distribution, relationships, and patterns that … Read more

cover image

Color-Code Your Customers by Purchase Behavior on a Map

In today’s data-driven retail world, every customer leaves behind a digital footprint — where they live, how often they buy, and how much they spend. Yet, even with this information it can be difficult to decipher the bigger picture or understand where your most valuable customers actually come from. That’s why visualizing customer data matters. … Read more

Map-based insights showing customer clustering and store coverage for hotspot detection.

How to Use Map-Based Insights to Identify New Customer Hotspots

In fast-changing markets, the real challenge isn’t gathering data, it’s knowing where demand is quietly building. Many teams still rely on static reports and broad assumptions, which often miss the early signals of emerging customer interest. As a result, high-potential areas go unnoticed while resources stay concentrated in familiar zones. That’s why it’s important to … Read more

How to View Your Customers by State, City, or Region on a Map

How to View Your Customers by State, City, or Region on a Map

Ever wondered which areas your customers come from or where your business is growing the fastest? Visualizing customer locations on a map can turn raw data into clear, actionable insights. With MAPOG, you can easily map and view your customers by state, city, or region, giving you instant insights into geographic trends and market potential. … Read more

Cover image with article title and MAPOG screenshots showing customer location assignments to field teams.

How to Assign Customer Locations to Field Teams for Surveys

Efficient field surveys start with a clear plan, so you need a simple and accurate way to assign customer locations to field teams. When each member knows where to go, your operations move faster, data quality improves, and field time decreases. This structured approach strengthens tracking, balances workloads, and improves coverage. You can manage all … Read more