Interactive and dynamic maps not only transform data into actionable visuals but also let users explore, interpret, and share insights. With MAPOG, you can not only map portfolios, campuses, routes, or stores but also organize, analyze, and visualize trends; moreover, this enables clearer, faster, and connected decisions.
Key Concept: Why Create Interactive Dynamic Maps?
Interactive maps not only simplify data but also reveal patterns, track changes, and share insights; moreover, by layering and visualizing trends, they enhance understanding, guide decisions, and improve outcomes.
Here are five examples you can easily create on your WordPress site.
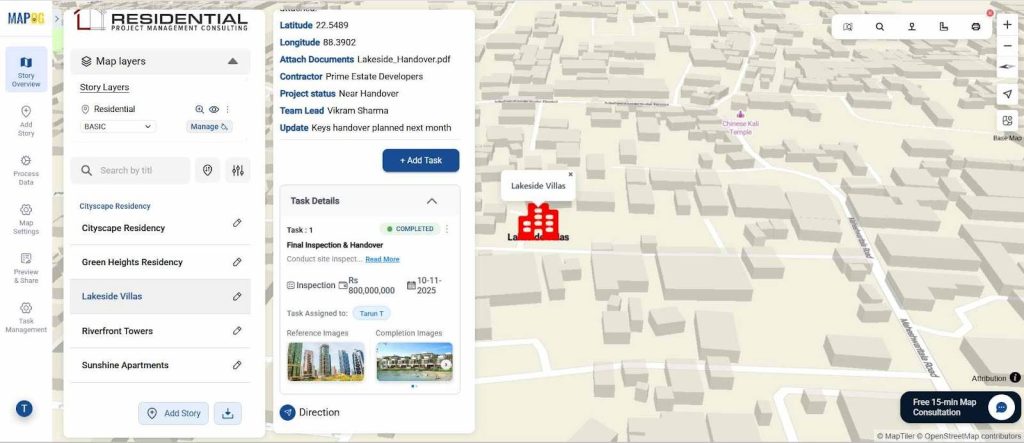
1. Portfolio & Task Management Map
Theme:
Use MAPOG to not only convert listings but also enhance status, connectivity, insights, and visibility.
Problem & Solution:
Managing multiple projects can be chaotic, but MAPOG not only organizes details but also shows locations, infrastructure, and supports tasks.
Key Concept:
Mapped portfolios not only improve tracking but also boost transparency and decisions.
Quick Steps:
Create a project, then add locations, assign tasks, highlight amenities, and finally publish the map.
See the article below to learn and explore interactive maps.
Manage and Share Location-Based Projects Online with an All-in-One Mapping Tool
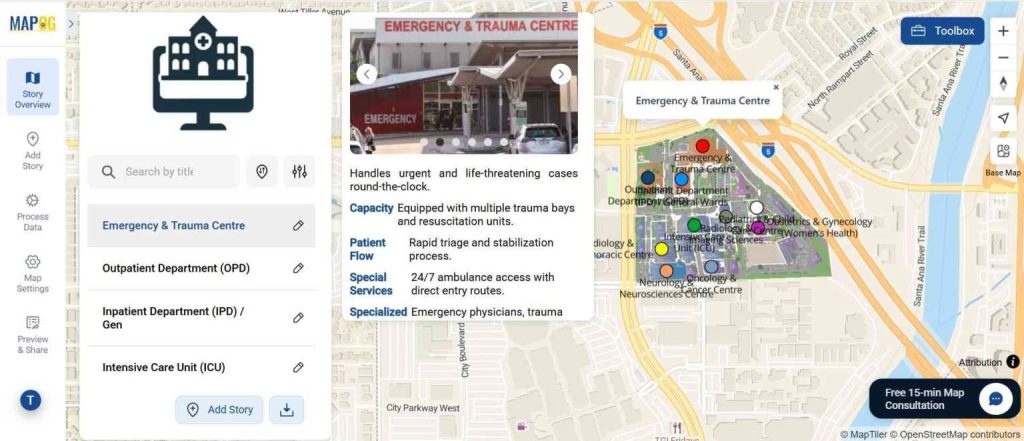
2. Campus & Institutional Map
Theme:
Create hospital maps that show departments, labs, wards, and also highlight emergencies.
Problem & Solution:
Large hospitals can be confusing, but MAPOG not only visualizes routes, services, and wards but also improves navigation and coordination.
Key Concept:
Interactive hospital maps not only boost clarity but also enhance efficiency and accessibility.
Quick Steps:
Create a project, then geo-reference the layout, add features, customize pins, and finally share the map.
See the article below to learn how to build interactive maps.
Smart Hospital Maps: How Interactive Mapping Improves Patient Navigation & Care
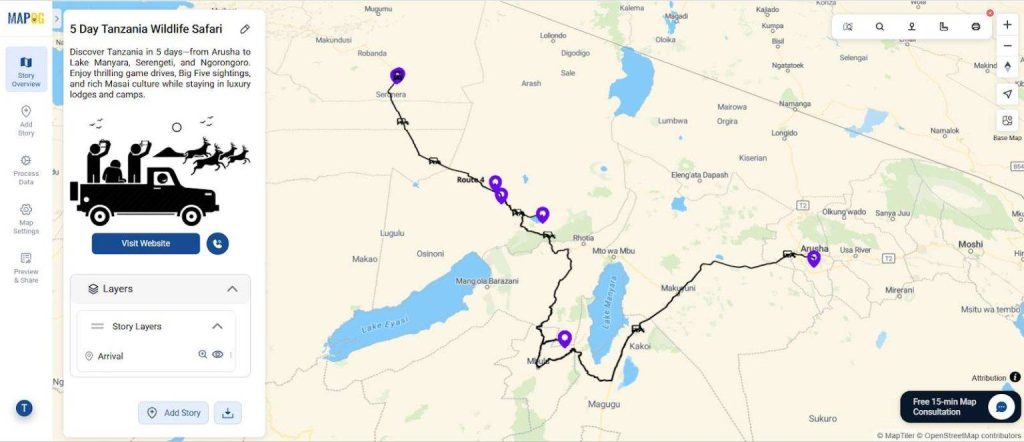
3. Itinerary & Travel Route Map
Theme:
Map safari routes to not only visualize but also make planning interactive.
Problem & Solution:
Safari plans can get messy, but MAPOG not only unites travel days, routes, photos, and notes but also enables easy planning and sharing.
Key Concept:
An itinerary map blends navigation and storytelling, creating engaging visual journeys.
Quick Steps:
Create a travel project, add locations and photos, connect routes, and share.
Check the article below to learn how to create interactive maps.
Create & Share a Safari Itinerary Map for Your Trip
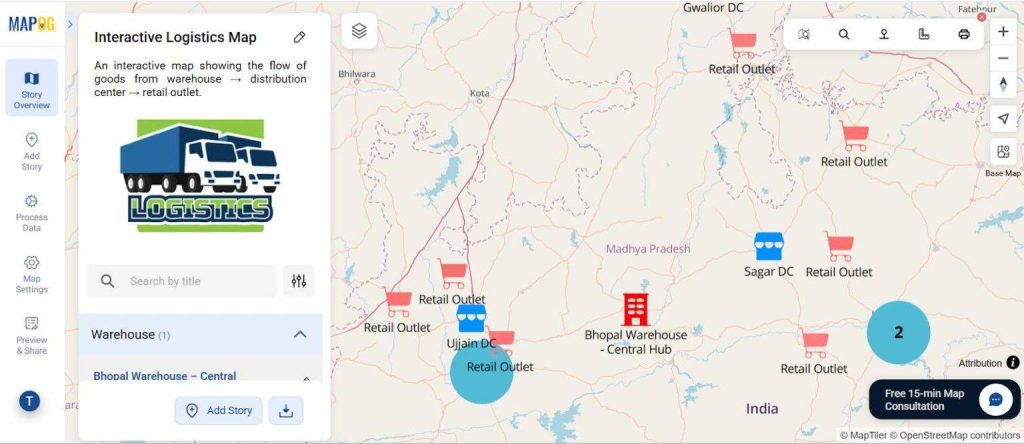
4. Supply Chain & Logistics Flow Interactive Dynamic Map
Theme:
Map warehouses, centers, and outlets while also visualizing flow and boosting efficiency.
Problem & Solution:
Poor logistics causes delays, but MAPOG not only visualizes warehouses and routes but also optimizes deliveries and tracks tasks efficiently.
Key Concept:
A logistics map not only boosts visibility but also reduces bottlenecks and aids decision-making.
Quick Steps:
Start a project, then add coordinates, categorize points, customize markers, add attributes, and finally preview and share.
Check the article below to learn how to create interactive maps.
How to Map a Supply Chain with Warehouses, Distribution Centers & Retail Outlets
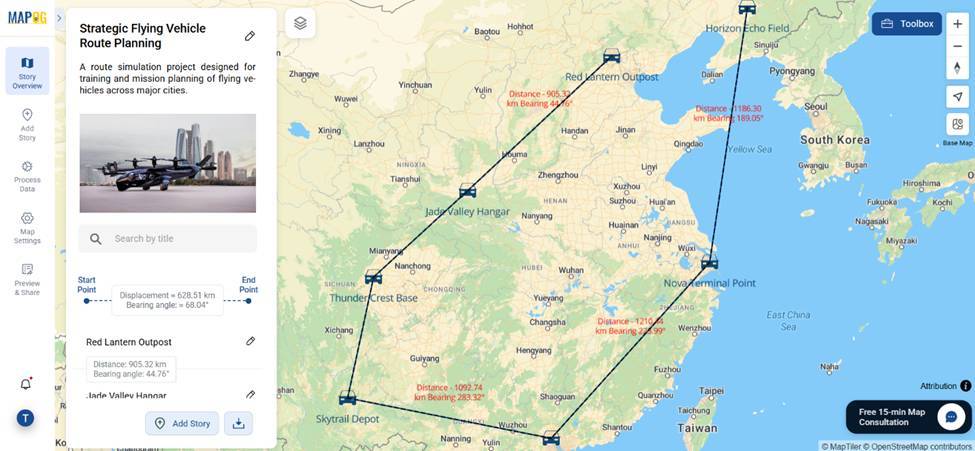
5. Plan Efficiently with Route Compass
Theme:
Using bearing angle and distance tools not only to plan accurate electric aerial vehicle routes but also to optimize logistics, or disaster response operations.
Problem & Solution:
Planning EAV routes can be tricky, but MAPOG not only visualizes bearings and distances but also aligns routes and manages tasks efficiently.
Key Concept:
Bearing angle and distance mapping not only improve route precision but also enhance safety.
Quick Steps:
Create a map, then add coordinates, visualize bearing and distance, customize, and finally share the route.
Check the article below to learn how to create interactive maps.
How to Plan Efficient Electric Aerial Vehicle Routes Using Bearing Angle and Distance
Benefits of Using Interactive dynamic map Tools
All-in-one mapping platforms not only centralize data but also improve collaboration and support real-time updates; moreover, they enhance communication, enable faster decision-making, and ultimately make interactive dynamic maps ideal for project, travel, campus, and supply chain management.
Final Thoughts
Interactive maps are not only powerful visualization tools but also versatile for many uses. With MAPOG, you can not only map projects, campuses, travel routes, or logistics but also create engaging, map-driven experiences, enhance user interaction, and effectively communicate insights.