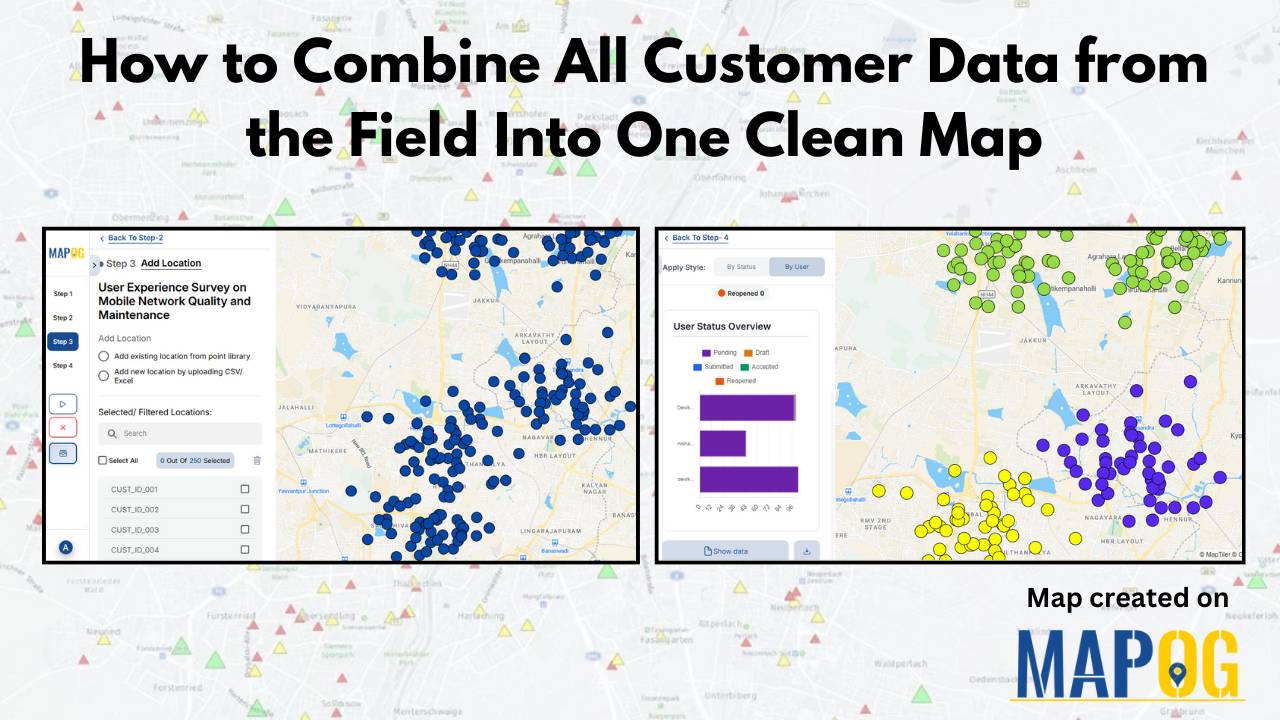
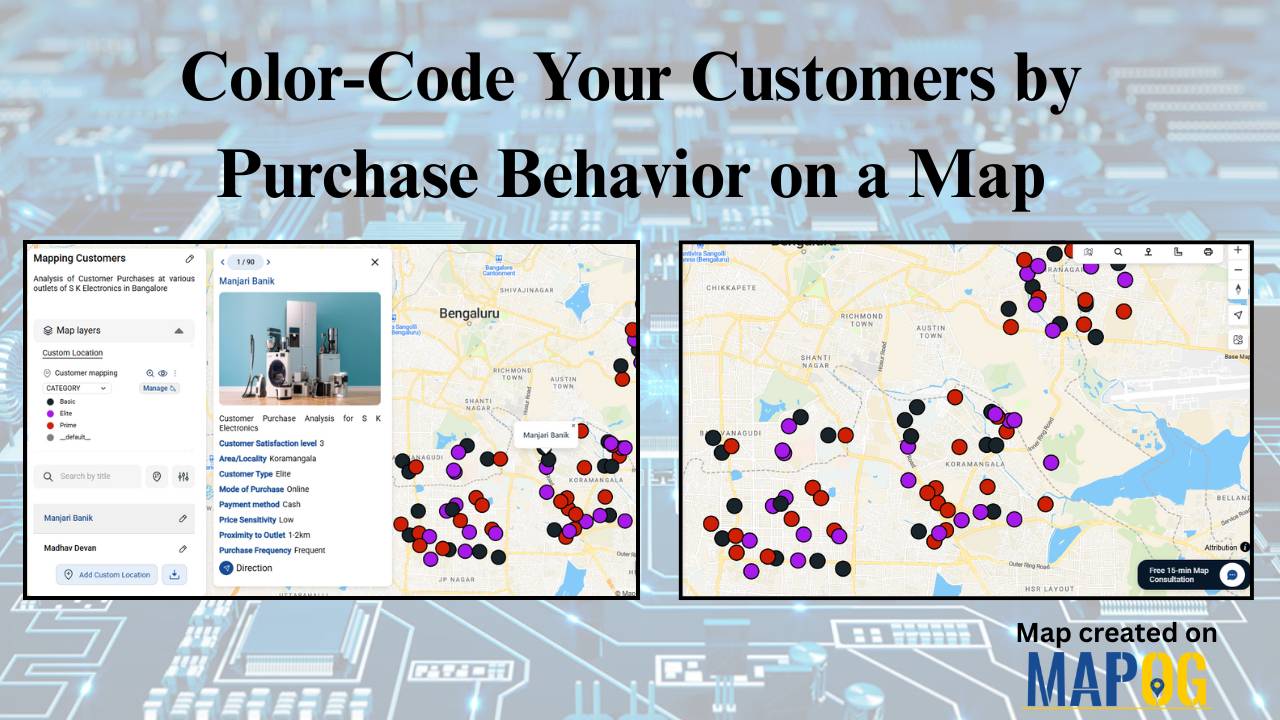
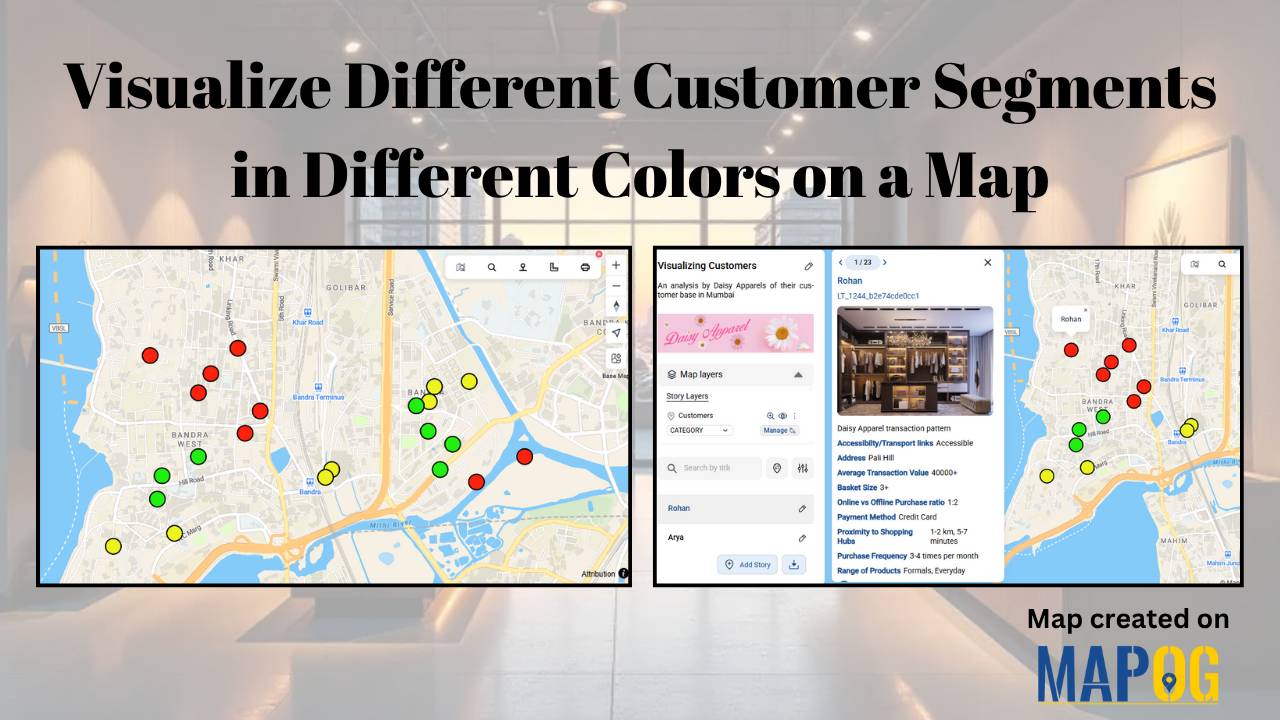
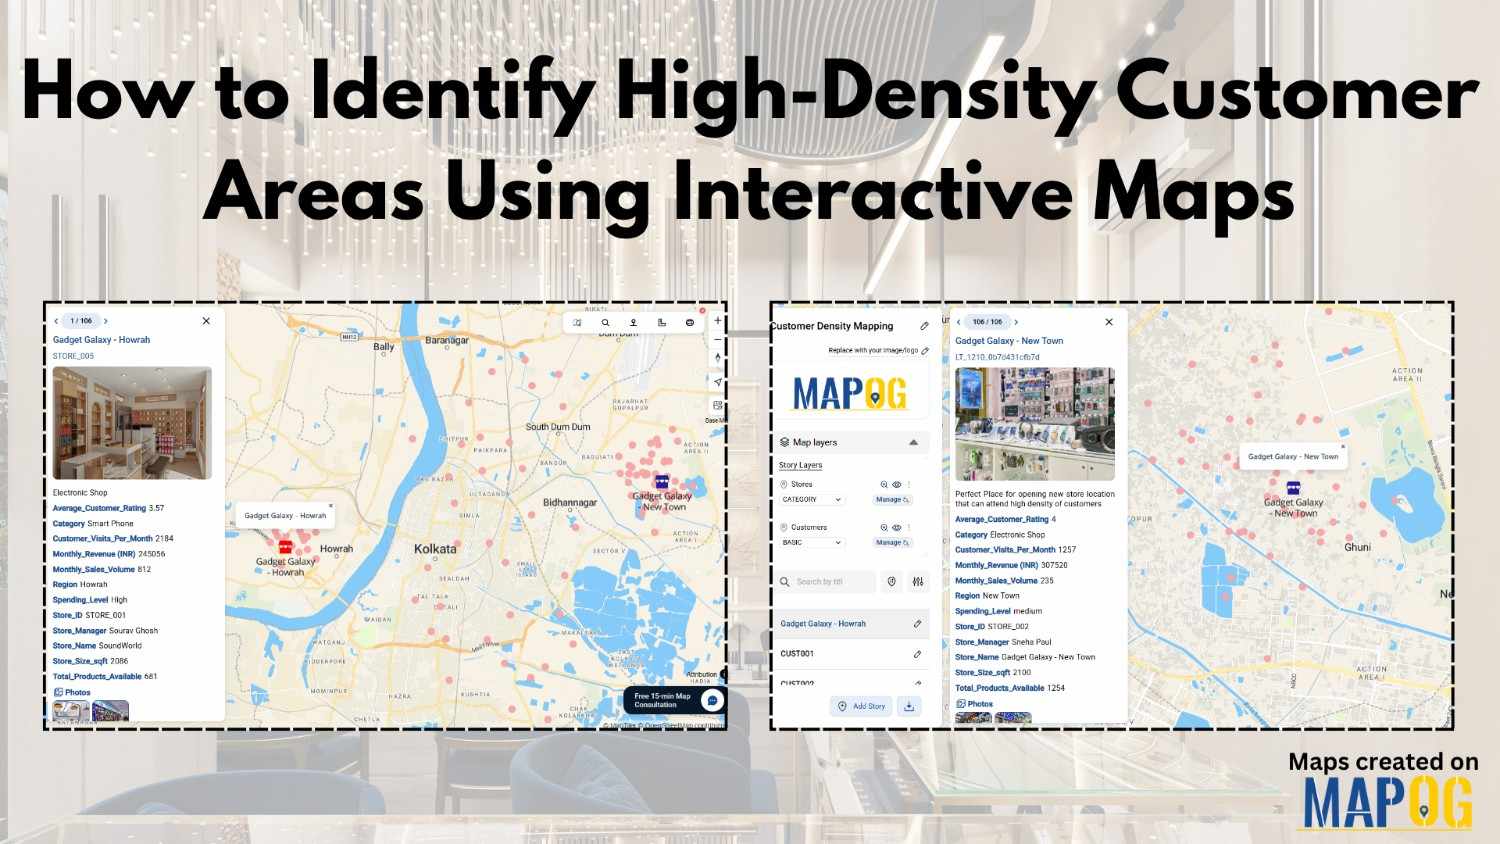
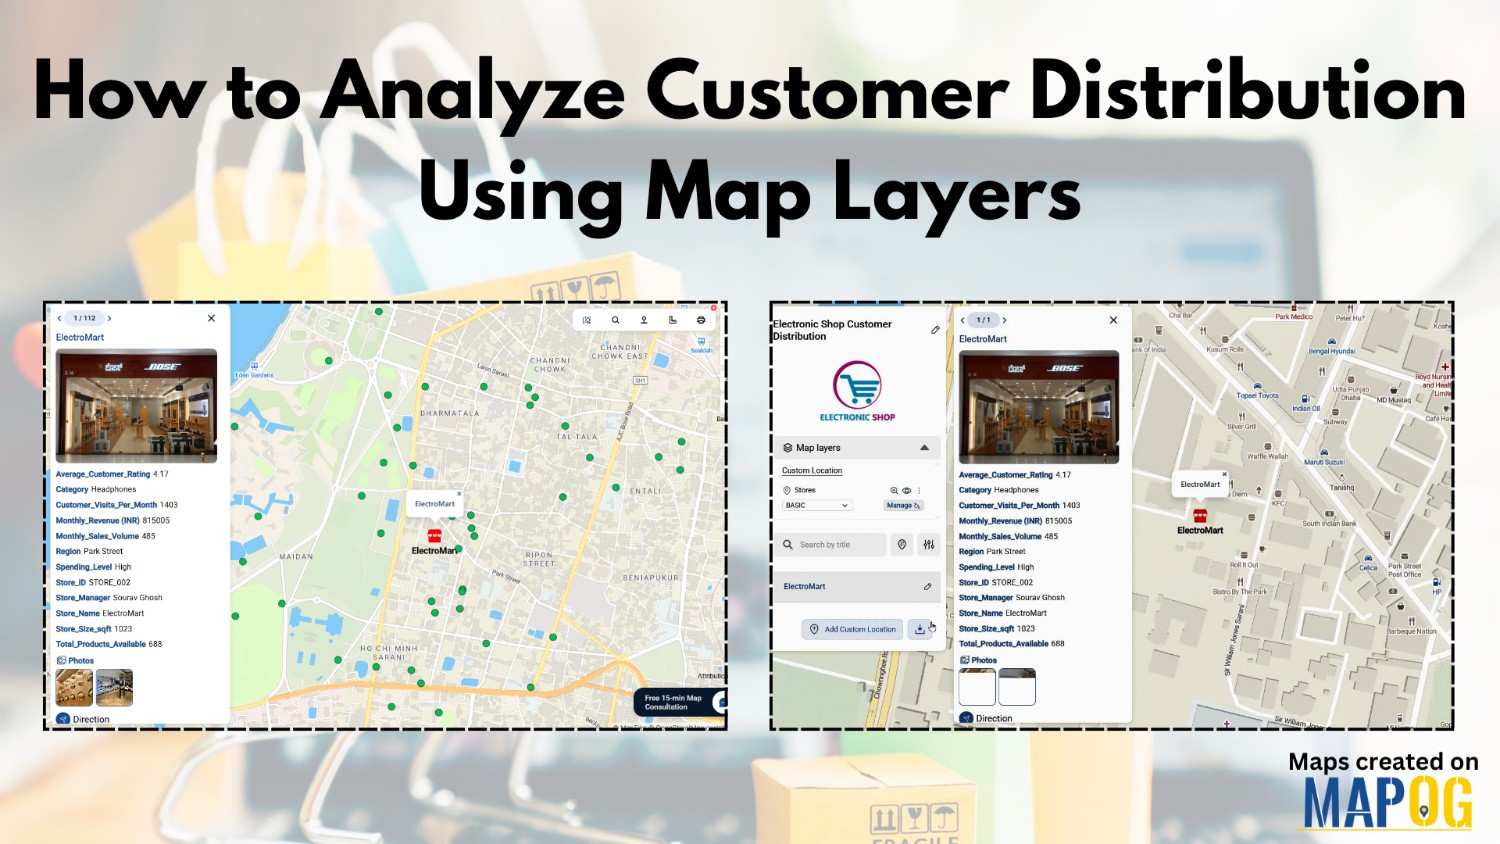
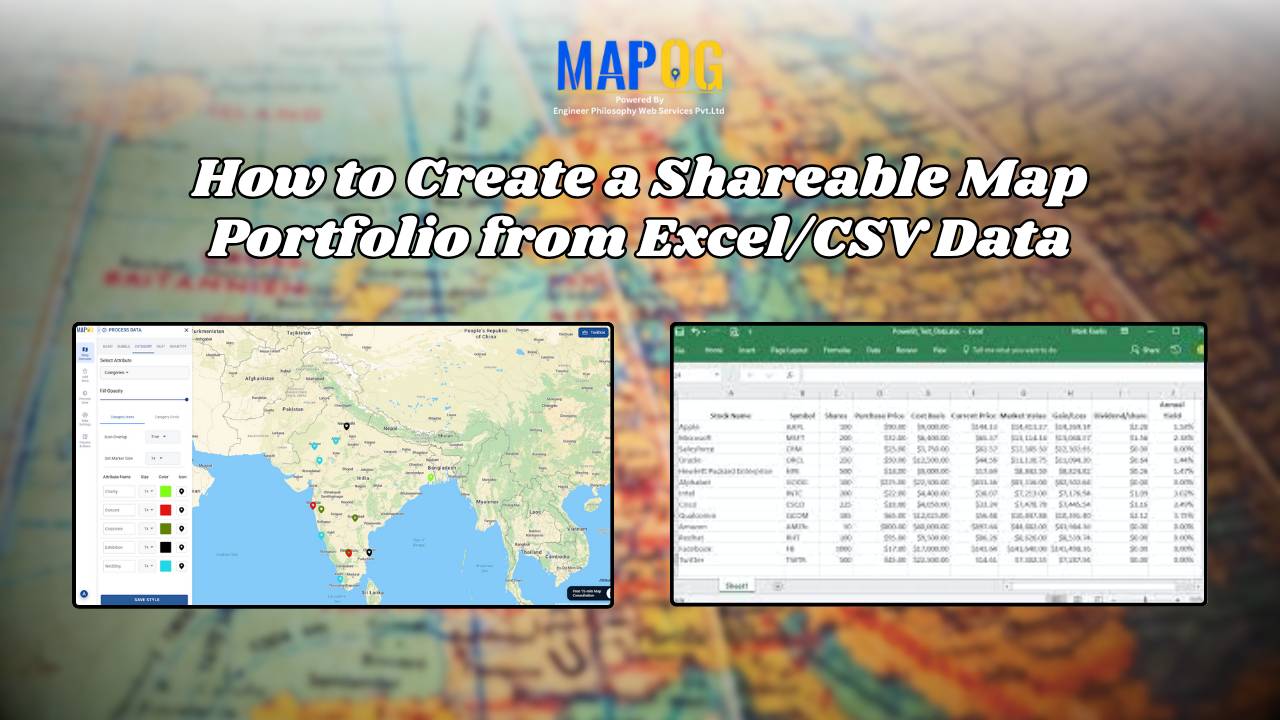
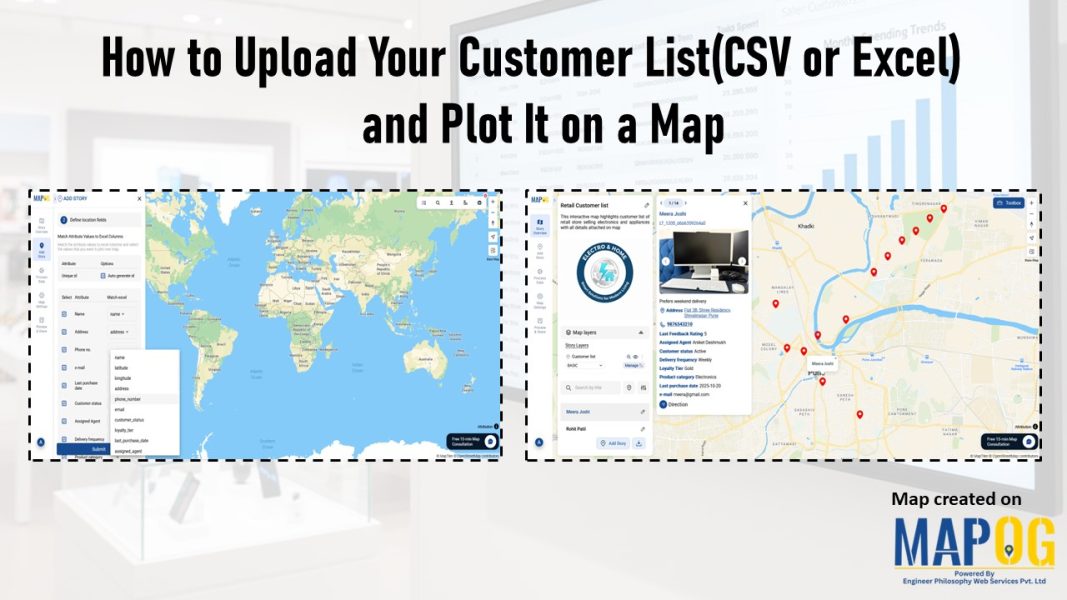
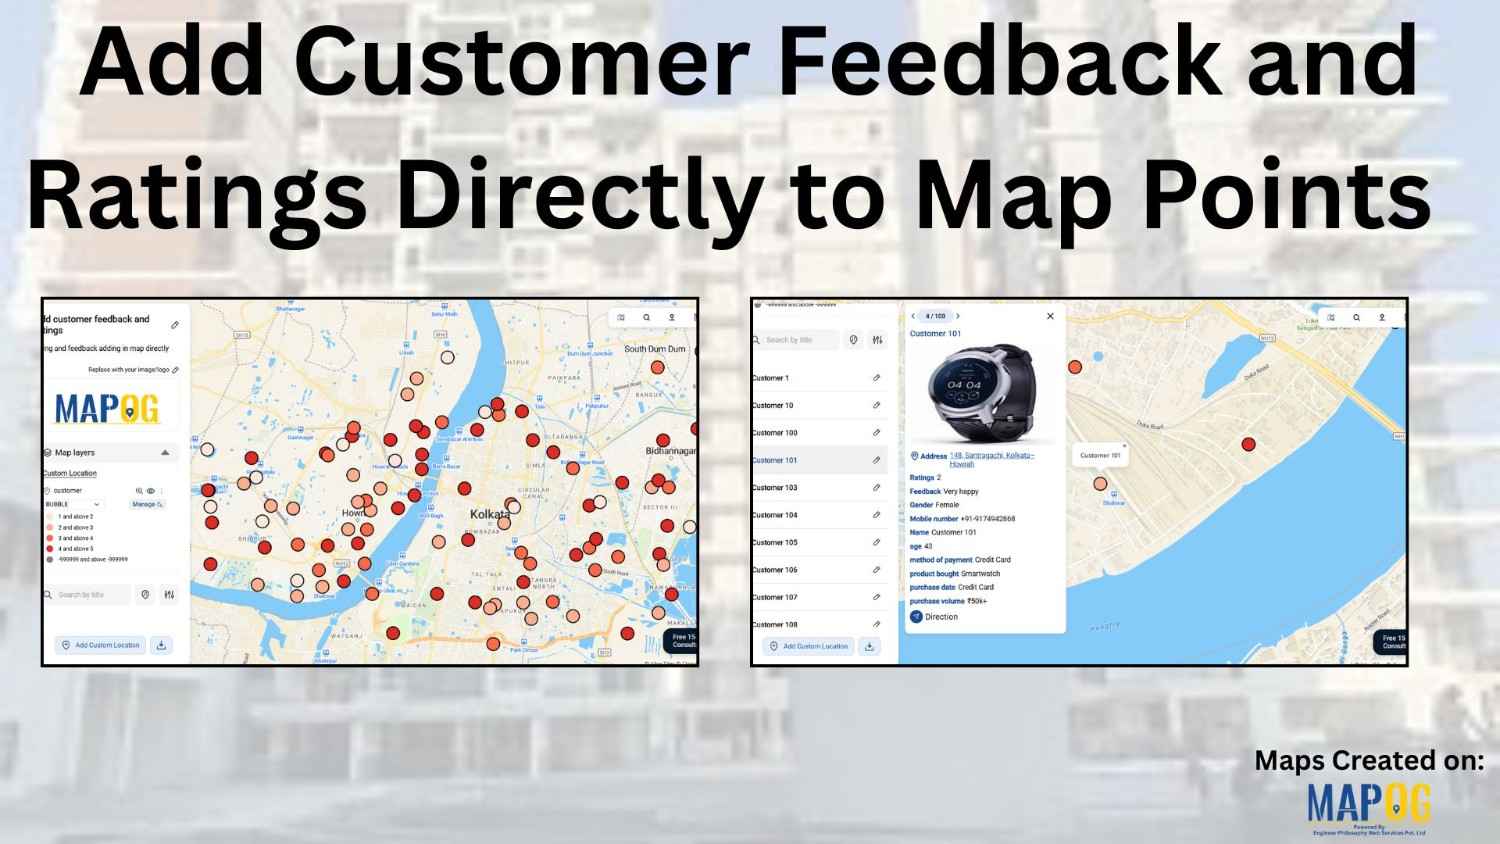
SpatialAnalysis

final visuals of GeoJSON data on an interactive map

How To Visualize GeoJSON Data On Interactive Maps

Trying to visualize GeoJSON data can be challenging when moving from raw spatial data to an interactive map. Although GeoJSON is widely used to store geographic features and attributes, it lacks built-in styling and interactivity. This makes raw files difficult to interpret, especially for non-technical audiences. Moreover, converting GeoJSON into a usable map often requires … Read more

Download Your Mapped Data in Different Formats

Download Your Mapped Data in Different Formats

Interactive maps do more than just visualize locations—they also store valuable data that can be exported, shared, and analyzed across multiple platforms. For instance, whether you’re tracking coffee shops, field points, real estate listings, or even survey data. MAPOG lets you download your mapped data layers in formats like CSV, XLS, JPG, KML, or SHP. … Read more

5 Inspiring Examples of Interactive Dynamic Maps You Can Create Online

Interactive and dynamic maps not only transform data into actionable visuals but also let users explore, interpret, and share insights. With MAPOG, you can not only map portfolios, campuses, routes, or stores but also organize, analyze, and visualize trends; moreover, this enables clearer, faster, and connected decisions. Key Concept: Why Create Interactive Dynamic Maps? Interactive … Read more

Manage and Share Location-Based Projects Online with an All-in-One Mapping Tool

In today’s fast-paced project environments, tracking multiple sites, teams, and resources across locations is a major challenge. Therefore, to manage and share location-based projects, and moreover to help construction managers track distributed sites, project mapping now provides an all-in-one solution. With MAPOG, even a simple Excel sheet can quickly transform into an interactive map; as … Read more

Interactive Maps for Better Engagement

Why Businesses Are Switching to Interactive Maps for Better Engagement

Businesses today are moving beyond static visuals and lengthy reports — they’re using interactive maps for better engagement to turn raw data into visual stories. From real estate firms displaying project portfolios to tourism companies mapping destinations, and logistics brands tracking operations, interactive mapping platforms like MAPOG are helping businesses communicate more effectively and engage … Read more

Uploading shapefiles

How to Import Shapefiles into an Online Mapping Tool

Shapefiles are a popular format for storing geographic data, often used in GIS to define boundaries, and spatial attributes. However, How to Import Shapefiles into an Online Mapping Tool can be complex and difficult to interpret for non-technical audiences or in decision-making processes. Importing shapefiles into MAPOG  transforms static data into interactive, shareable maps that … Read more

Easy Mapping Tools

Easy Mapping Tools Are Revolutionizing Real Estate Project Planning

Creating detailed maps for real estate projects or buildings once required technical GIS knowledge or expensive software. For developers, planners, easy mapping tools for real estate projects often meant relying on specialists just to visualize property layouts or land parcels. However, the rise of easy, no-code mapping tools has completely changed that. MAPOG now make … Read more

Mapping Platform vs Traditional Maps

Mapping Platform vs Traditional Maps: Everything You Need to Know

In today’s world, mapping platform vs traditional maps is a common debate, meanwhile where technology drives nearly every decision, the way we view and use maps has transformed dramatically. Historically, traditional maps once served as our primary guides offering static representations of geography, routes, and landmarks. However, with the rise of modern mapping platforms like … Read more

How to Sort Map Locations by Distance from Your Current Location

In today’s fast-paced, location-driven world, knowing exactly where things are in relation to you is essential. Whether it’s finding the nearest hospital during an emergency, locating a petrol pump while traveling, or discovering nearby restaurants and stores, thus being able to sort map locations by distance from your current location can save significant time and … Read more

How to Plot Borewell Data on a Map All at Once Without Manual Entry

In water resource projects, visualizing borewell data is crucial for informed decision-making. Manual plotting, however, is tedious and error-prone. The ability to plot borewell data on a map simultaneously, without manual entry, makes the process faster and more reliable. MAPOG simplifies this through features like “Add by uploading CSV/Excel” and integrated task management. This then … Read more