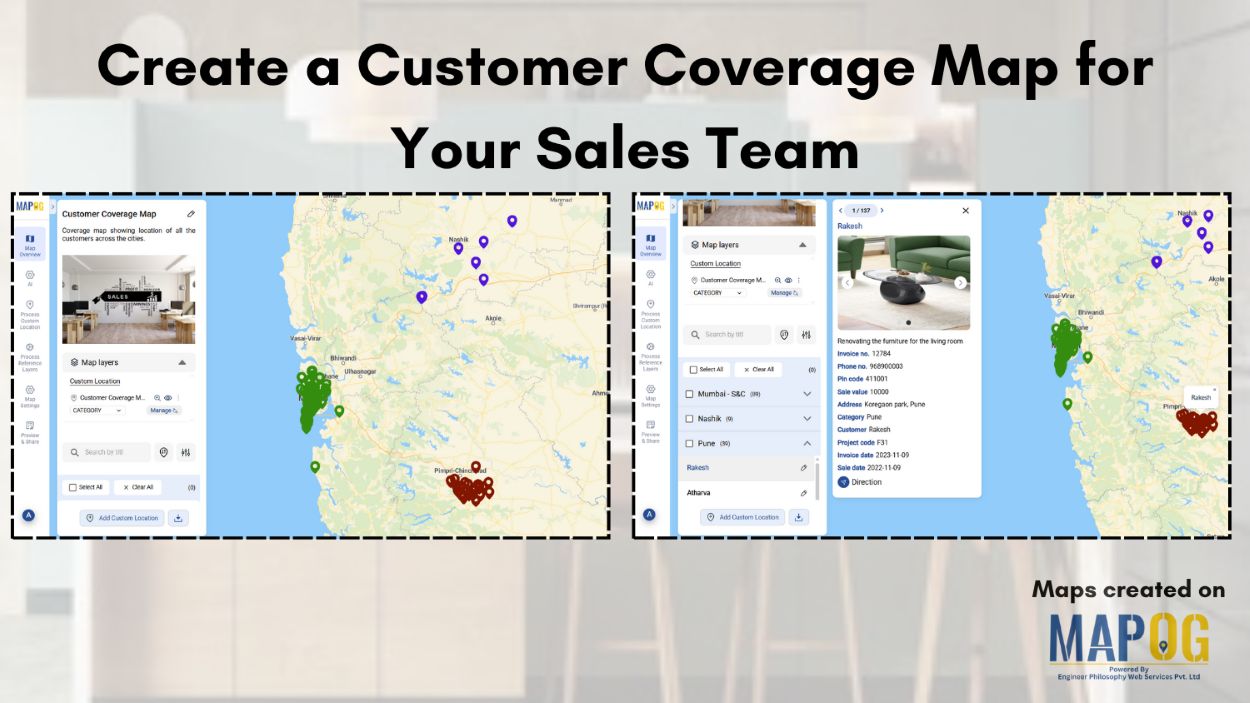
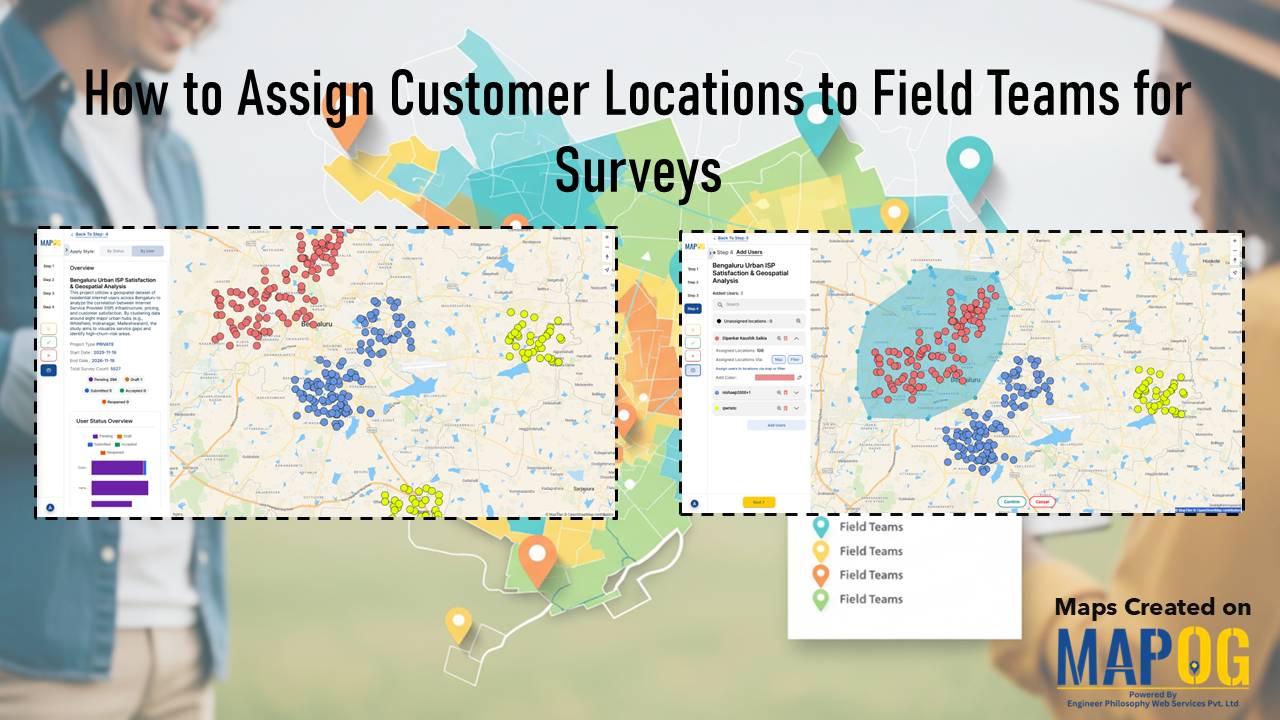
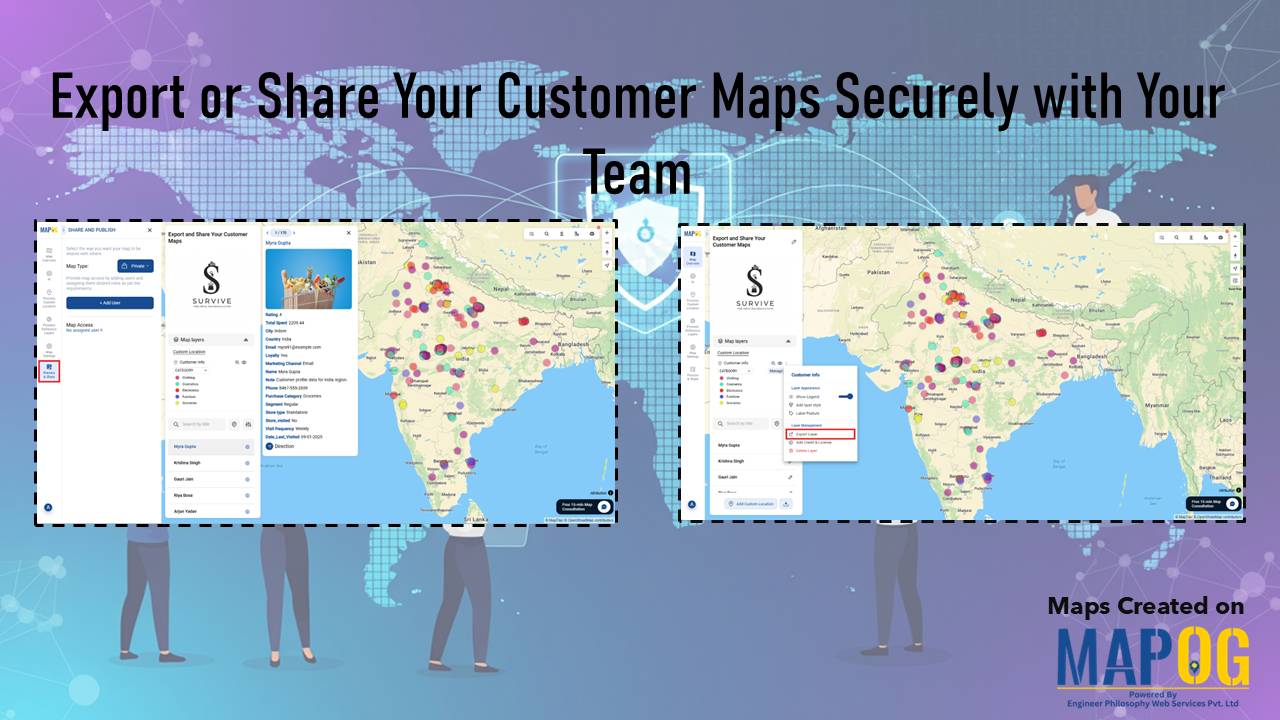
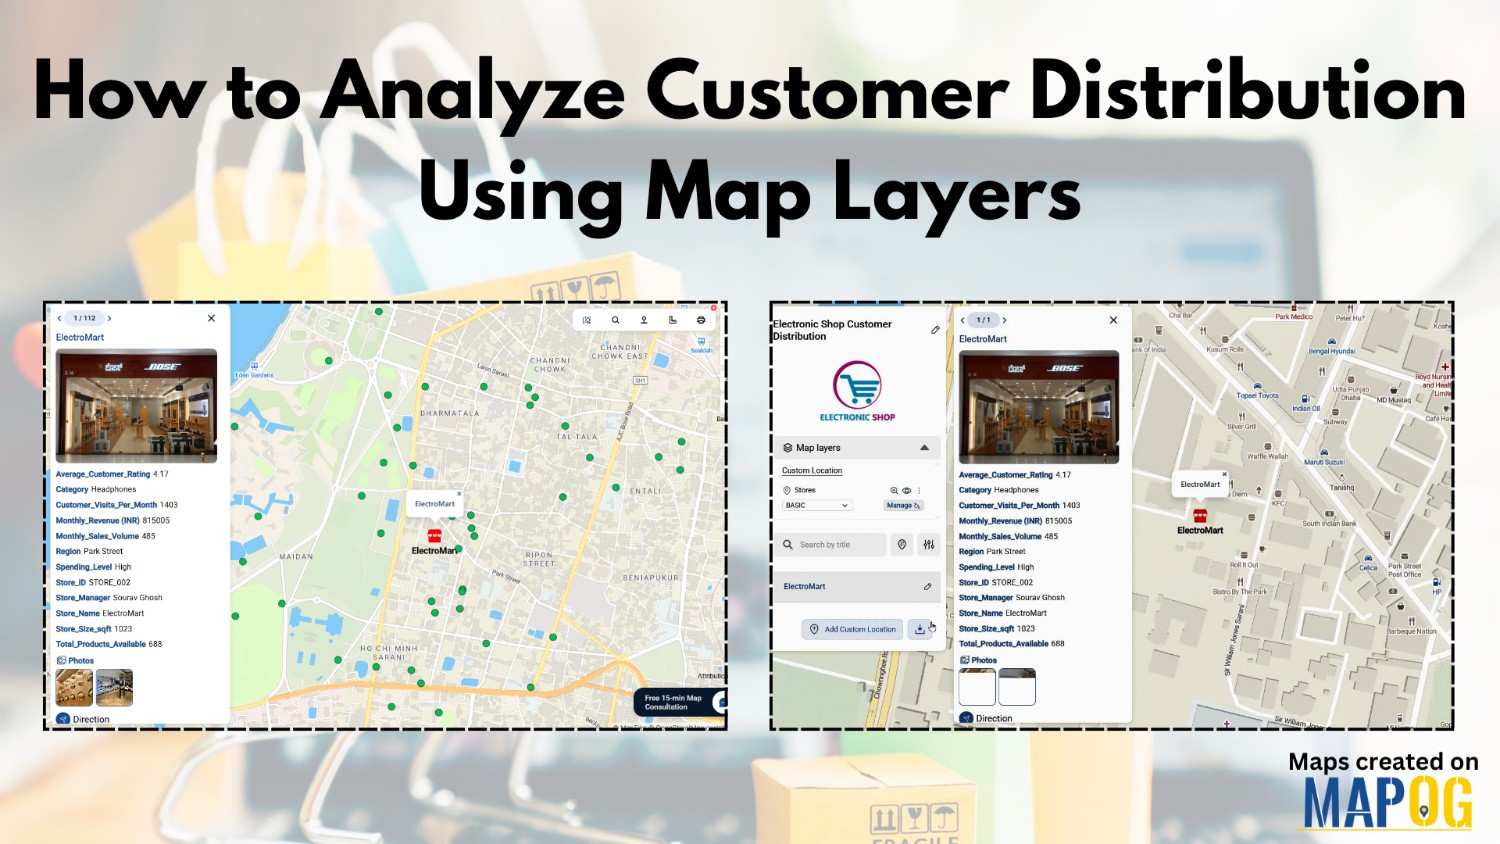
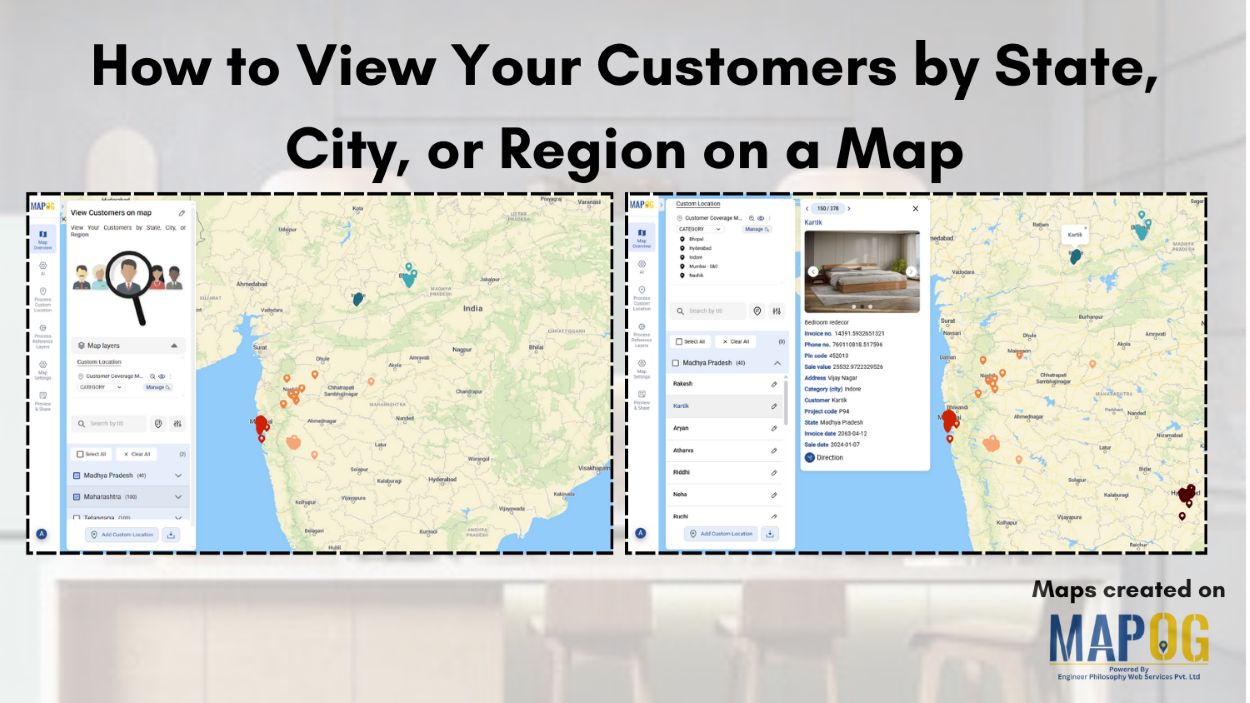
#DataVisualization

3 Easy Ways to Add Story Points and Narratives to Your Map

Adding story points and narratives to your map transforms it from a simple visual into an interactive story. Rather than displaying locations, you connect each point with details like descriptions, photos, etc. MAPOG, provides 3 easy ways to add story points making it easy and flexible; you can do it by uploading Excel or CSV … Read more

How to Create a Shareable Map Portfolio from Excel/CSV Data

Create a shareable map portfolio from Excel/CSV data to bring your projects to life in a visually compelling way. Although spreadsheets are excellent for storing detailed information, they often fall short in conveying the scale, diversity, and geographic reach of your work. While using MAPOG, you can transform that same data into an interactive map … Read more

Creating 3D Building Maps

Creating 3D Building Maps for Your Real Estate Project

In the real estate industry, clients often struggle to understand brochures or flat layouts because they don’t provide enough clarity about building height, structure, or availability. 3D Building Maps can enhance communication by providing realistic height visualizations, property details, floor plans, and furnishing status for buildings. MAPOG make this process more intuitive through features such … Read more

Dynamic Map

What Is a Dynamic Map and How to Create One Online

In today’s fast-paced, connected world, dynamic maps have become essential tools for navigating both everyday life and complex journeys. Unlike traditional static maps, dynamic maps are interactive and responsive i.e. they allow users to zoom, pan, click for details, and customize views with layers or markers. From urban planning to planning efficient routes, these digital … Read more

Showing map view of customer locations with popups, created after uploading excel data of customer list

How to Upload Your Customer List (CSV or Excel) and Plot It on a Map

When you upload your customer list in Excel or CSV format, you’re storing useful details like names, addresses, and service records, but the data stays flat. That’s because spreadsheets don’t show you where customers are clustered, which areas are under served, or how your field teams move across zones. As a result, it’s hard to … Read more

final visuals of GeoJSON data on an interactive map

How To Visualize GeoJSON Data On Interactive Maps

Trying to visualize GeoJSON data can be challenging when moving from raw spatial data to an interactive map. Although GeoJSON is widely used to store geographic features and attributes, it lacks built-in styling and interactivity. This makes raw files difficult to interpret, especially for non-technical audiences. Moreover, converting GeoJSON into a usable map often requires … Read more

Cover page displaying interactive map presentation ready

How to Create Interactive Maps That Make Your Presentations Stand Out

To create interactive maps that make presentations stand out often runs into a familiar problem: spatial data gets flattened by static visuals. Bullet points can’t show movement. Charts miss relationships. And maps, when passive, lose their power to engage.This disconnect is especially clear when presenting franchise networks, logistics zones, or planning overlays. Without interactivity, audiences … Read more

Add Georeferenced Image Overlays on Map (PNG/GeoTIFF)

Adding a georeferenced image overlays, such as PNGs or GeoTIFFs, to a map can be challenging, whether it’s a scanned map, satellite image, or custom visual. The main challenge lies in aligning images with real-world locations so landmarks appear at the correct scale. MAPOG simplifies this process, users can upload PNGs and GeoTIFFs, manually align … Read more

Download Your Mapped Data in Different Formats

Download Your Mapped Data in Different Formats

Interactive maps do more than just visualize locations—they also store valuable data that can be exported, shared, and analyzed across multiple platforms. For instance, whether you’re tracking coffee shops, field points, real estate listings, or even survey data. MAPOG lets you download your mapped data layers in formats like CSV, XLS, JPG, KML, or SHP. … Read more

Why Every Business Needs a Visual Map, Not Just a Dashboard

Why Every Business Needs a Visual Map, Not Just a Dashboard

Dashboards summarize numbers, but visual maps reveal where and why things happen. Business Needs a Visual Map for example, a coffee chain can use MAPOG to see café locations, spot top performers, and analyze competitor proximity in one interactive platform. Moreover, visual maps also help real estate, logistics, healthcare, and many other industries turn complex … Read more