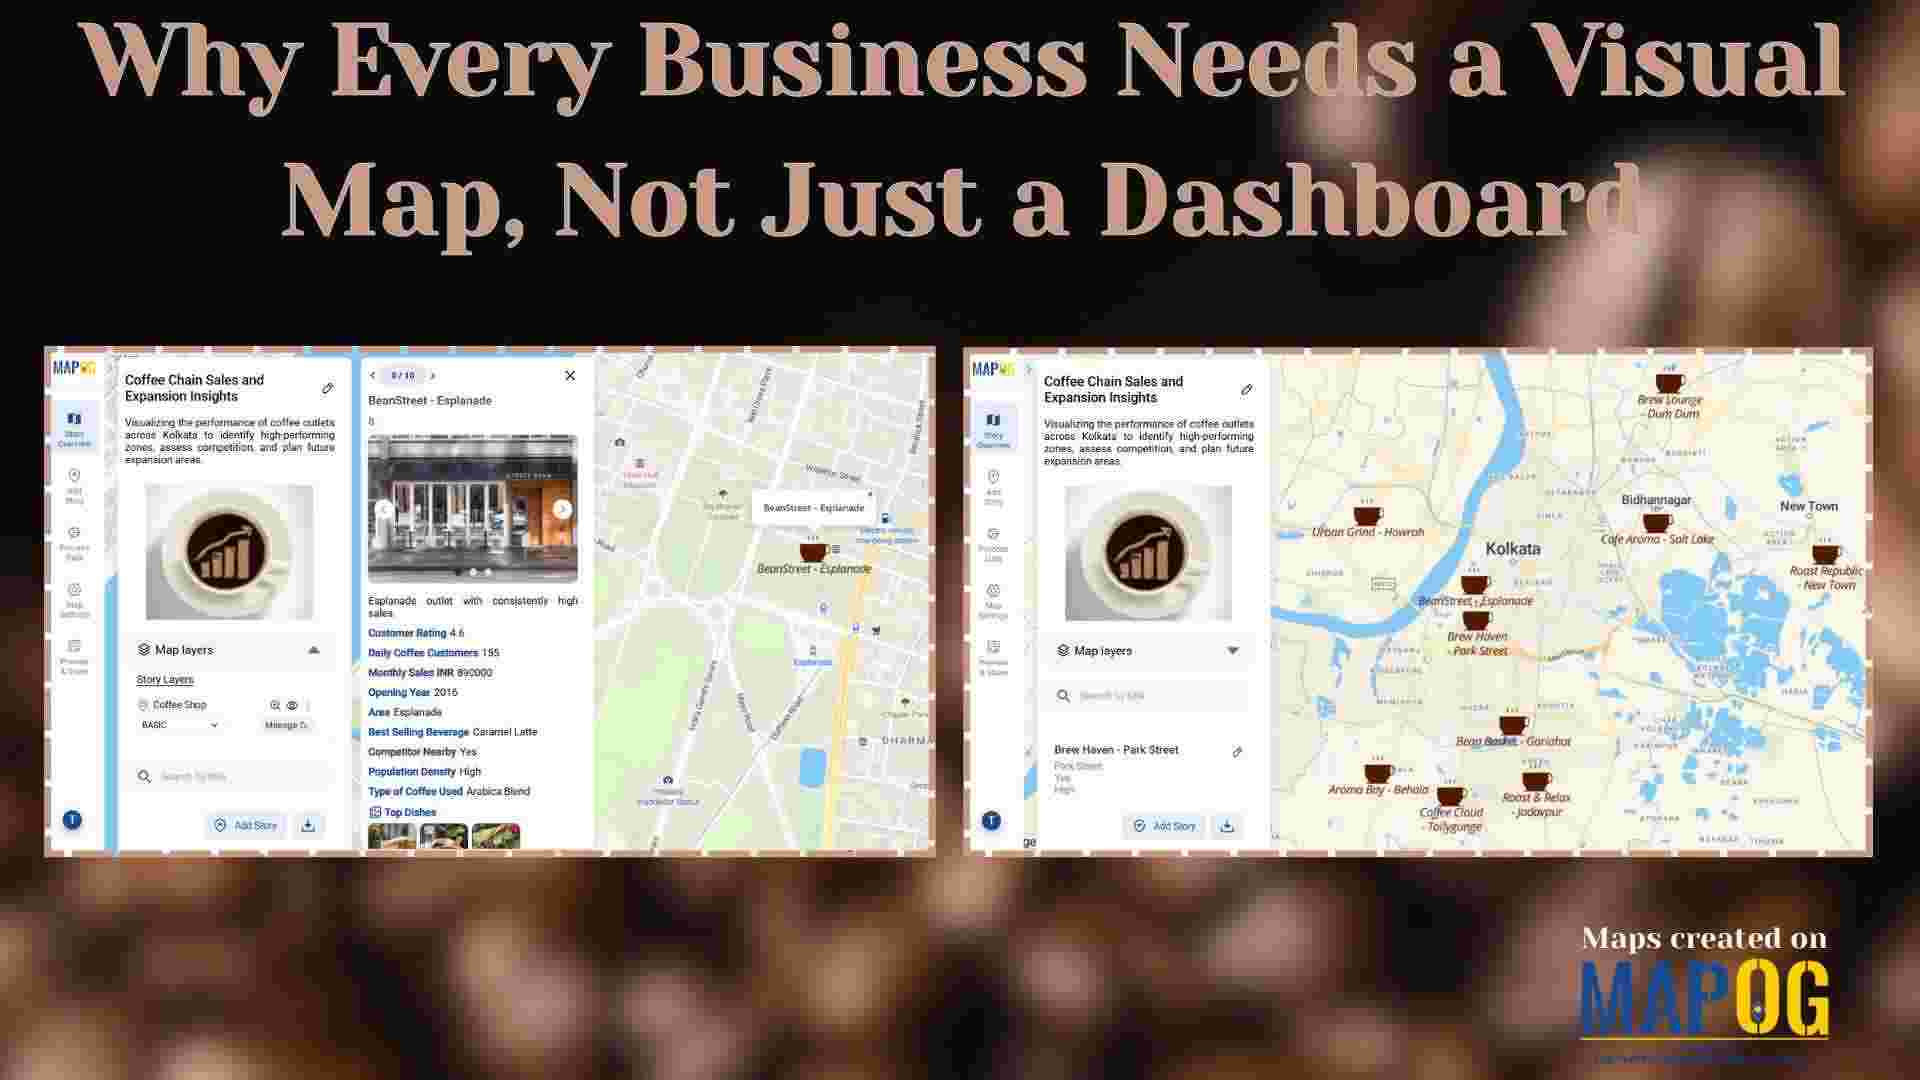
Why Every Business Needs a Visual Map, Not Just a Dashboard
Dashboards summarize numbers, but visual maps reveal where and why things happen. Business Needs a Visual Map for example, a coffee chain can use MAPOG to see café locations, spot top performers, and analyze competitor proximity in one interactive platform. Moreover, visual maps also help real estate, logistics, healthcare, and many other industries turn complex … Read more