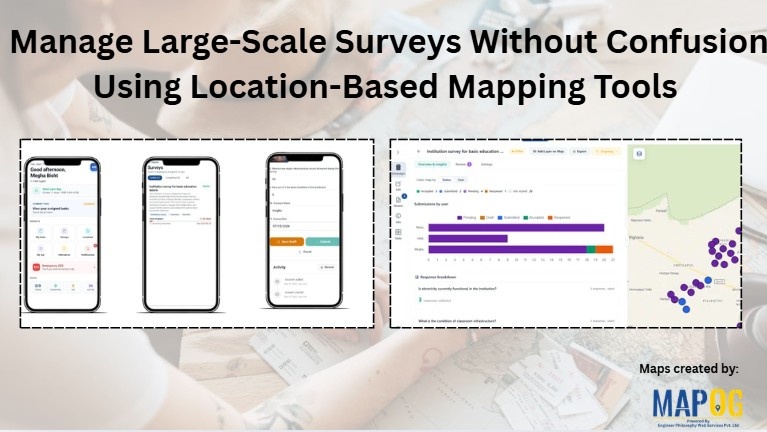
Site Selection

Interface showing location updates and user status dashboards with plotted points to search properties and perform feasibility using mobile data collection.

Search Properties and Perform Feasibility Analysis Using Mobile Data Collection on a Map

Real estate projects often stall because ownership records are unclear, zoning restrictions complicate approvals, and site accessibility or terrain conditions are poorly documented. Consequently, builders struggle to evaluate opportunities with confidence. Therefore, feasibility analysis is essential, transforming raw property data into insights on site conditions, market demand, and compliance. MAPOG streamlines feasibility analysis, enabling teams … Read more

creating solar survey installation easier way

Conduct Solar Site Surveys and Assess Installation Feasibility Using Mobile Data Collection

In solar infrastructure projects, inaccurate site observations and delayed updates often slow down execution, leading to redesign and cost overruns. Traditionally, teams rely on manual notes, scattered spreadsheets, or calls, which reduces accuracy and visibility. To address this, companies are now conduct solar site surveys using mobile data collection and digital mapping workflows. This approach … Read more

Real Estate Site Planning

Real Estate Site Planning and Feasibility Analysis Using GIS

In the competitive real estate market, site planning has become increasingly complex, often leading to project delays and increased costs due to challenges in evaluating land suitability and environmental constraints. However, GIS-based workflows, such as those provided by MAPOG, simplify these challenges by allowing planners to visualize and analyze site feasibility effectively, resulting in more … Read more

Conduct Builder Field Surveys

Conduct Builder Field Surveys for Site Development and Pipeline Layout Using Mobile Data Collection

In construction and infrastructure projects, issues like inaccurate site notes and delayed updates hinder execution, leading to rework and cost overruns. To address these challenges, companies are turning to Conduct Builder Field Surveys utilizing digital mapping and structured mobile forms. This method, particularly through structured GIS workflows, enables real-time capture of pipeline alignments, soil types, … Read more

MAPOG interface showing tools to Filter Your Map Data by attributes for smarter location and site selection.

How to Filter Your Map Data by Any Attribute or Field

Modern planning teams operate in environments where speed, accuracy, and clarity directly influence outcomes. Consequently, the ability to filter your map data by any attribute becomes a core strategic skill. In high-growth sectors like EV infrastructure, teams often evaluate hundreds of potential locations before selecting only a few high-impact sites. While this process traditionally demands … Read more

Create an Interactive Map with Photos & Details at Each Location

Attaching images & details to any kind of map provide a value that people could easily relate to themselves. For example, instead of scrolling through long property listings or dealing with brochures, MAPOG provides a platform to create interactive maps that makes it simple to display available real estate rooms, buildings, or commercial spaces on … Read more

Download Your Mapped Data in Different Formats

Download Your Mapped Data in Different Formats

Interactive maps do more than just visualize locations—they also store valuable data that can be exported, shared, and analyzed across multiple platforms. For instance, whether you’re tracking coffee shops, field points, real estate listings, or even survey data. MAPOG lets you download your mapped data layers in formats like CSV, XLS, JPG, KML, or SHP. … Read more

Why Every Business Needs a Visual Map, Not Just a Dashboard

Why Every Business Needs a Visual Map, Not Just a Dashboard

Dashboards summarize numbers, but visual maps reveal where and why things happen. Business Needs a Visual Map for example, a coffee chain can use MAPOG to see café locations, spot top performers, and analyze competitor proximity in one interactive platform. Moreover, visual maps also help real estate, logistics, healthcare, and many other industries turn complex … Read more

5 Inspiring Examples of Interactive Dynamic Maps You Can Create Online

Interactive and dynamic maps not only transform data into actionable visuals but also let users explore, interpret, and share insights. With MAPOG, you can not only map portfolios, campuses, routes, or stores but also organize, analyze, and visualize trends; moreover, this enables clearer, faster, and connected decisions. Key Concept: Why Create Interactive Dynamic Maps? Interactive … Read more

Interactive Maps for Better Engagement

Why Businesses Are Switching to Interactive Maps for Better Engagement

Businesses today are moving beyond static visuals and lengthy reports — they’re using interactive maps for better engagement to turn raw data into visual stories. From real estate firms displaying project portfolios to tourism companies mapping destinations, and logistics brands tracking operations, interactive mapping platforms like MAPOG are helping businesses communicate more effectively and engage … Read more