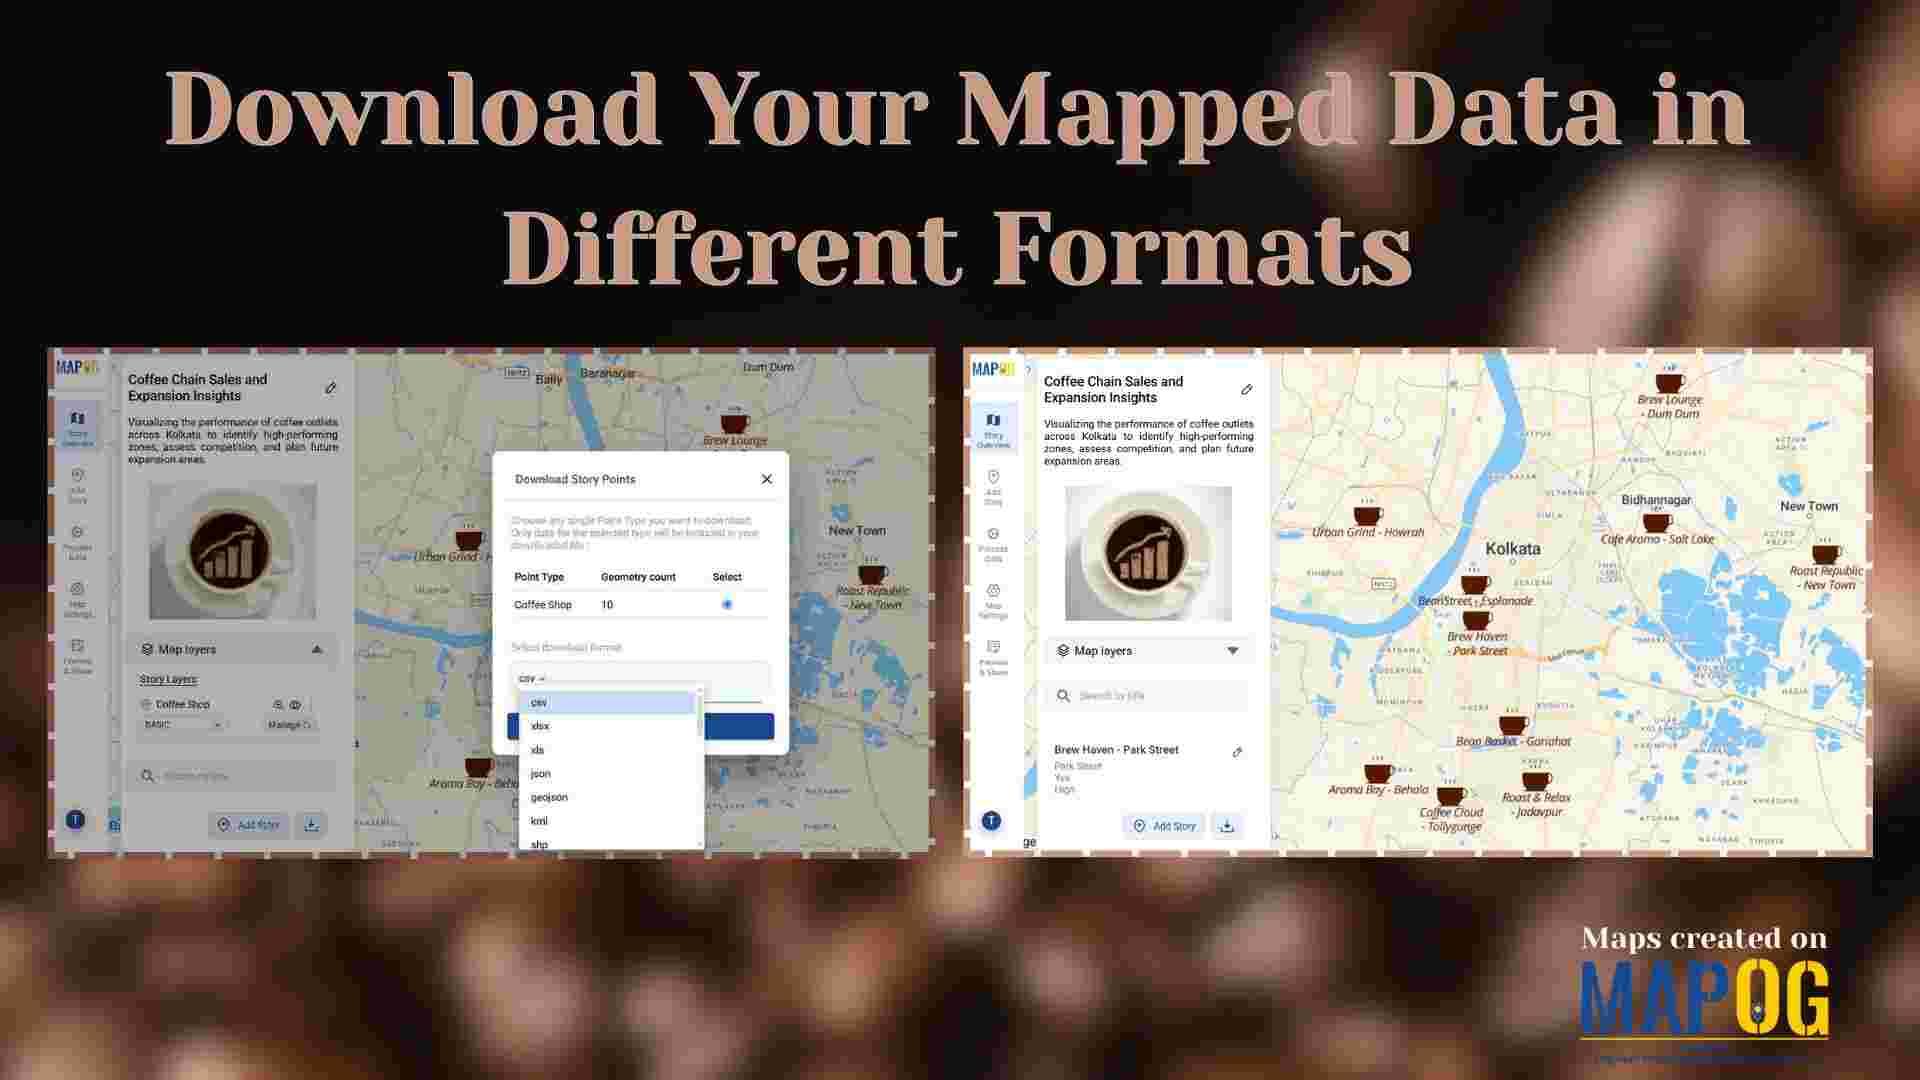
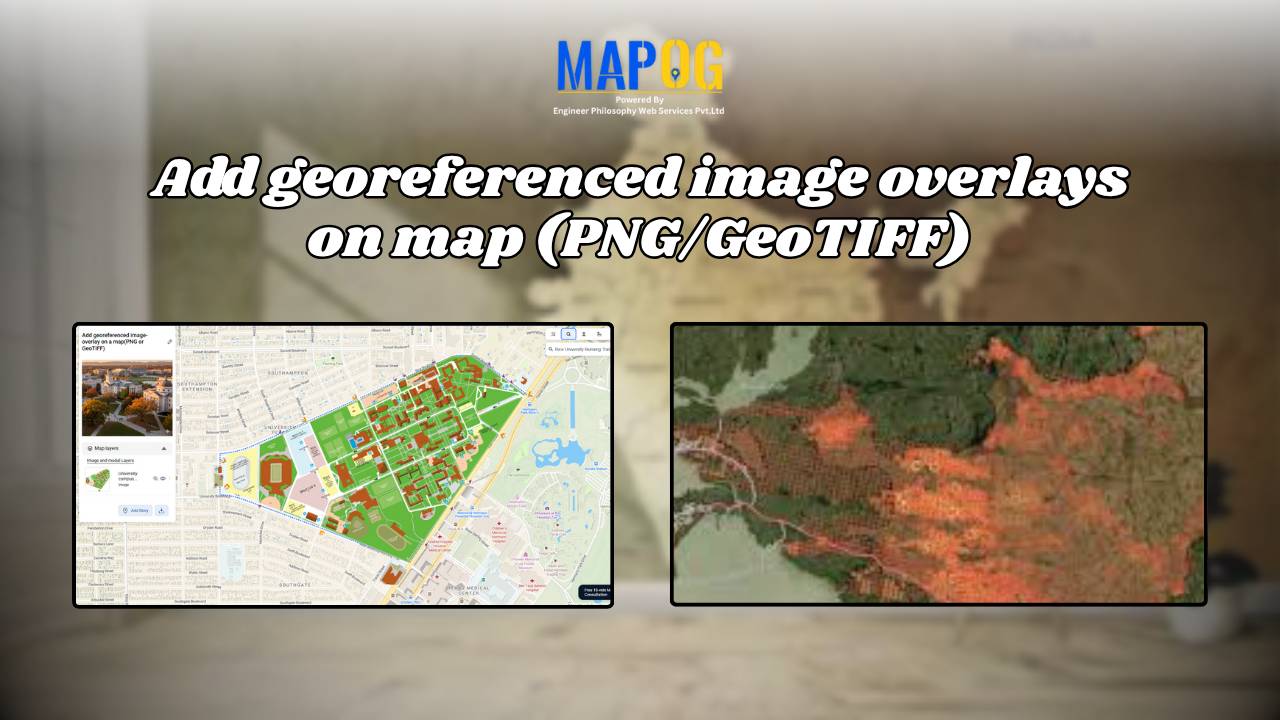
GISdata

How to use GIS for Mapping Disease Affected Area

 Geographic Information System is an emerging field that combines spatial analysis, statistical modeling and data visualization. We can create maps by pinpointing the location of disease outbreak by using a “point to polygon tool” and help us lineate the affected area smoothly and effortlessly. Key concept  Analysis of disease affected areas by using point to … Read more

How to Use Isochrone Maps for Business Growth & Location Planning

In today’s fast-paced world, businesses need tools that help them make data-driven decisions. Isochrone maps, which visualize areas accessible within a certain time or distance, can be a game-changer. They provide insights into customer reach, delivery zones, and more. This article explores how isochrone maps can benefit your business and use MAPOG to create meaningful … Read more

A Beginner’s Guide to Mapping GIS Data Online

With the advancements in today’s digital world, GIS data is a necessary element for any professional or enthusiast in urban planning, environmental monitoring, or simply the creation of a visual story. The integration of GIS data with an online map is, thus, an indispensable skill. In the following pages, we shall describe how to incorporate … Read more