Environmental

Smart Labelling

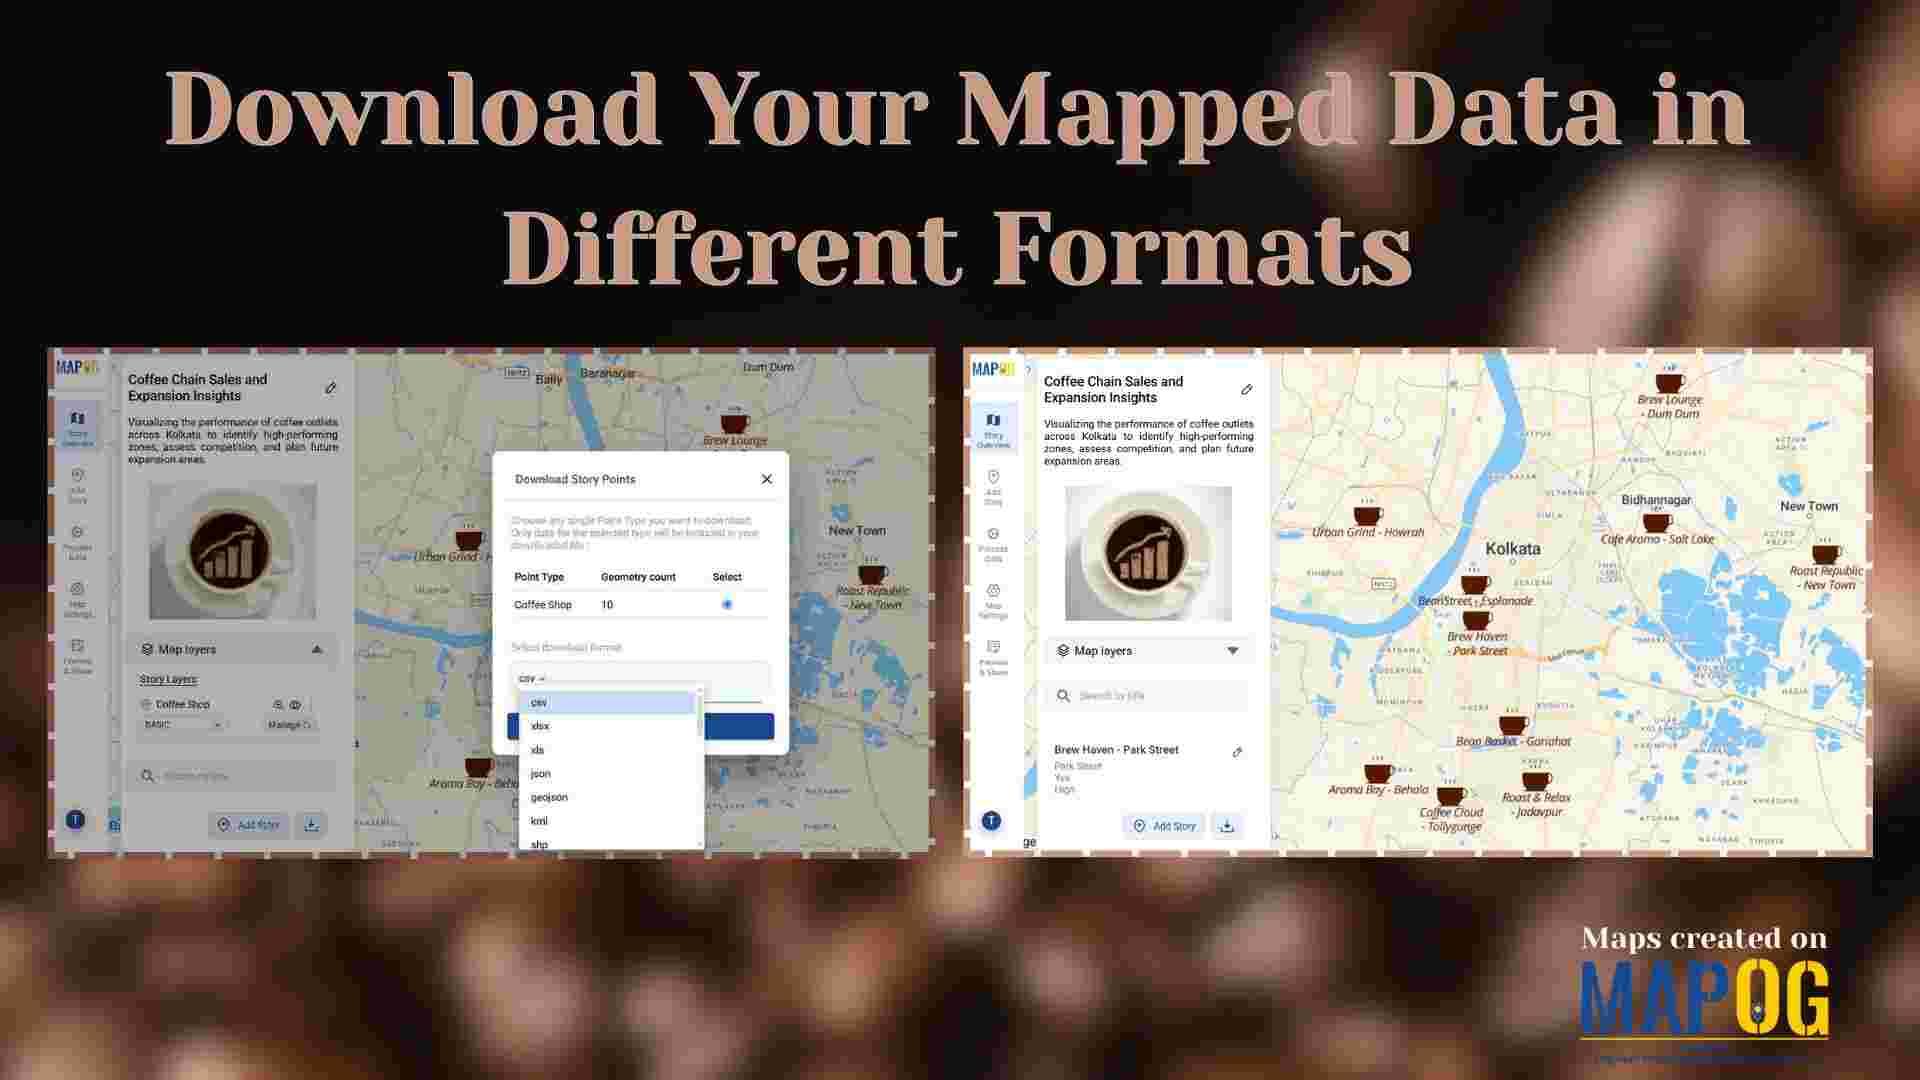
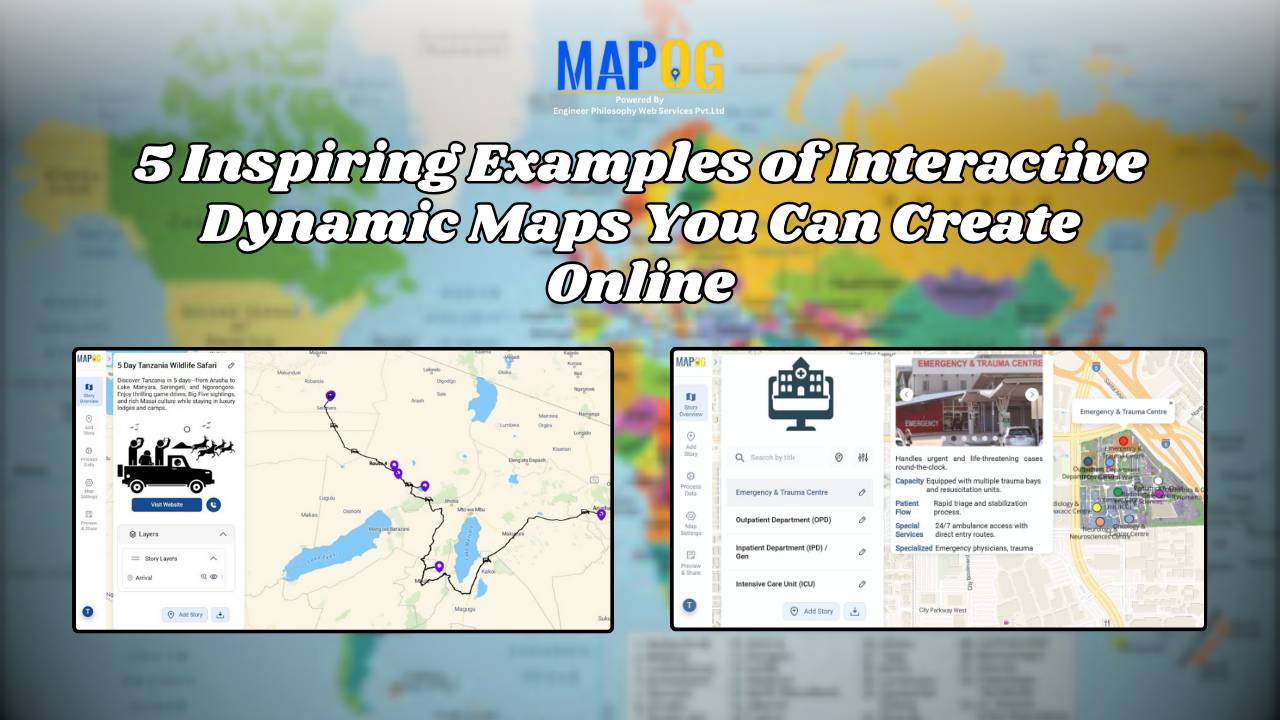
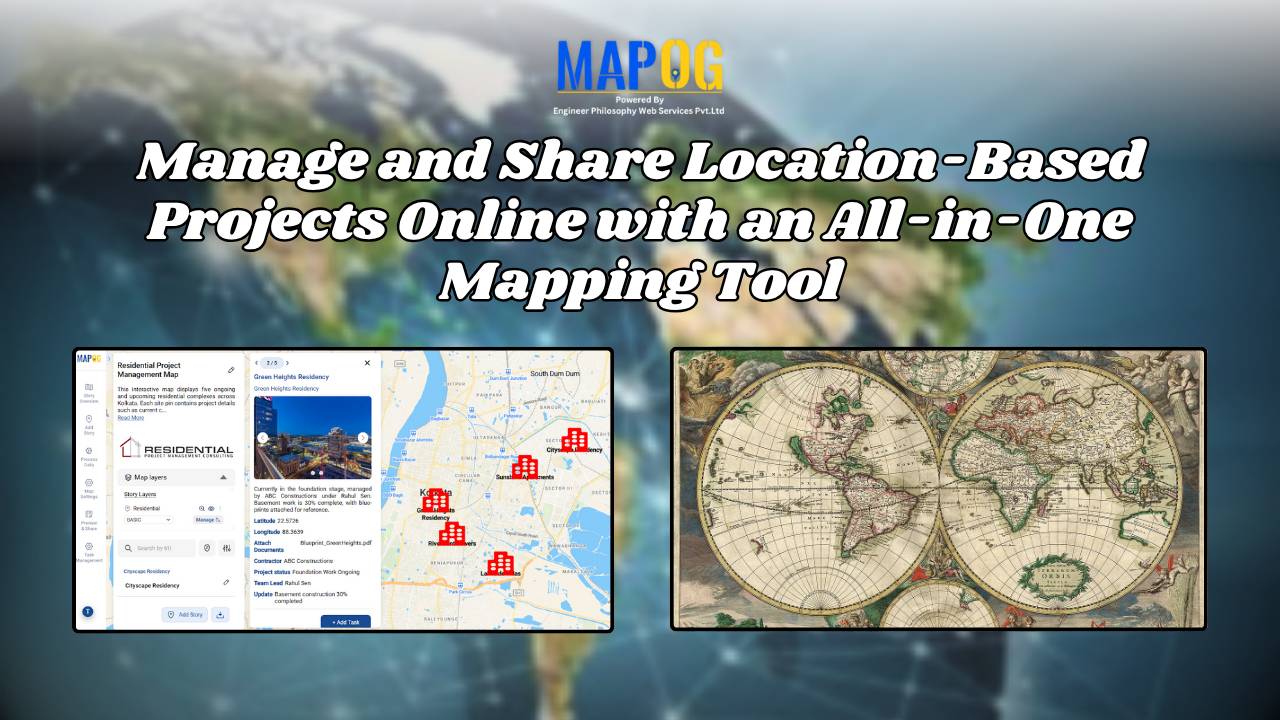
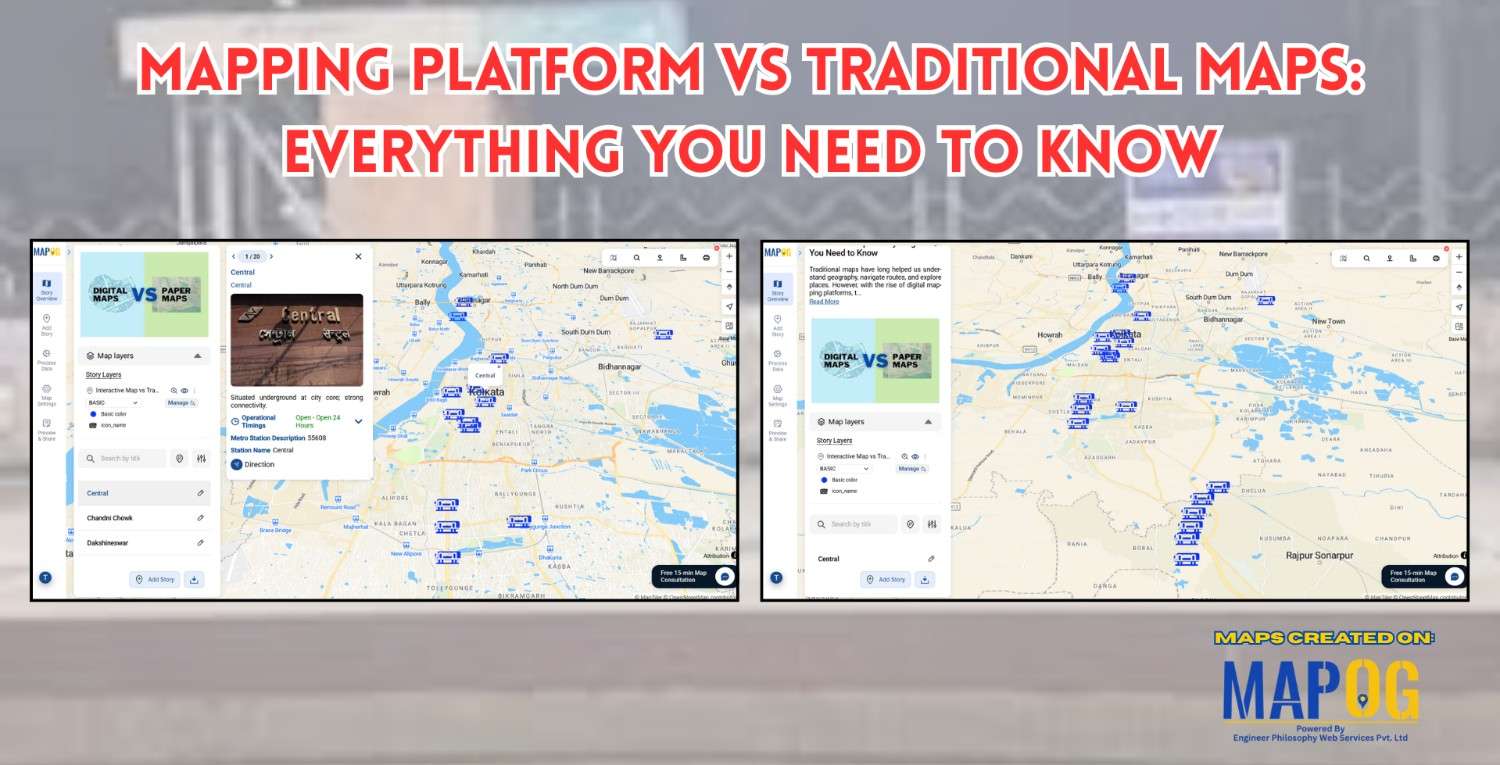
Smart Labelling in Maps: How to Create Clear, Interactive, and Professional Map Designs

In today’s world, where Interactive maps have become an essential tool for everything from navigation to data analysis, clarity and readability are key. A map becomes effective when it presents its data clearly and meaningfully. One of the most overlooked yet crucial elements of good map design is smart labelling; the art of making map … Read more

Download Your Mapped Data in Different Formats

Download Your Mapped Data in Different Formats

Interactive maps do more than just visualize locations—they also store valuable data that can be exported, shared, and analyzed across multiple platforms. For instance, whether you’re tracking coffee shops, field points, real estate listings, or even survey data. MAPOG lets you download your mapped data layers in formats like CSV, XLS, JPG, KML, or SHP. … Read more

5 Inspiring Examples of Interactive Dynamic Maps You Can Create Online

Interactive and dynamic maps not only transform data into actionable visuals but also let users explore, interpret, and share insights. With MAPOG, you can not only map portfolios, campuses, routes, or stores but also organize, analyze, and visualize trends; moreover, this enables clearer, faster, and connected decisions. Key Concept: Why Create Interactive Dynamic Maps? Interactive … Read more

Manage and Share Location-Based Projects Online with an All-in-One Mapping Tool

In today’s fast-paced project environments, tracking multiple sites, teams, and resources across locations is a major challenge. Therefore, to manage and share location-based projects, and moreover to help construction managers track distributed sites, project mapping now provides an all-in-one solution. With MAPOG, even a simple Excel sheet can quickly transform into an interactive map; as … Read more

Mapping Platform vs Traditional Maps

Mapping Platform vs Traditional Maps: Everything You Need to Know

In today’s world, mapping platform vs traditional maps is a common debate, meanwhile where technology drives nearly every decision, the way we view and use maps has transformed dramatically. Historically, traditional maps once served as our primary guides offering static representations of geography, routes, and landmarks. However, with the rise of modern mapping platforms like … Read more

How to Plot Borewell Data on a Map All at Once Without Manual Entry

In water resource projects, visualizing borewell data is crucial for informed decision-making. Manual plotting, however, is tedious and error-prone. The ability to plot borewell data on a map simultaneously, without manual entry, makes the process faster and more reliable. MAPOG simplifies this through features like “Add by uploading CSV/Excel” and integrated task management. This then … Read more

How to Create a Safari Itinerary Map for Your Trip

Create & Share a Safari Itinerary Map for Your Trip

If you’re planning a safari, visualizing your journey on a map can turn your travel plans into an interactive and shareable experience. From visiting to all safari locations and back, mapping your safari helps you track routes, highlight wildlife hotspots, and organize activities. Using MAPOG, you can create a rich safari itinerary map that’s engaging, … Read more

Fire Station Mapping: How GIS Fire Safety Maps Improve Emergency Response & Community Safety

Fire station mapping is an important step as fires spread fast, and when communities lack nearby fire stations, hydrants, or safety infrastructure, the risk of damage rises dramatically. That’s why mapping fire safety infrastructure has become an essential tool for city planners, emergency responders, and local authorities. furthermore using GIS-based interactive tools like MAPOG to … Read more

How Mapping Community Water, Energy and Environmental Projects Can Drive Sustainable Development

How Interactive Maps Drive Community Water, Energy, and Environmental Projects

Sustainable development cannot be achieved without community-driven initiatives that focus on water, energy, and environmental needs. Moreover, Mapping Community Water, energy, and environmental projects offers a practical way to visualise data, highlight impact, and ensure transparency. In fact, by creating interactive maps, decision-makers, NGOs, and local communities can track project status, monitor beneficiaries, and share … Read more