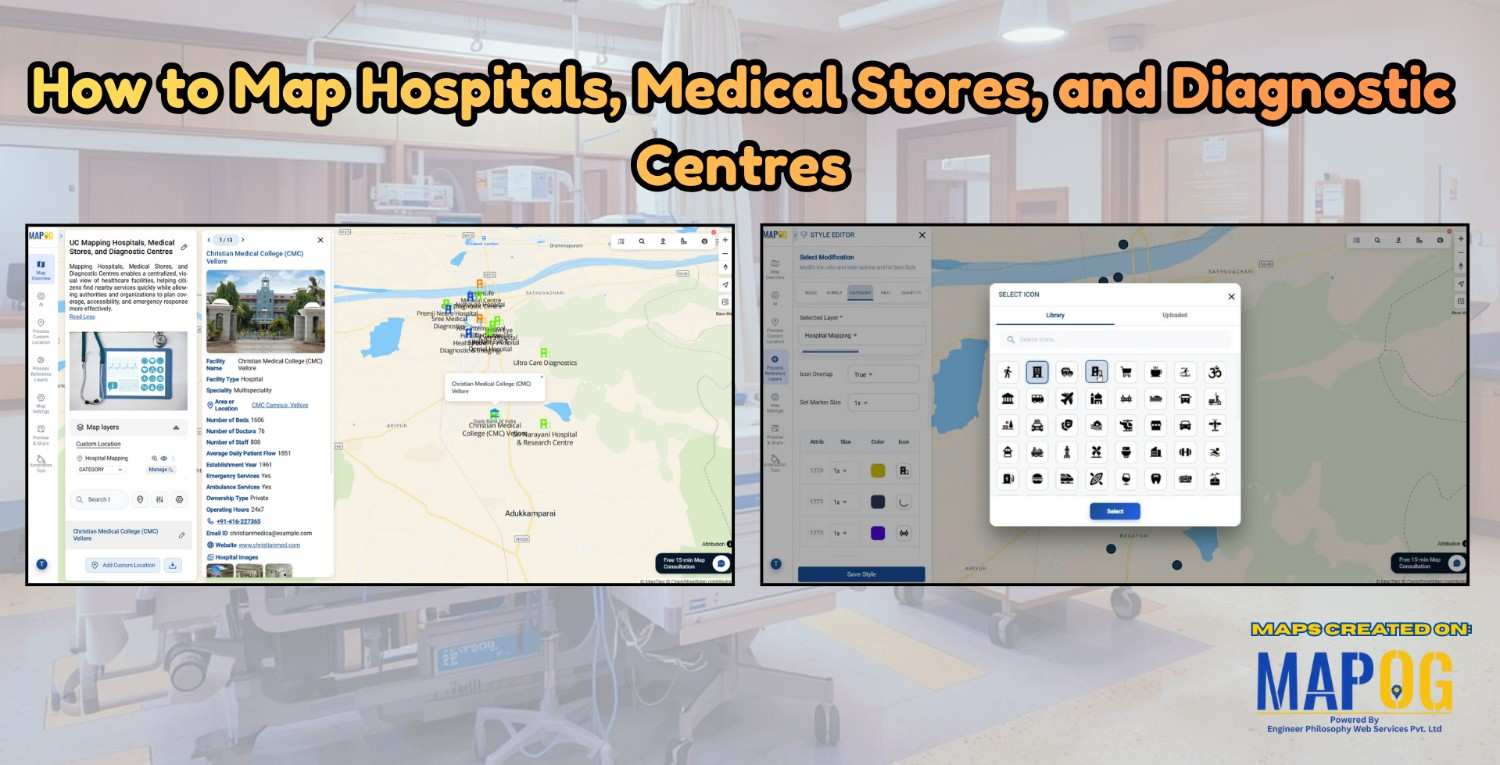
SpatialAnalysis

GIS Mapping of Landslide

GIS Mapping of Landslide-Prone Villages and Road Accessibility

In recent years, the importance of GIS Mapping of Landslide-prone areas has grown significantly. As climate conditions continue to worsen and extreme weather becomes more frequent, it is becoming increasingly critical to assess not only the vulnerable zones but also how surrounding communities and nearby roads can be affected. Consequently, this blog will walk you … Read more

Performing Retail Site Selection with Convex Hull Analysis

Choosing the right retail location goes beyond guessing where people shop. Instead it’s about recognizing spatial clusters, identifying market gaps, and optimizing coverage. With this in mind, MAPOG, retailers can make data-driven decisions by interpreting customer and store distributions visually. Coupled with heat bubble styling, grid-based analysis, or retail site selection , MAPOG enables smarter … Read more

Mapping Hotel Branches for Better Hospitality Management

Effectively managing several hotel locations is crucial for providing consistent service and upholding brand standards in the dynamic hospitality sector. By making it possible to visualise and analyse hotel branch data on interactive maps, Geographic Information Systems (GIS) provide a contemporary solution. Using intelligent GIS tools like MAPOG to map hotel branches improves decision-making, streamlines … Read more

Map River and Road Intersections for Environmental Analysis

Create a Map of River and Road Intersections for Environmental Analysis

To begin with, understanding the intersection between rivers and road networks is essential for effective environmental planning and risk management. In particular, these road and river intersections can indicate areas vulnerable to flooding, erosion, or pollution. By doing so, urban planners, environmental analysts, and disaster response teams to make data-driven decisions that improve sustainability and … Read more

How to Create Interactive Maps Without Any Technical Skills

How to Create and Embed Live Maps on Your Website in Minutes

In today’s data-driven world, learning how to create and embed live maps into your blog or Website can instantly boost engagement and clarity. Whether you’re showcasing public services, identifying urban gaps, or promoting inclusivity, interactive maps transform static content into immersive, insightful experiences no GIS skills required. With MAPOG, a no-code mapping tool, anyone can … Read more

Create interactive maps using MAPOG without technical skills

Create Interactive Maps Without Any Technical Skills – A Visual Guide

Creating interactive maps no longer requires technical skills or expertise in geographic information systems. Today, even individuals without a background in GIS can visualise and analyse spatial data to better understand real-world issues. Whether you’re a teacher, student, or policy planner, interactive maps can powerfully communicate patterns, challenges, and opportunities in education, healthcare, infrastructure, and … Read more

Best Places to Visit in All Indian States

Top places to Visit Across India – Visual Travel Guide on Map

India is more than a destination it’s a vibrant journey through culture, nature, and heritage. With the MAPOG code-free mapping platform, you can effortlessly transform your travel plans or blog into an interactive visual experience, highlighting top places to visit across India. From sacred sites to scenic wonders, bring India’s diversity to life all in … Read more

Mapping Borewell Locations Near Rivers and Lakes with GIS-Based Tools

Mapping borewell locations near rivers and lakes is not only vital for understanding groundwater dependencies but also essential for ensuring sustainable usage. In fact, in regions where surface water and groundwater interact closely, analyzing borewell proximity to these natural water bodies becomes even more crucial. Moreover, with the help of GIS-based tools like MAPOG, users … Read more

Interactive Population Maps

Interactive Population Map with Heat Bubble and Category Styling

Analysing and interpreting population data across various geographic regions can be done visually with Interactive Population Maps with Heat Bubble and Category Styling. It is simple to quickly identify high and low concentration areas on these maps because they use heat bubbles, which vary in size and colour, to represent population density or totals. Furthermore, … Read more

GIS for real estate

GIS in Identifying High-Growth Areas for Real Estate Investment

In today’s fast-evolving urban landscape, identifying the right location for real estate investment is both a science and a strategy. GIS helps in Identifying High-Growth Areas is a go-to approach for investors and planners aiming to make informed, data-backed decisions. From analyzing transportation access to mapping nearby amenities, GIS adds a new level of depth … Read more