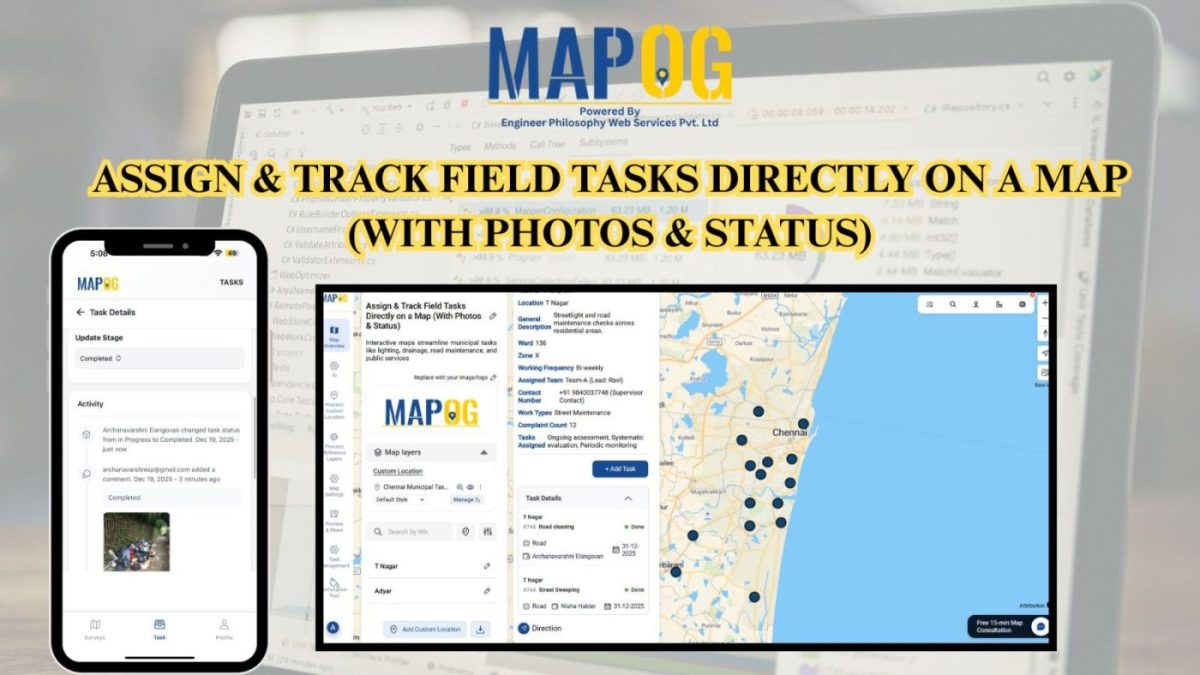
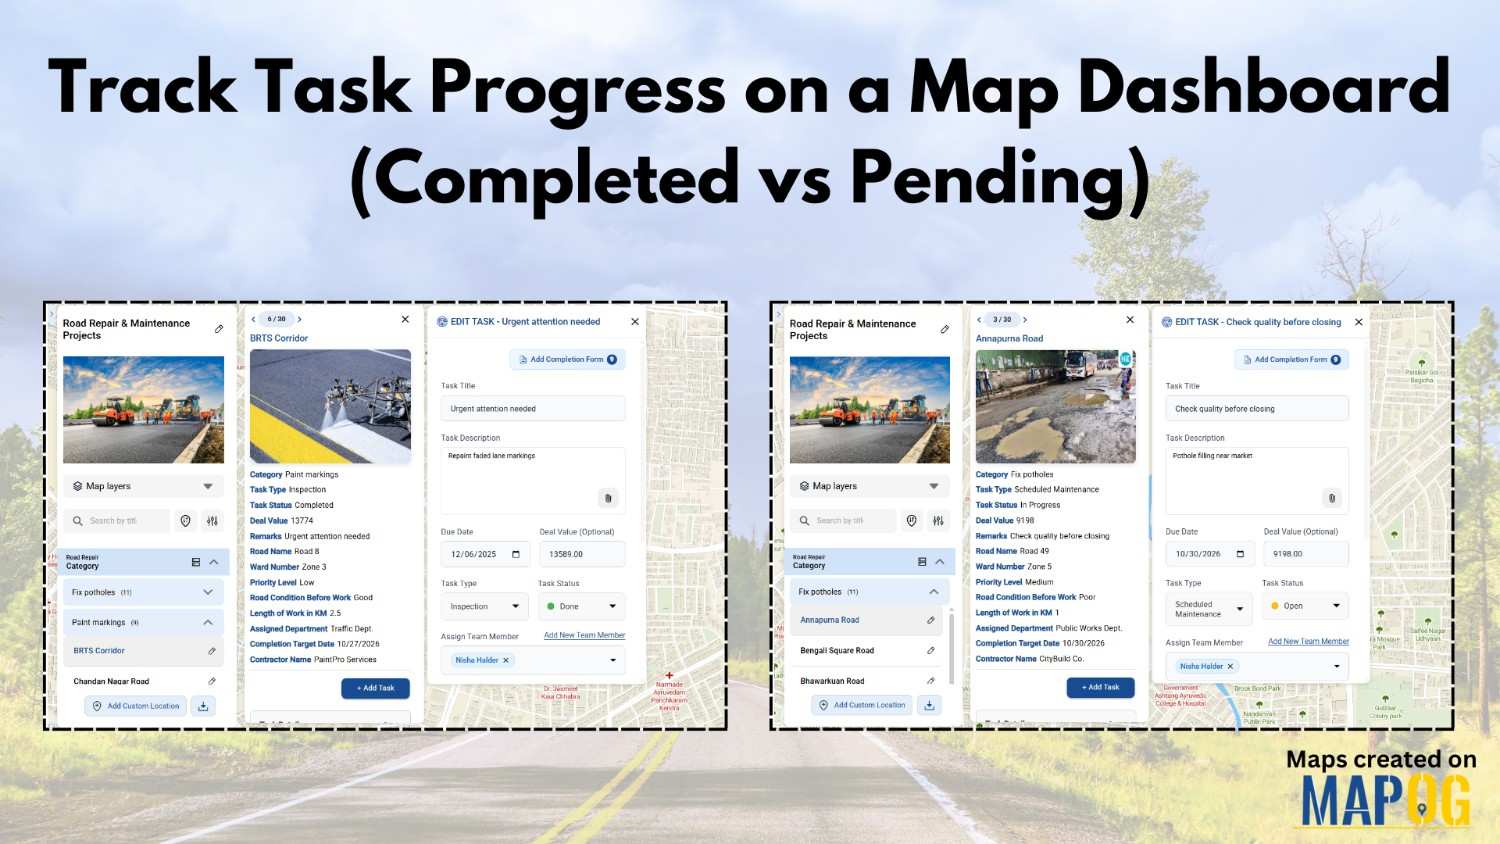
#GISMapping

How to Style Maps by Categories or Quantities in MAPOG?

Interactive maps are powerful tools for visualizing data in a way that’s easy to understand and engaging. Style Maps by Categories or Quantities in MAPOG allows you to highlight trends, differences, and relationships effectively. Whether you’re mapping demographic data, business insights, or geographical patterns, the ability to customize styles is crucial for making your data … Read more

How to use GIS for Mapping Disease Affected Area

 Geographic Information System is an emerging field that combines spatial analysis, statistical modeling and data visualization. We can create maps by pinpointing the location of disease outbreak by using a “point to polygon tool” and help us lineate the affected area smoothly and effortlessly. Key concept  Analysis of disease affected areas by using point to … Read more

Isochrone Analysis in GIS: Optimize Travel Times for Faster Delivery & Urban Planning

In the fast-paced world of urban logistics, the ability to understand and optimize travel times is essential for businesses like food and grocery delivery services. One powerful tool in their arsenal is isochrone analysis. Isochrone Analysis: Mapping Travel Times, Let’s explore what isochrones are, how they work, and the significant impact they have on streamlining … Read more

Creating Point Data for Urban Planning: Digitizing Settlement Features & Infrastructure Mapping

In the vast landscape of Geographic Information Systems (GIS), the meticulous process of mapping settlement features stands as a cornerstone of urban planning, environmental assessment, and resource management. Settlement features, ranging from individual households to sprawling cityscapes, serve as critical focal points in understanding human habitation patterns and societal dynamics. With the help of MAPOG … Read more

Best GIS Tools for Healthcare Analysis: Enhancing Accessibility & Resource Allocation

Healthcare is an industry in which the basis for many decisions could be driven by data. For instance, healthcare services can be effectively analyzed with spatial insight into resource allocation and disease distribution, which, in turn, determines the accessibility of care. Therefore, this article presents some of the best GIS tools available for healthcare professionals … Read more

Thematic Mapping for Data Analysis: Visualizing Trends with Bubble Maps

Thematic Mapping for Data Analysis is a powerful technique used to visualize complex datasets by representing geographic patterns through color-coded maps and scalable symbols. One of the most effective methods in thematic mapping is Bubble Thematic Mapping, where data points are displayed as bubbles of varying sizes, proportional to a specific attribute such as population … Read more

Wildlife Corridor Planning: Using GIS Cross Intersection Analysis for Safe Migration

By identifying crucial junctions with human infrastructure, “Wildlife Corridor Planning using Cross Intersection in MAPOG” guarantees safe animal migration and habitat connectivity. This strategy protects biodiversity while reducing conflict. Key Concepts MAPOG’s Cross Intersection tool enables conservationists and planners to pinpoint critical intersections where wildlife corridors intersect infrastructure, enabling targeted mitigation strategies. Download MAPOG App … Read more