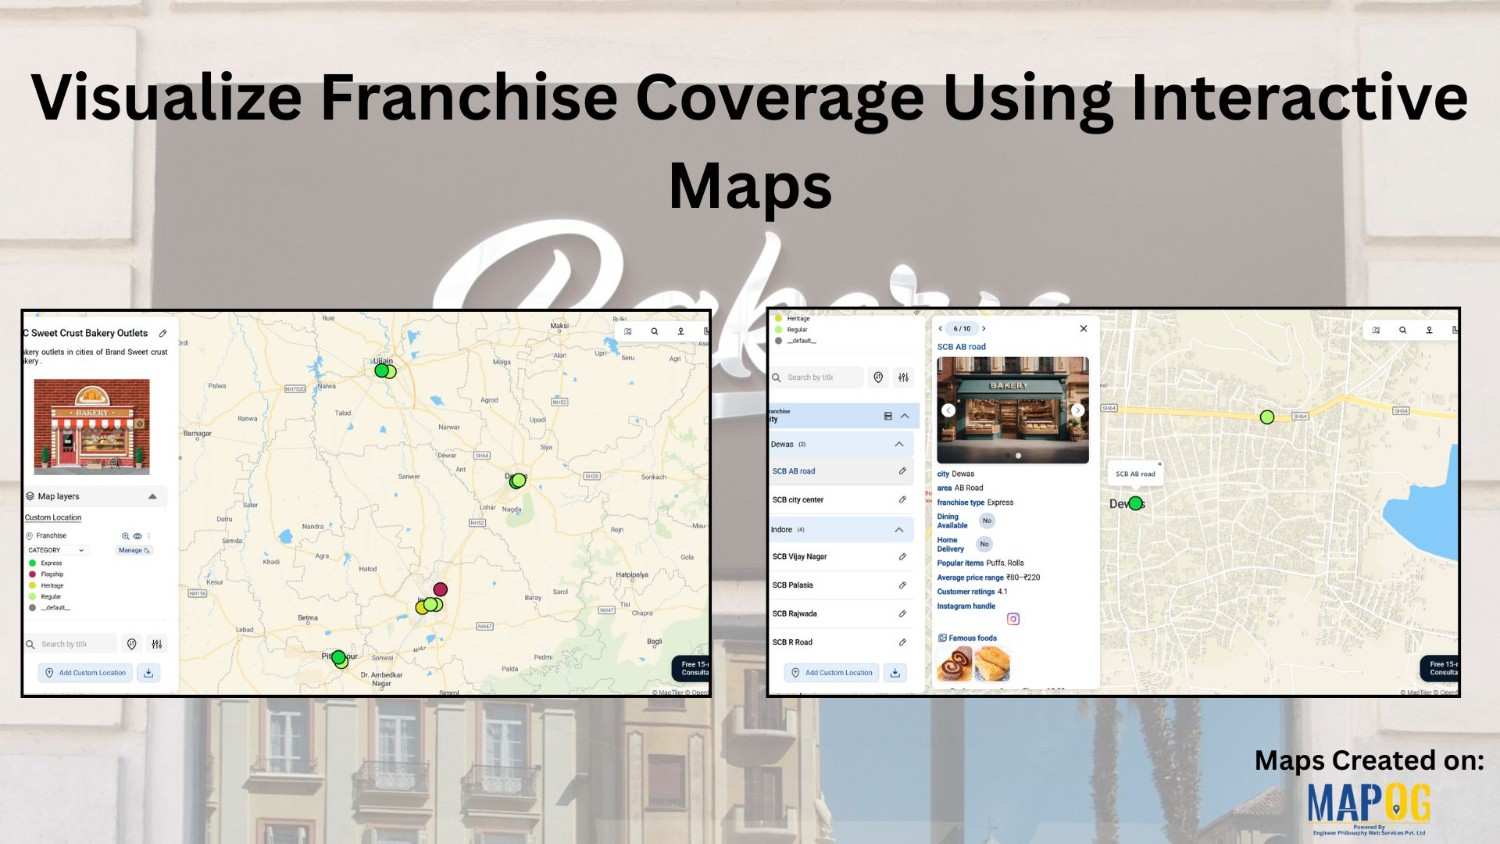
MAPOG Analysis

Ambulance Accessibility & Response Time Analysis

In life-threatening emergencies, every second counts. Consequently, ambulances must reach patients quickly. However, in many cities, emergency response times are slowed down by poor planning, traffic congestion, or lack of infrastructure. This is precisely where Geographic Information Systems (GIS) step in. Platforms like MAPOG are transforming how cities visualize Ambulance Accessibility & Response all without … Read more

GIS for real estate

GIS in Identifying High-Growth Areas for Real Estate Investment

In today’s fast-evolving urban landscape, identifying the right location for real estate investment is both a science and a strategy. GIS helps in Identifying High-Growth Areas is a go-to approach for investors and planners aiming to make informed, data-backed decisions. From analyzing transportation access to mapping nearby amenities, GIS adds a new level of depth … Read more

Country Wise UNESCO Guide: Top Heritage Spots on a Map

Create Countrywise UNESCO Map: Top Heritage Spots Guide

Create a country-wise UNESCO Guide Map that highlights both cultural brilliance and natural wonders. On the other hand, by integrating GIS tools, this project enhances public awareness, encourages responsible tourism, and supports heritage preservation. It offers users an educational and immersive storytelling experience that makes exploring global heritage sites more accessible, insightful, and engaging. Key … Read more

How to create Major Historical Battles and War Sites Map

History isn’t just about events it’s about where they happened. From ancient conquests to world wars, every major battle unfolded on a map. In this guide, we’ll walk through how to build a stunning “Historical Battles and War Sites” story map using MAPOG. you can transform history into an interactive journey by creating a “Major … Read more

Mapping Crime Hotspots

Mapping Crime Hotspots Using Grids and Heat Bubble Tools

Mapping crime hotspots is a critical approach in understanding and preventing urban crime. By visualizing clusters of criminal activity, law enforcement and urban planners can make informed, data-driven decisions. One modern way to do this effectively is through interactive mapping platforms that offer grid-based analysis and visual heat bubble styles—such as MAPOG’s intuitive tools. This … Read more

Mapping Healthcare Deserts in India

Identifying Areas with Limited Access to Doctors and Medical Facilities Mapping healthcare deserts in India helps expose one of the biggest barriers to healthcare access: geography. Although access to healthcare is a fundamental right, how soon someone can reach a hospital often depends more on location than need. Healthcare desert mapping—regions where timely access to … Read more

How to Upload and Visualize CSV Data on a Map

How to Upload and Visualize CSV Data on a Map

In today’s digital world, knowing how to upload and visualize CSV data on a map is essential for urban planning, environmental monitoring, and compelling visual storytelling. Moreover, with the growing importance of data-driven storytelling and location-based insights, MAPOG provides an intuitive platform to transform your spreadsheet data into interactive maps. As a result, users can … Read more

Embedding Maps Boosts Website Engagement: Real Estate Agents

Embedding Maps Boosts Website Engagement: Real Estate Agents

In today’s competitive digital marketplace, real estate agents are increasingly turning to interactive tools to stand out and better serve their clients. One of the most impactful tools in this space is an embedded map. By leveraging Geographic Information Systems (GIS), agents can provide rich, interactive experiences that go far beyond static listings. Through this … Read more

Mapping Noise Pollution Levels in Cities Using Heat Maps and Buffer Tools

Mapping Noise Pollution Levels: Using Heat Maps and Buffer Tools

Noise pollution is an increasingly critical yet often overlooked environmental challenge. In urban areas, it stems primarily from traffic, construction, railways, and industrial activities. Fortunately, with the rise of Geographic Information Systems (GIS) especially tools like heat maps and buffer zones for Mapping Noise Pollution Levels. We can now visualize these invisible pollutants. As a … Read more

Create an Online Map to Visualize and Collaborate on the 7 Wonders of the World

Learn geography & history by creating an interactive map that highlights the 7 Wonders of the World.

Discover geography and history by creating an interactive map of the 7 Wonders of the World—ideal for students, educators, and explorers. These iconic sites highlight human creativity, engineering, and cultural identity, each reflecting the unique legacy of its civilization. Using Geographic Information Systems (GIS), you can combine geography, history, and travel planning into an engaging … Read more