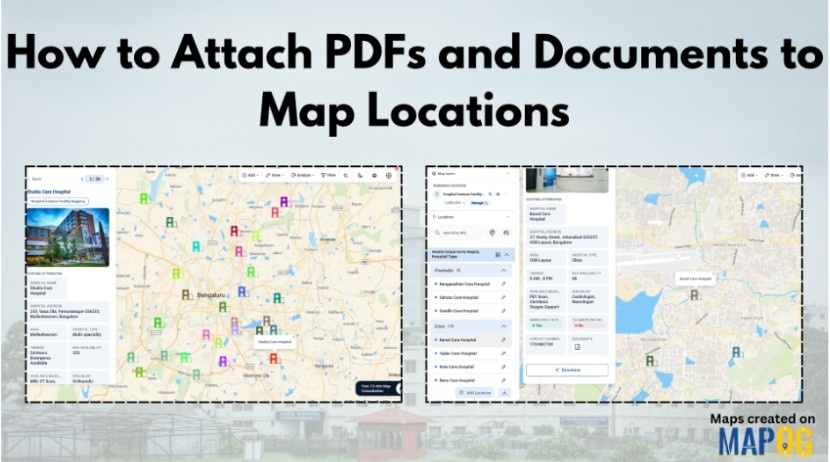
#DataVisualization

Featured image how to use geospatial filters to your Map

Using Geospatial Filters to Simplify Your Map

If your map feels crowded or confusing, you’re not alone. Many GIS projects start out clear but quickly become overwhelming as more layers and data are added. That’s where using geospatial filters to simplify your map can make all the difference. With MAPOG, which offers advanced filtering tools, this process becomes simple and accessible. Key … Read more

Add Contact Details and Customer Notes

Add Contact Details and Customer Notes Directly on the Map with Location Points

Whether you are managing a business network, tracking customer locations, or simply organizing site visits, adding contact details and notes directly on the map can make your workflow far more efficient. Traditional GIS platforms can be complex, but MAPOG allows users not only to visualize data but also to attach real-world data to each location … Read more

How to Draw 3D Buildings

How to Draw 3D Buildings on a Live or Dynamic Map

In the world of digital mapping, the concept of 3D mapping has changed how we visualize spaces. MAPOG is a mapping tool which allows users to draw realistic 3D buildings with ease, specifically for urban planning, real estate visualization, or educational use. Key Concepts of 3D Buildings You Should Know Drawing 3D buildings on a … Read more

Create an Interactive Map with Photos & Details at Each Location

Attaching images & details to any kind of map provide a value that people could easily relate to themselves. For example, instead of scrolling through long property listings or dealing with brochures, MAPOG provides a platform to create interactive maps that makes it simple to display available real estate rooms, buildings, or commercial spaces on … Read more

How to Map Your Customers Using Interactive Layers

Map Your Customers with Interactive Layers: Visualize Buying Patterns, Performance & Growth in Minutes

Map your customers with interactive layers turns plain data into clear business insights. In fact, this approach visualizes buying patterns, engagement, and regional performance. Moreover, it helps identify loyal customers, new prospects, and high-value areas instantly. Key Concept: Map Your Customers Interactive customer mapping merges sales, location, and engagement data into one dynamic platform using … Read more

3 Easy Ways to Add Story Points and Narratives to Your Map

Adding story points and narratives to your map transforms it from a simple visual into an interactive story. Rather than displaying locations, you connect each point with details like descriptions, photos, etc. MAPOG, provides 3 easy ways to add story points making it easy and flexible; you can do it by uploading Excel or CSV … Read more

How to Create a Shareable Map Portfolio from Excel/CSV Data

Create a shareable map portfolio from Excel/CSV data to bring your projects to life in a visually compelling way. Although spreadsheets are excellent for storing detailed information, they often fall short in conveying the scale, diversity, and geographic reach of your work. While using MAPOG, you can transform that same data into an interactive map … Read more

Creating 3D Building Maps

Creating 3D Building Maps for Your Real Estate Project

In the real estate industry, clients often struggle to understand brochures or flat layouts because they don’t provide enough clarity about building height, structure, or availability. 3D Building Maps can enhance communication by providing realistic height visualizations, property details, floor plans, and furnishing status for buildings. MAPOG make this process more intuitive through features such … Read more

Dynamic Map

What Is a Dynamic Map and How to Create One Online

In today’s fast-paced, connected world, dynamic maps have become essential tools for navigating both everyday life and complex journeys. Unlike traditional static maps, dynamic maps are interactive and responsive i.e. they allow users to zoom, pan, click for details, and customize views with layers or markers. From urban planning to planning efficient routes, these digital … Read more

Showing map view of customer locations with popups, created after uploading excel data of customer list

How to Upload Your Customer List (CSV or Excel) and Plot It on a Map

When you upload your customer list in Excel or CSV format, you’re storing useful details like names, addresses, and service records, but the data stays flat. That’s because spreadsheets don’t show you where customers are clustered, which areas are under served, or how your field teams move across zones. As a result, it’s hard to … Read more