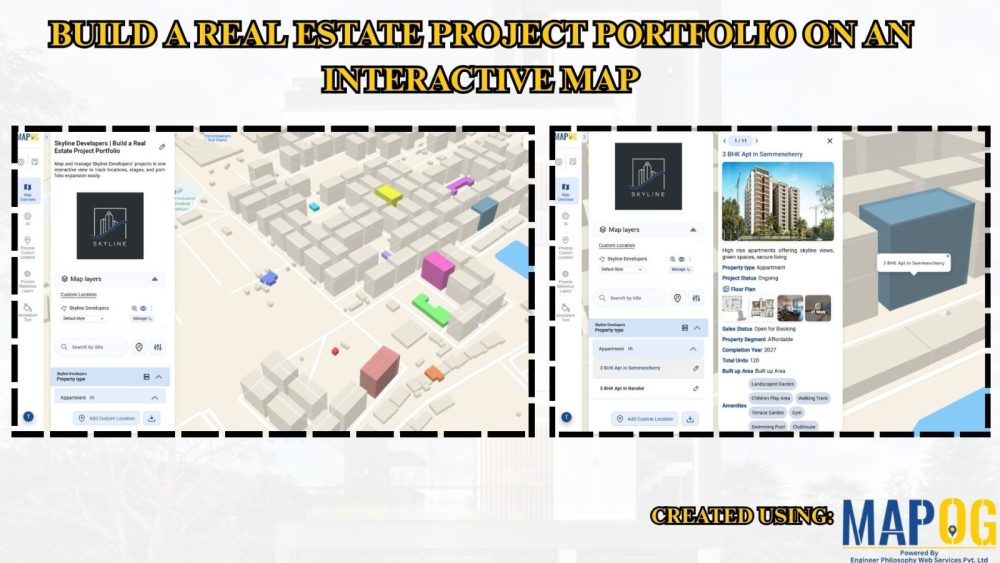
Build a Real Estate Project Portfolio on an Interactive Map
In the Real Estate Project Portfolio industry, spreadsheets limit visibility and location context. Flat listings reduce projects to rows, hiding regional spread and stage differences. MAPOG solves this by turning project data into an interactive map portfolio, enabling clearer comparison, quick insights, and better portfolio management. Key Concept: Real Estate Project Portfolio Interactive maps display all … Read more