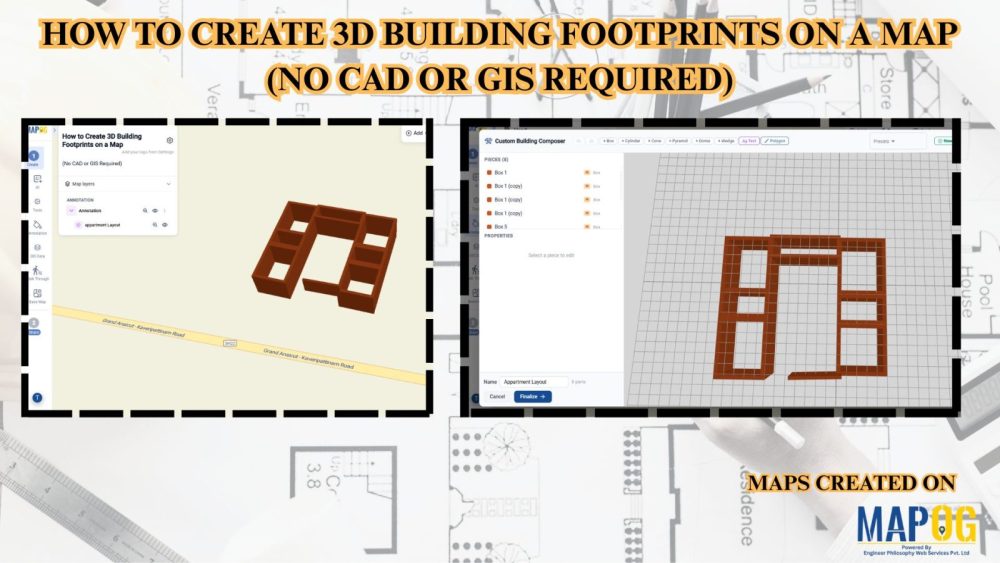
Blog

How to Visualize Population Data Using Interactive GIS Maps

How to Visualize Population Data Using Interactive GIS Maps

In population studies and urban planning projects, demographic data often stays limited to spreadsheets or reports, making it difficult to understand regional patterns and trends. Consequently, users struggle to identify population density, growth areas, or demographic distribution visually. MAPOG Visualize Population Data using interactive GIS maps. Key Concept: Why Use Interactive GIS Maps for Population … Read more

Using 3D Models on Maps for Real Estate and Infrastructure Projects

Using 3D Models on Maps for Real Estate and Infrastructure Projects

In real estate and infrastructure projects, 3D models often stay limited to design software or displays, making them difficult for clients to understand in real-world context. Consequently, they fail to show nearby roads, amenities, transport, or developments. MAPOG maps 3D models with location data. Key Concept – Why Use 3D Models on Maps Because maps … Read more

Create an Annotated Travel Map showing routes connecting locations with labels and images in a digital map interface

Create an Annotated Travel Map with Routes and Notes

To Create an Annotated Travel Map is to turn movement into meaning. Instead of static directions, you layer routes with insights, context, and memory. MAPOG elevates this workflow through precise annotation capabilities, so every path tells a story, not just a route. As a result, travelers, planners, and analysts move from “where” to “why it … Read more

Upload Your Base Map to create a shareable property plan with MAPOG georeferencing and interactive layout tools

Upload Your Base Map and Create a Shareable Property Plan Easily

Static floor plans often confuse potential buyers because they lack real-world context. Brokers and developers struggle to convey a lifestyle when using a static PDF. Therefore, you should Upload Your Base Map and Create a Shareable Property Plan Easily to bridge this gap. By leveraging the MAPOG georeferencing capability, you transform a simple layout image … Read more

Person sharing a digital map publicly or privately using online map settings

How to Share Your Map Publicly or Privately

Creating a map is just the beginning. However, the real value comes from how you share it and how users interact with it. In many cases, maps are shared without proper controls or usability features. As a result, users either struggle to explore the data or fail to get meaningful insights. So, how can you … Read more

Map showing a property listing with nearby amenities like schools, hospitals, and transport locations

Make Your Property Listings Stand Out with Nearby Points on the Map

In real estate, property listings are often shared through images, spreadsheets, or basic portals. However, these methods only show partial information. While buyers can see the property, they rarely understand the surroundings. As a result, they spend extra time searching for nearby schools, buildings , and connectivity. With MAPOG , you can turn simple property … Read more

Interactive map showing business data locations, performance insights, and team collaboration

Create Shareable Maps to Present Business Data to Teams and Clients

Managing business data across multiple store locations or sales territories often becomes challenging when teams rely on spreadsheets instead to Create Shareable Maps, emails, and scattered reports. As a result, it becomes difficult to track performance, identify trends, and communicate insights clearly to teams or clients. Moreover, static data lacks geographic context, making it harder … Read more

Collect, Verify, and Manage Field Data on a Map Without Switching Between Tool

Collect, Verify, and Manage Field Data on a Map Without Switching Between Tool

In today’s fast-paced operational environment, managing on-ground activities across multiple locations can quickly become complex and inefficient when handled through disconnected tools. With MAPOG, organizations can centralize their planning and monitoring processes on a single interactive map. By Verify and Manage Field Data in real time, businesses gain better control, improved coordination, and faster response … Read more

Plot Your Points on a Map and Add Details with Images

Plot Your Points on a Map and Add Details with Images

In today’s data-driven workflows, simply listing locations in spreadsheets is no longer enough. Teams need a visual and interactive way to understand, manage, and communicate location-based information effectively. Whether it’s for field surveys, asset tracking, or site inspections, relying on disconnected tools often leads to missing context and delayed decisions. With MAPOG, you can Plot … Read more

Plan and Monitor On-Ground Activities

Plan and Monitor On-Ground Activities Using an Interactive Map

In today’s fast-paced operational environment, plan and monitor on-ground activities across multiple locations can quickly become complex and inefficient when handled through disconnected tools. Teams often struggle with limited visibility, delayed updates, and scattered communication, which slows execution and decision-making. With MAPOG, organizations can centralize their planning and monitoring processes on a single interactive map. … Read more