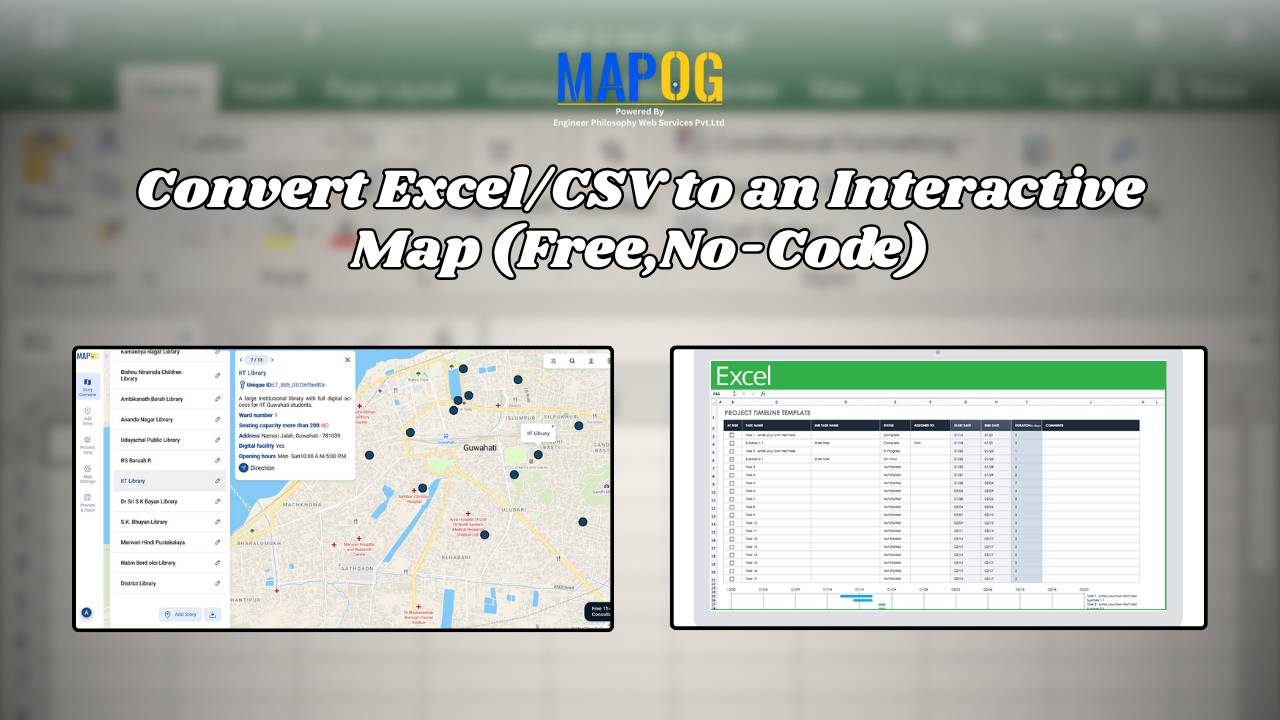
Step-by-Step Guide to Creating Interactive Forest Maps for Conservation
Analysis reveals deforestation hotspots, habitat loss trends, species impacts, and opportunities for conservation in national forests.
Start a historical trail with MAPSTORY and follow the route and importance of “Gandhi’s Dandi Aviyan: A Path to Freedom with MAPSTORY” a critical event in the fight for India’s independence. Use MAPOG’s immersive mapping technology to explore the route and the significance of this historical march. Key Concepts This is a way to digitally … Read more
Interactive maps are powerful tools for visualizing data in a way that’s easy to understand and engaging. Style Maps by Categories or Quantities in MAPOG allows you to highlight trends, differences, and relationships effectively. Whether you’re mapping demographic data, business insights, or geographical patterns, the ability to customize styles is crucial for making your data … Read more
Geographic Information System is an emerging field that combines spatial analysis, statistical modeling and data visualization. We can create maps by pinpointing the location of disease outbreak by using a “point to polygon tool” and help us lineate the affected area smoothly and effortlessly. Key concept Analysis of disease affected areas by using point to … Read more
Retail store coverage analysis – use convex hull – put category styling – Add legend for better interpretation
Find out how MAPOG’s convex hull tool can be used to map the transmission of infectious diseases. Gain the ability to map out and evaluate influence regions, which will enable communities to contain outbreaks more successfully. Key Concepts Analysis of Contagious Diseases Convex Hull is used to identify their spheres of effect in order to … Read more
In the fast-paced world of urban logistics, the ability to understand and optimize travel times is essential for businesses like food and grocery delivery services. One powerful tool in their arsenal is isochrone analysis. Isochrone Analysis: Mapping Travel Times, Let’s explore what isochrones are, how they work, and the significant impact they have on streamlining … Read more
Have a spreadsheet full of addresses or coordinates and wondering how to plot them on a map? Geocoding Excel data into an interactive map can transform raw location information into valuable insights. Whether for business analysis, logistics, or research, mapping your Excel data helps visualize trends and make data-driven decisions. This guide will walk you … Read more
In the vast landscape of Geographic Information Systems (GIS), the meticulous process of mapping settlement features stands as a cornerstone of urban planning, environmental assessment, and resource management. Settlement features, ranging from individual households to sprawling cityscapes, serve as critical focal points in understanding human habitation patterns and societal dynamics. With the help of MAPOG … Read more
Healthcare is an industry in which the basis for many decisions could be driven by data. For instance, healthcare services can be effectively analyzed with spatial insight into resource allocation and disease distribution, which, in turn, determines the accessibility of care. Therefore, this article presents some of the best GIS tools available for healthcare professionals … Read more