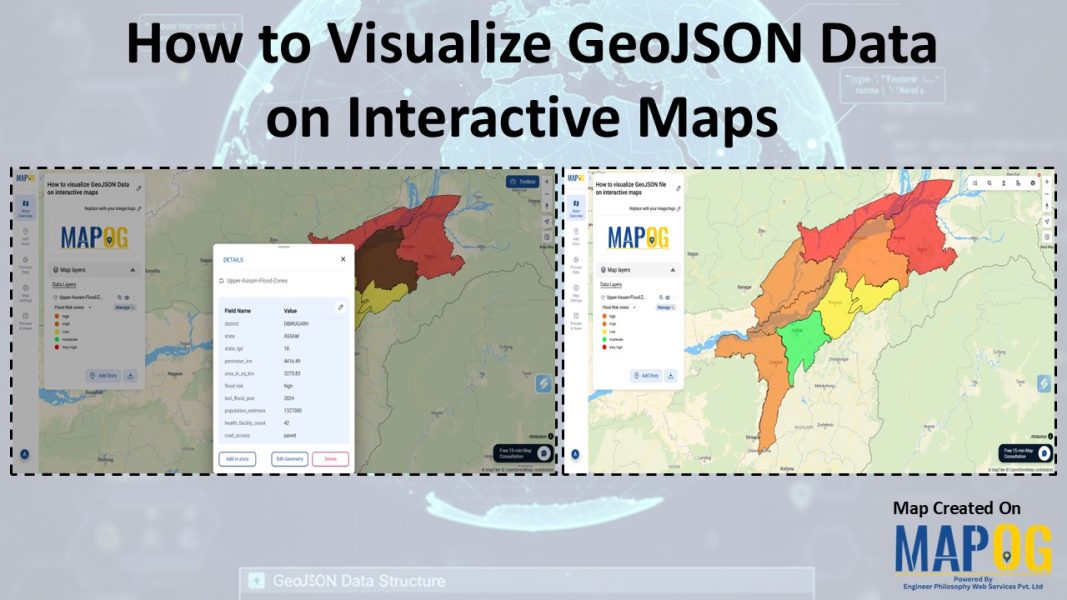
SpatialAnalysis

How to Create Interactive Maps Without Any Technical Skills

How to Create and Embed Live Maps on Your Website in Minutes

In today’s data-driven world, learning how to create and embed live maps into your blog or Website can instantly boost engagement and clarity. Whether you’re showcasing public services, identifying urban gaps, or promoting inclusivity, interactive maps transform static content into immersive, insightful experiences no GIS skills required. With MAPOG, a no-code mapping tool, anyone can … Read more

Create interactive maps using MAPOG without technical skills

Create Interactive Maps Without Any Technical Skills – A Visual Guide

Creating interactive maps no longer requires technical skills or expertise in geographic information systems. Today, even individuals without a background in GIS can visualise and analyse spatial data to better understand real-world issues. Whether you’re a teacher, student, or policy planner, interactive maps can powerfully communicate patterns, challenges, and opportunities in education, healthcare, infrastructure, and … Read more

Top places to Visit Across India – Visual Travel Guide on Map

India is more than a destination it’s a vibrant journey through culture, nature, and heritage. With the MAPOG code-free mapping platform, you can effortlessly transform your travel plans or blog into an interactive visual experience, highlighting top places to visit across India. From sacred sites to scenic wonders, bring India’s diversity to life all in … Read more

Mapping Borewell Locations Near Rivers and Lakes with GIS-Based Tools

Mapping borewell locations near rivers and lakes is not only vital for understanding groundwater dependencies but also essential for ensuring sustainable usage. In fact, in regions where surface water and groundwater interact closely, analyzing borewell proximity to these natural water bodies becomes even more crucial. Moreover, with the help of GIS-based tools like MAPOG, users … Read more

Interactive Population Maps

Interactive Population Map with Heat Bubble and Category Styling

Analysing and interpreting population data across various geographic regions can be done visually with Interactive Population Maps with Heat Bubble and Category Styling. It is simple to quickly identify high and low concentration areas on these maps because they use heat bubbles, which vary in size and colour, to represent population density or totals. Furthermore, … Read more

GIS in Identifying High-Growth Areas for Real Estate Investment

GIS in Identifying High-Growth Areas for Real Estate Investment

In today’s fast-evolving urban landscape, identifying the right location for real estate investment is both a science and a strategy. GIS helps in Identifying High-Growth Areas is a go-to approach for investors and planners aiming to make informed, data-backed decisions. From analyzing transportation access to mapping nearby amenities, GIS adds a new level of depth … Read more

How to create Major Historical Battles and War Sites Map

History isn’t just about events it’s about where they happened. From ancient conquests to world wars, every major battle unfolded on a map. In this guide, we’ll walk through how to build a stunning “Historical Battles and War Sites” story map using MAPOG. you can transform history into an interactive journey by creating a “Major … Read more

Mapping Crime Hotspots

Mapping Crime Hotspots Using Grids and Heat Bubble Tools

Mapping crime hotspots is a critical approach in understanding and preventing urban crime. By visualizing clusters of criminal activity, law enforcement and urban planners can make informed, data-driven decisions. One modern way to do this effectively is through interactive mapping platforms that offer grid-based analysis and visual heat bubble styles—such as MAPOG’s intuitive tools. This … Read more

Population Density Map by Districts

How To Create Population Density Map by Districts

Visualizing population density map by districts helps uncover patterns in urban growth, resource distribution, and planning needs. Whether you’re working on development plans, healthcare access, or disaster preparedness, mapping this data by district brings clarity that raw tables cannot. Thanks to MAPOG, users can create, style, and share interactive maps easily—no advanced GIS degree needed. … Read more

mapping sewage and drainage systems

Mapping Sewage and Drainage Systems Using Cross Intersection Tool

Nowadays, mapping sewage and drainage systems has become a smarter and more data-driven approach to urban planning and environmental safety. In particular, mapping such infrastructures helps identify pollution risks, optimise maintenance, and prevent disasters. One powerful way to achieve this is through the use of spatial tools like buffer zones and cross-intersection methods. By doing … Read more