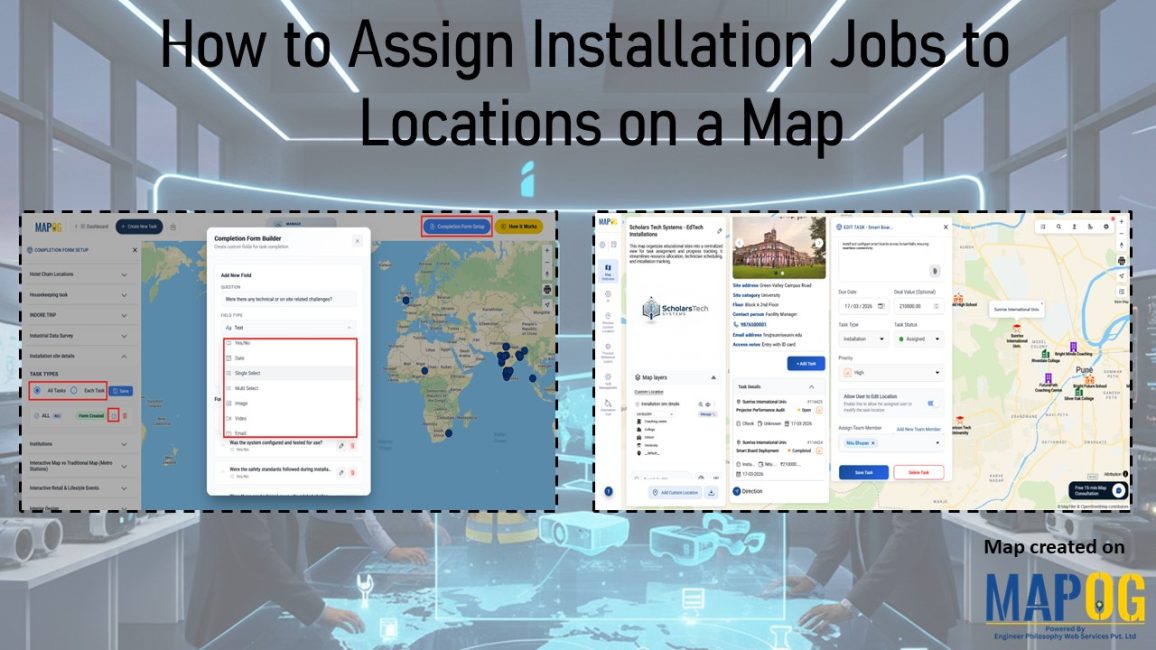
How to Assign Installation Jobs to Locations on a Map
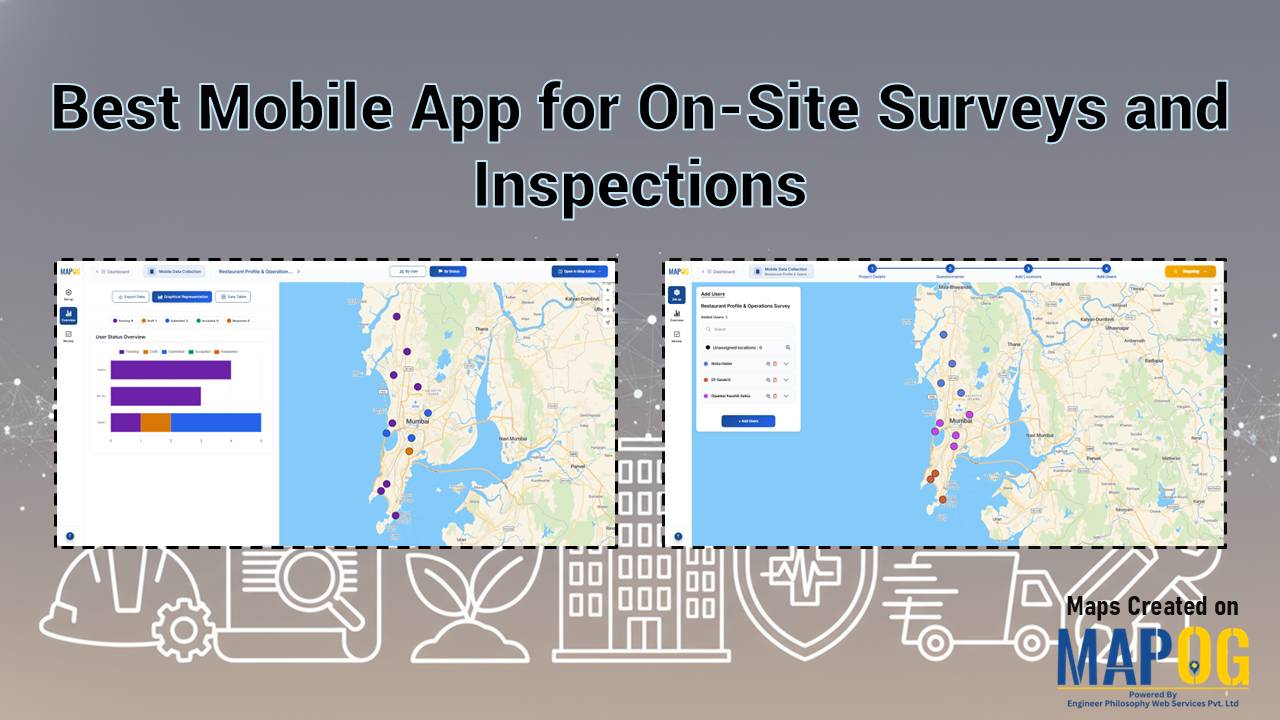
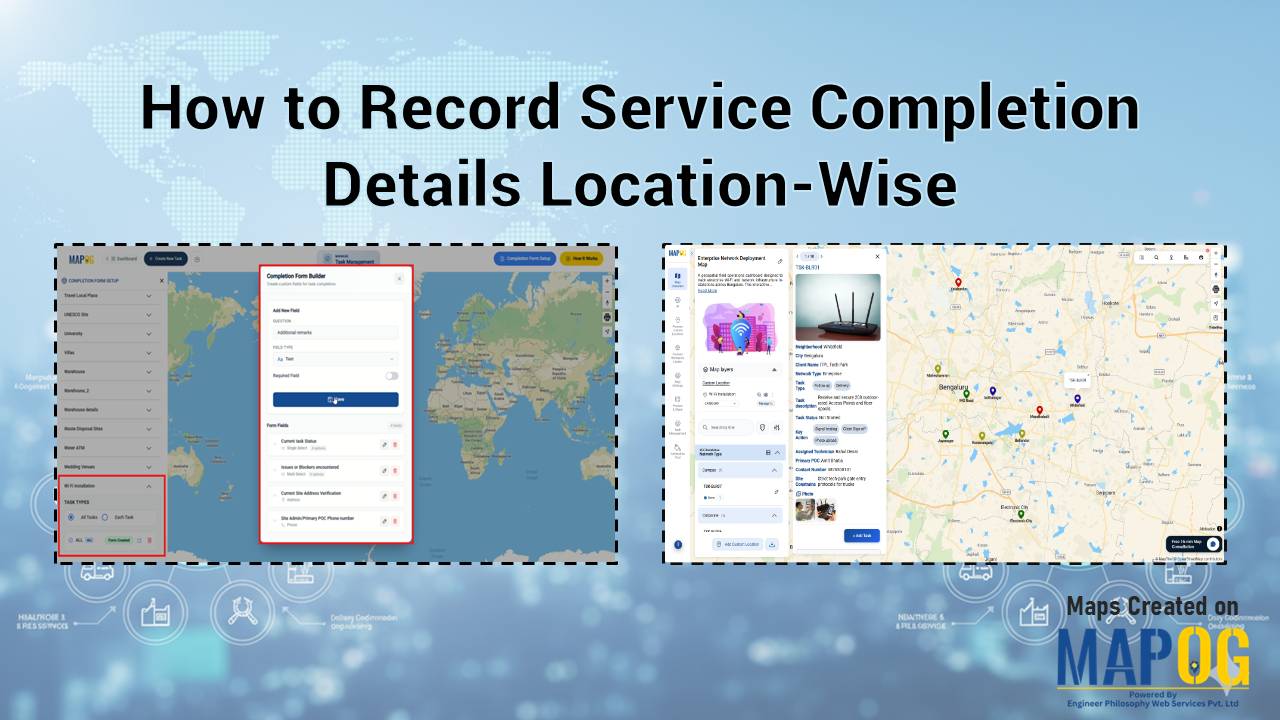
Managing Ed-tech hardware installations across multiple sites is challenging. Field teams face communication gaps, travel delays, and unclear tracking, leaving managers unsure about progress or payments. MAPOG solves scheduling by letting managers assign installation jobs to locations, track status, and verify tasks with completion forms, all seamlessly. Key Concept: Why Assign Installation Jobs to Locations When … Read more