The real estate industry faces challenges in presenting property listings clearly, leading to slow and inefficient decision-making. An Interactive Web Map offers a solution by visually displaying properties, allowing buyers to easily explore locations and distances. MAPOG enables users to create customizable maps with specific property attributes and styling, enhancing the user experience and making property exploration more engaging and organized.
Key Concept of an Interactive Web Map for Real Estate
An Interactive Web Map is a digital platform enabling users to explore real estate properties interactively through spatial data representation. Users can access details like price and amenities by clicking on mapped properties, thus moving beyond traditional spreadsheets. This tool serves as both a marketing resource and a decision-making aid for property consultants and buyers by allowing location-based filtering of listings.
Step-by-Step Process to Create an Interactive Web Map
Step 1: Create a New Interactive Web Map Project
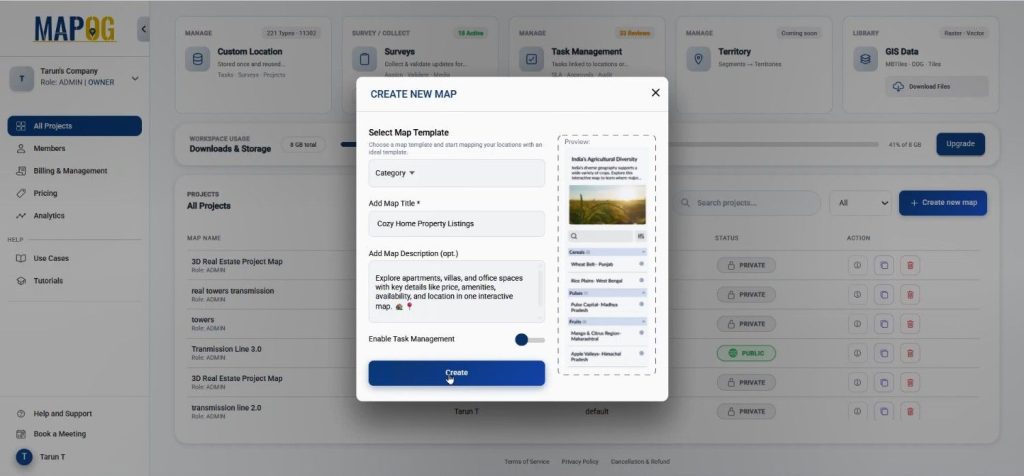
To begin, open the MAPOG platform and create a new map project. After selecting Create New Map, choose the Category template, provide a name, and add a short description for the project.
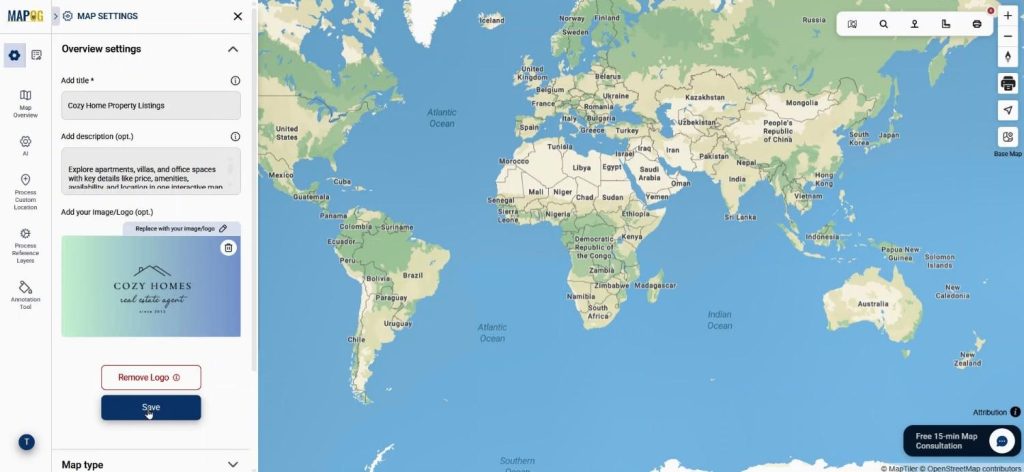
Then the map interface opens, where customization can begin. Because branding plays a role in real estate marketing, use replace logo option to add a custom brand log. This ensures that the Interactive Web Map aligns with the company’s visual identity.
Step 2: Configure Property Templates for the Interactive Web Map
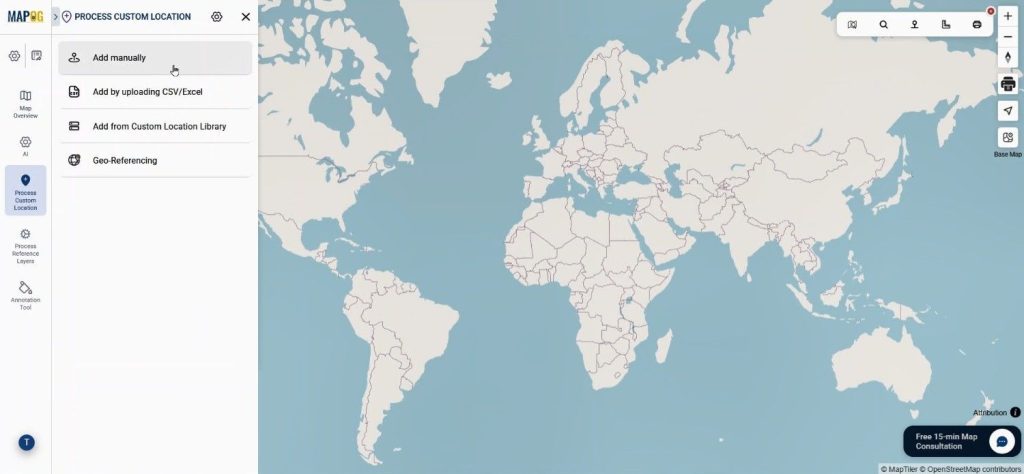
Next, property data needs a structure. Go to process custom location & select Add manually.
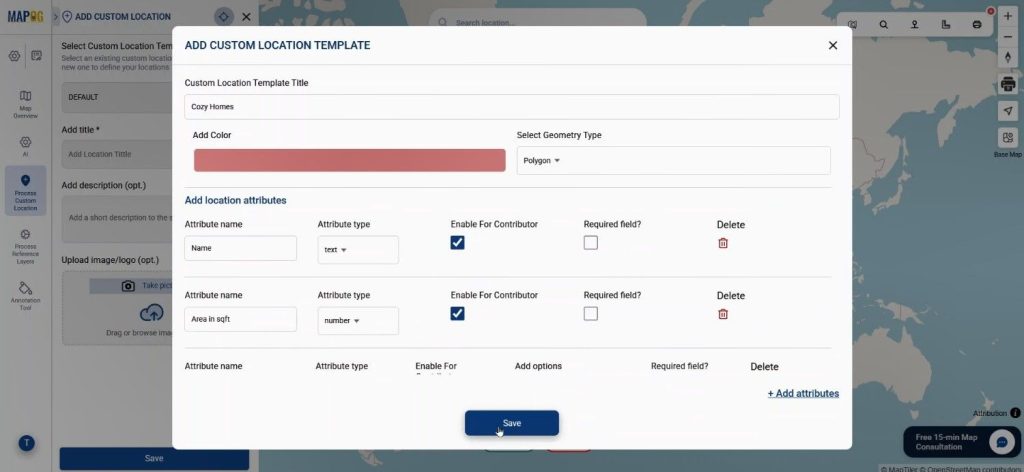
Inside Custom Location Template Settings, create new template to store reusable property attributes. Here, provide name, color & set the geometry as polygon, since buildings occupy physical areas. Add Attributes such as area in square feet, amenities, availability, images, and furnishing status. Furthermore, enable contributor access. Consequently, agents or team members can update property information directly within the Interactive Web Map without rebuilding the map. Lastly save the template.
Step 3: Add Properties Using Add Manually in the Map
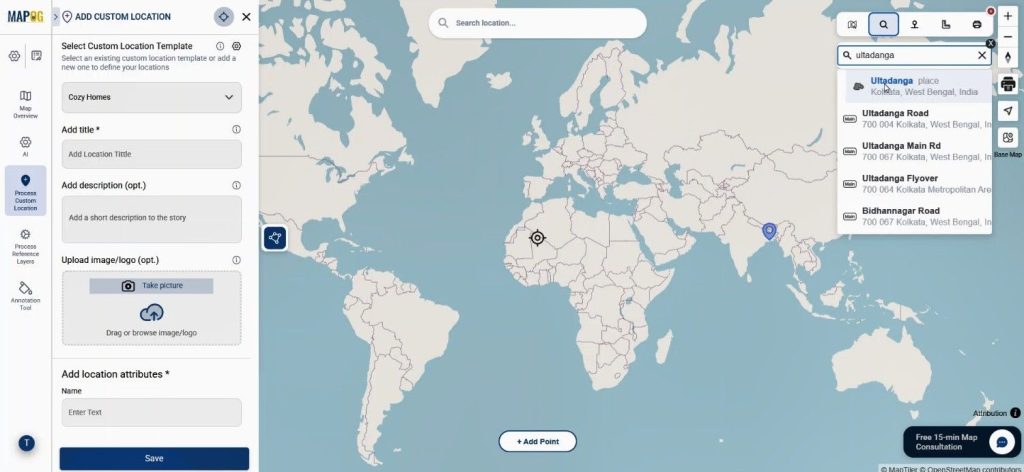
After preparing the templates, add properties . First, Select the created template from drop down & search for the property area using the Search by Place feature.
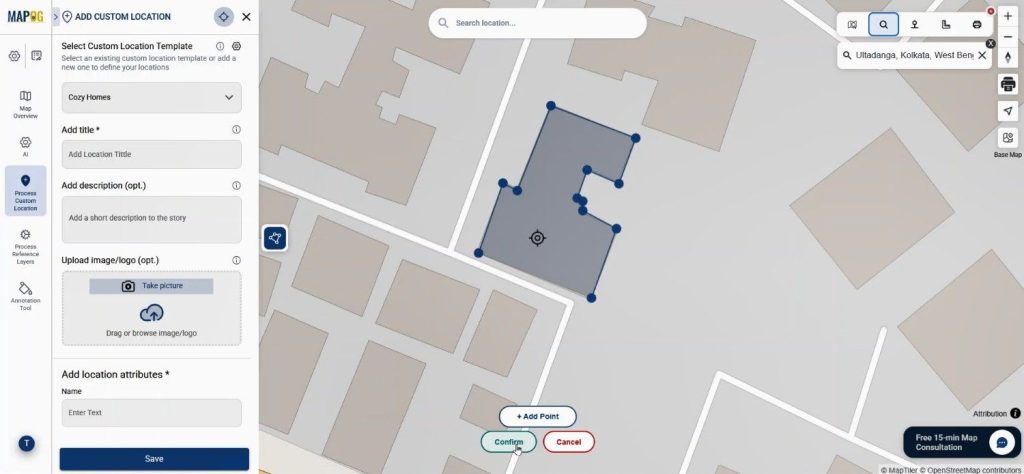
Then use the Draw Polygon tool to mark the building boundary by placing points on the map. Once done conform it to save.
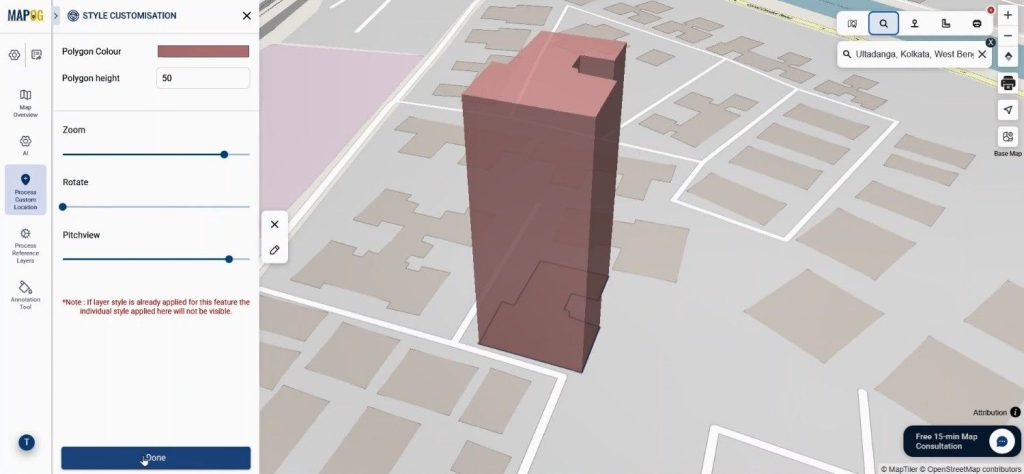
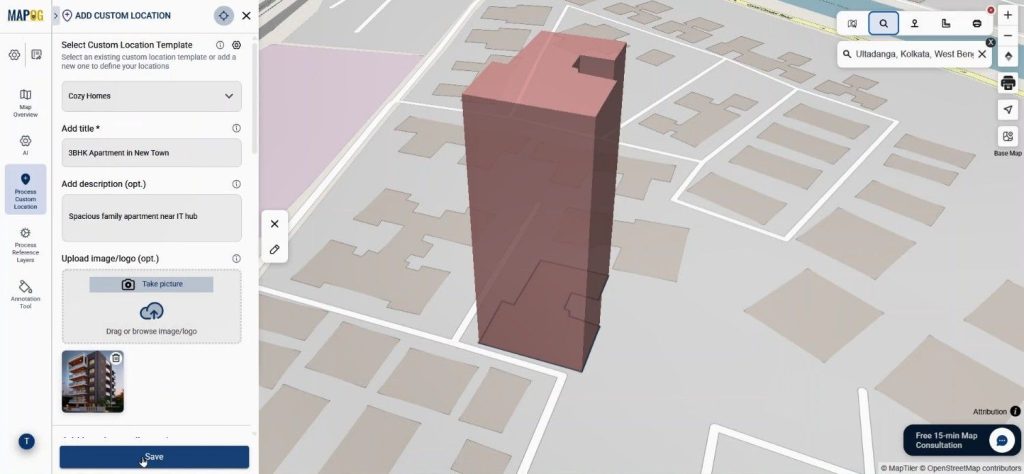
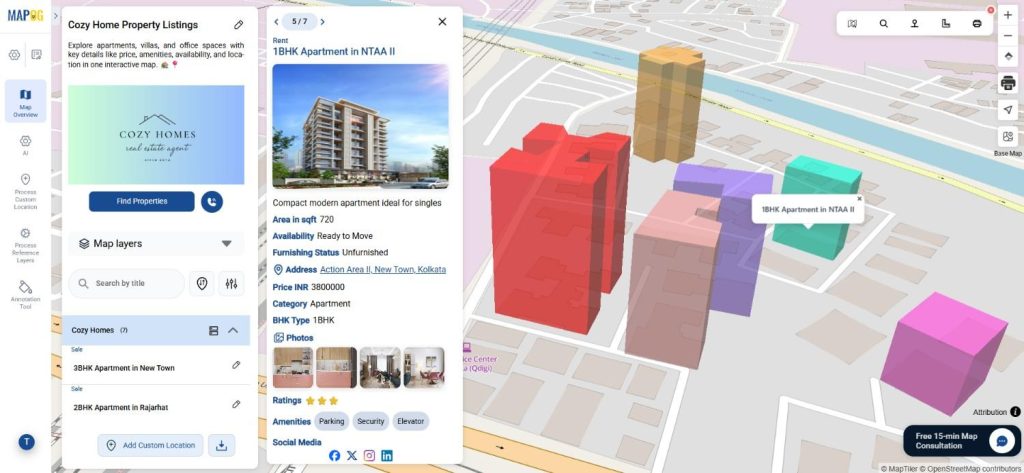
Use edit polygon to adjust the polygon color, building height, rotation, and pitch. As a result, the Interactive Web Map can even present a 3D-like building visualization, which improves map readability and engagement.
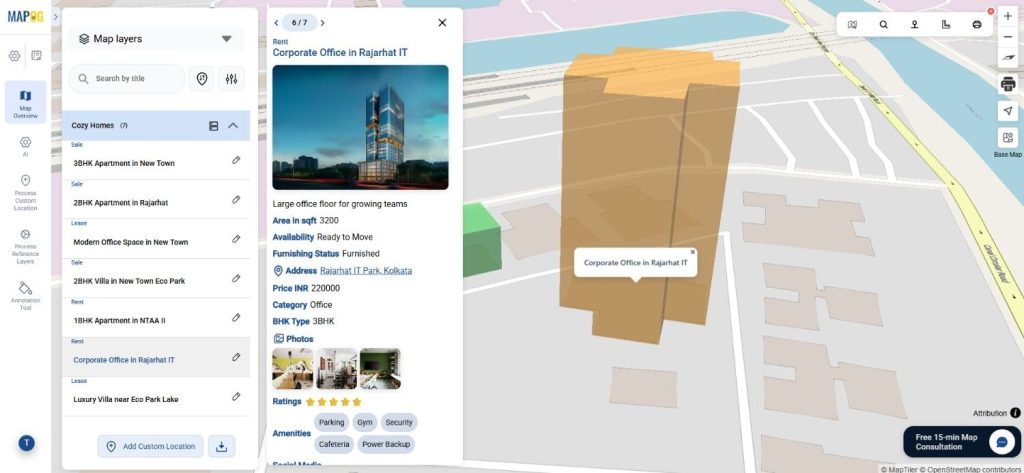
Now enter property details such as title, room images, price, area, amenities, and availability. Save the location. Use the same method to add all other properties on map.
Step 4: Organize Listings in the Map
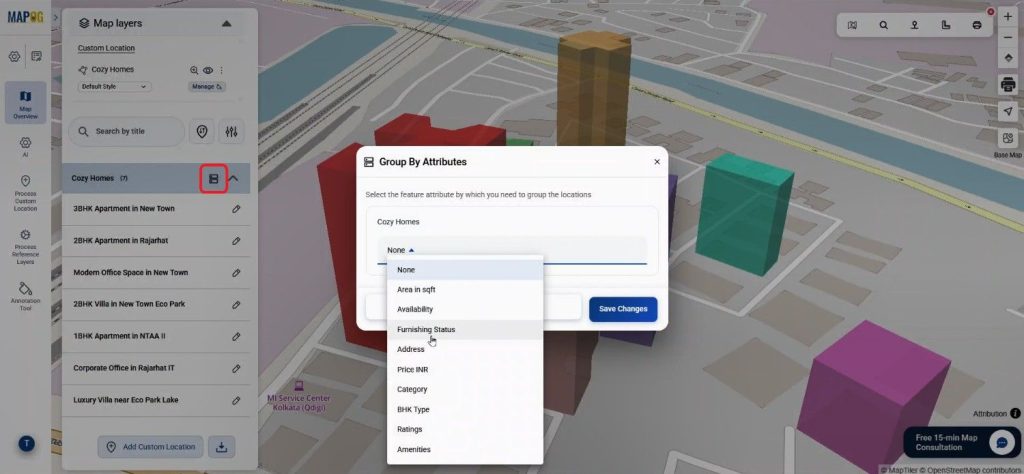
Once multiple properties are added, organizing them becomes important. Features such as Group by Attributes allow listings to be categorized based on property types or furnishing status.
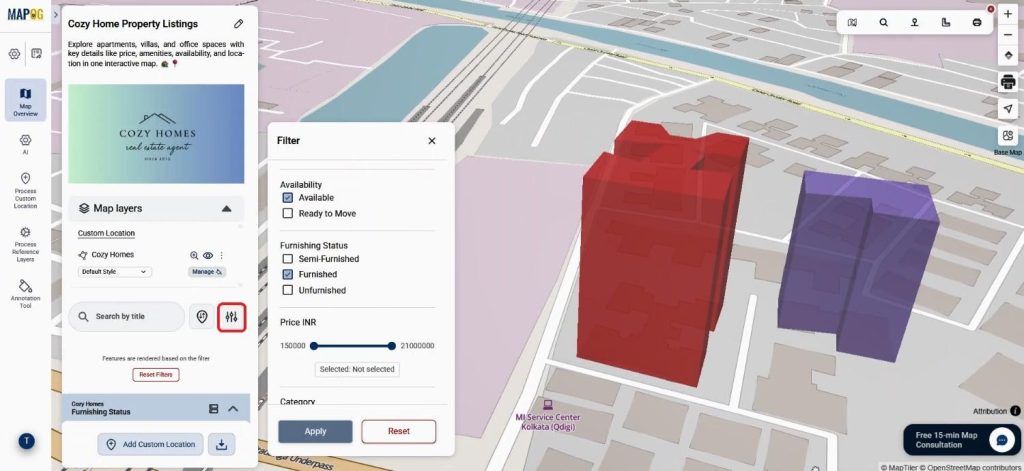
Moreover, filters allow users to display only certain listings, such as available rentals or luxury villas.
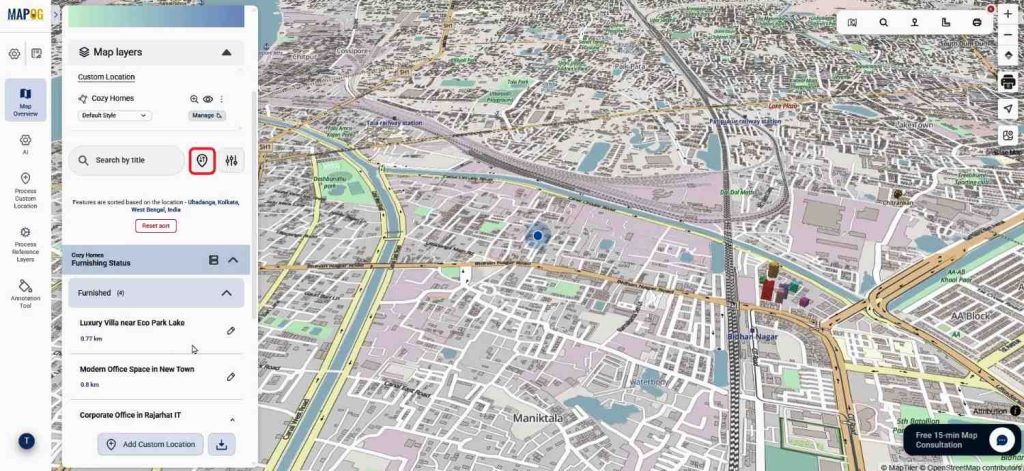
Meanwhile, the Sort by Distance feature helps buyers measure proximity to a searched location or even their live location.
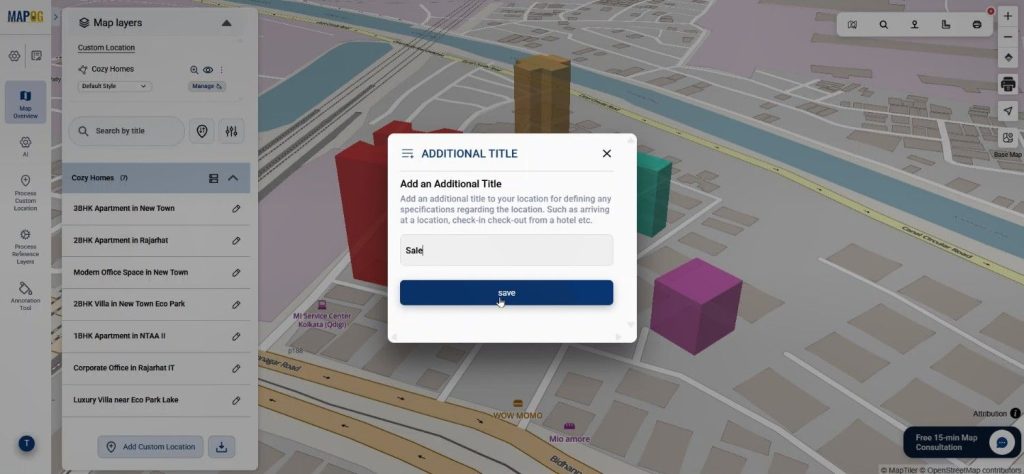
Additionally, display property lease types such as rent, lease, or sale through additional title settings. Therefore, the Interactive Web Map becomes easier for clients to explore and compare.
Step 5: Enable Client Interaction and Map Sharing
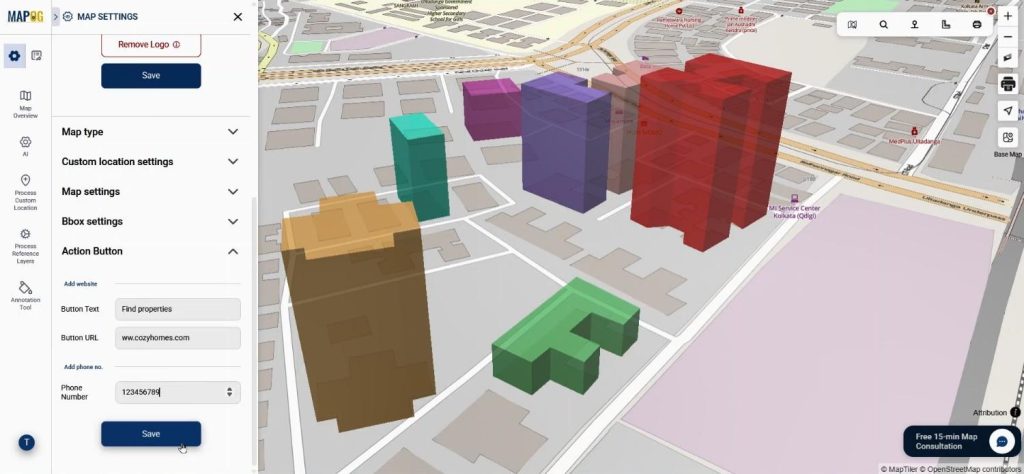
Inside Map Settings, add Action Button with text, website links, or contact options. Because of this feature, clients can directly contact agents or visit property pages from the map itself.
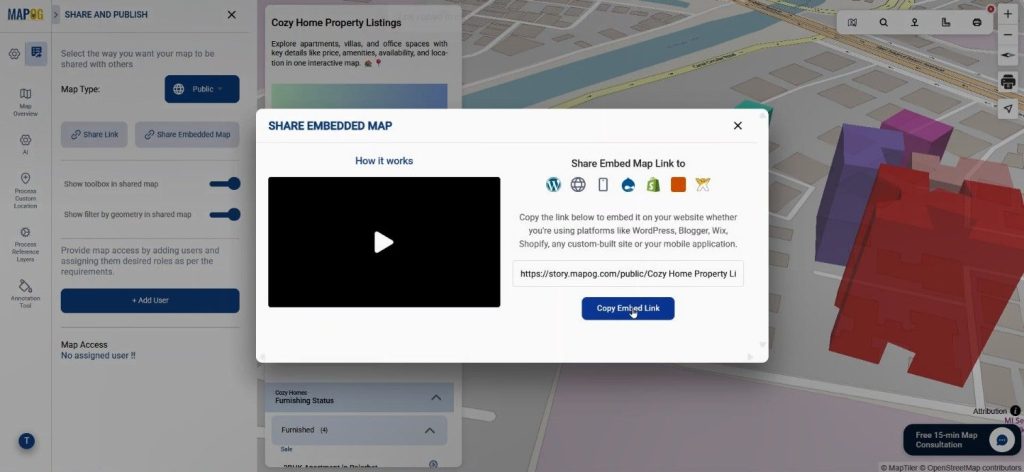
Afterward, Go to Preview and Share. Make The Interactive Web Map public or private. Embedded into websites or shared through links.
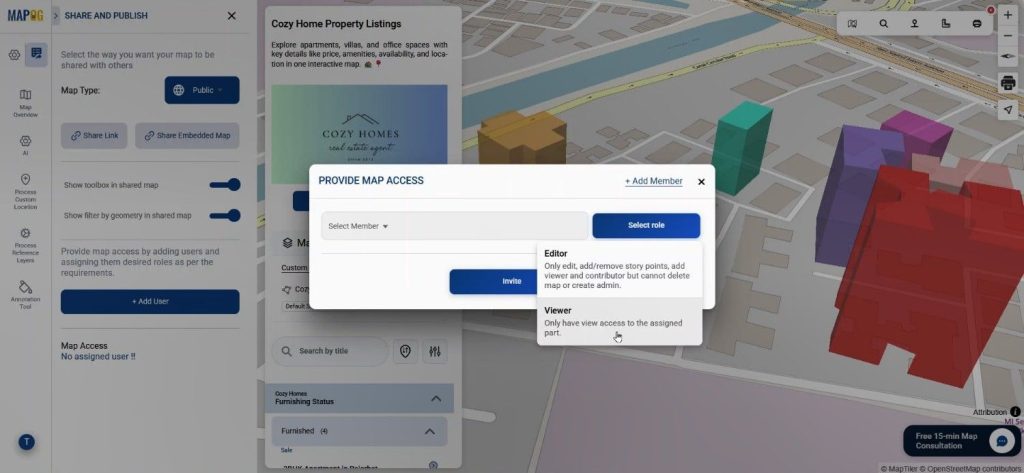
Additionally, using add user team members or clients can be added as collaborators for map updates.
Industry Benefits of an Interactive Web Map
The real estate sector increasingly relies on digital visualization. Therefore, an Web Map provides several benefits.
First, buyers understand property locations faster because listings are mapped visually. Secondly, agents can present multiple listings in one organized interface. Moreover, developers can highlight property clusters within a neighborhood or project area.
For instance, a real estate agency could map ten nearby listings — three apartments, four office spaces, and three villas — allowing clients to compare them instantly. Consequently, property searches become faster, clearer, and more engaging.
Conclusion
The way of presenting real estate listings is evolving. Static property lists no longer provide the spatial clarity that buyers expect. However, by building an Interactive Web Map, real estate professionals can present listings visually, organize data efficiently, and improve client engagement.
MAPOG simplify this process with features such as Add Manually, reusable templates, and powerful style customization options. As a result, property listings become easier to manage and far more interactive for potential buyers.
So, if you want to transform the way property listings are explored, creating an Interactive Web Map can be a practical and effective solution.