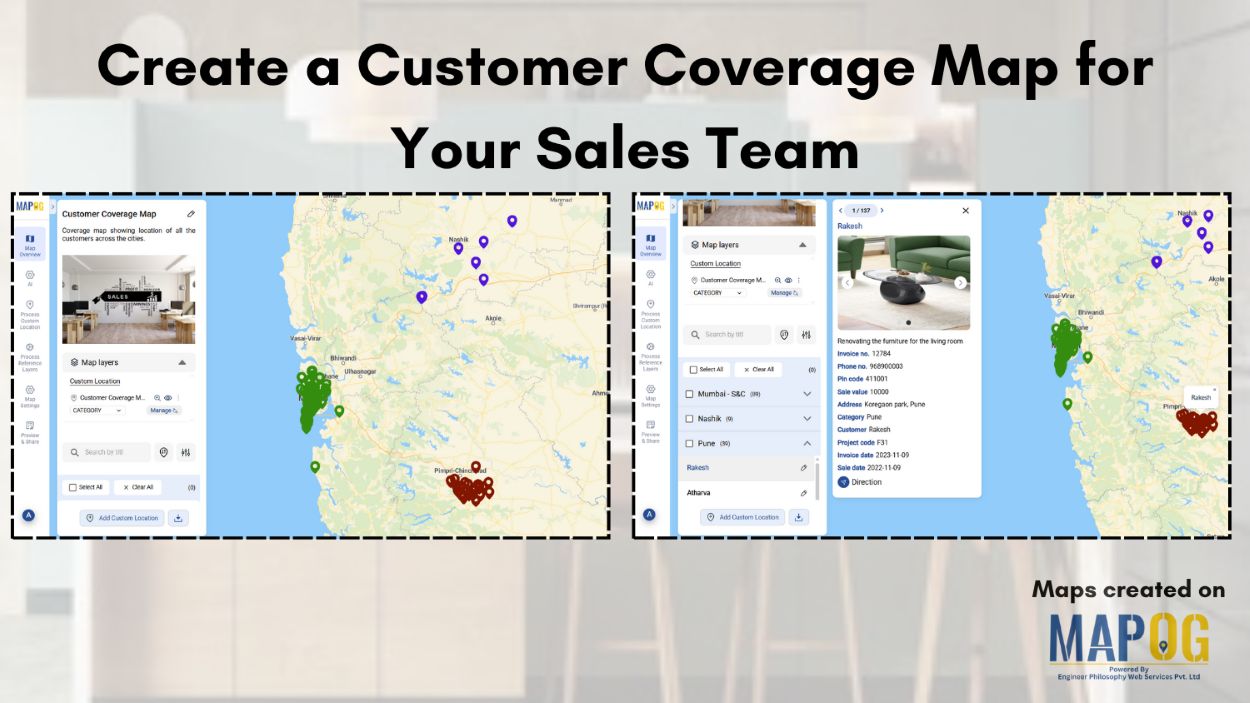
Heat Map

Create a Buffer Analysis to Locate Hospital Within 5km radius of Village

Finding healthcare gaps isn’t just about counting hospitals. Rather, it’s about understanding access, travel range, and unserved rural zones. Therefore, with the help of MAPOG, planners and health departments can visualize these relationships using buffer analysis. Additionally when used in combination with choropleth-style overlays, village point layers, or service area mapping tools, MAPOG makes it … Read more

Solar Site Suitability Mapping for Utility-Scale Projects

How to Use GIS Mapping for Solar Development: A Step-by-Step Guide to Smart Site Selection

Planning utility-scale Solar Site Suitability Mapping projects with MAPOG involves overlaying layers like GHI, land parcels, flood zones, and transmission lines. Spatial filters quickly eliminate unsuitable areas, helping prioritize sites that are both high in solar potential and accessible to the grid streamlining smart, data-driven solar development. Key Concept: Solar Site Suitability Mapping While many … Read more

Mapping Crime Hotspots

Mapping Crime Hotspots Using Grids and Heat Bubble Tools

Mapping crime hotspots is a critical approach in understanding and preventing urban crime. By visualizing clusters of criminal activity, law enforcement and urban planners can make informed, data-driven decisions. One modern way to do this effectively is through interactive mapping platforms that offer grid-based analysis and visual heat bubble styles—such as MAPOG’s intuitive tools. This … Read more

Mapping Noise Pollution Levels in Cities Using Heat Maps and Buffer Tools

Mapping Noise Pollution Levels: Using Heat Maps and Buffer Tools

Noise pollution is an increasingly critical yet often overlooked environmental challenge. In urban areas, it stems primarily from traffic, construction, railways, and industrial activities. Fortunately, with the rise of Geographic Information Systems (GIS) especially tools like heat maps and buffer zones for Mapping Noise Pollution Levels. We can now visualize these invisible pollutants. As a … Read more

What Are Heatmaps and How to Create Heatmaps?

What Are Heatmaps and How to Create Heatmaps?

Ever wondered how to visualize data patterns effectively? Heatmaps are an excellent way to analyze trends, highlight intensities, and make data-driven decisions. Whether for website analytics, business insights, or geographic trends, heatmaps simplify complex datasets into easy-to-understand visuals. The best part? You can create heatmaps for free using tools like MAPOG’s Heat Map Style. Let’s … Read more

The Role of GIS in Cyber Security and Geospatial Intelligence

The Role of GIS in Cyber Security and Geospatial Intelligence 

In today’s data-driven world, maps are no longer just tools for navigation, they are powerful instruments for analysing patterns, making informed decisions, and solving complex problems. Whether Tracking Population and Literacy Data Attribute , Thematic Mapping for Data Analysis or a researcher visualising data, MAPOG is your go-to platform for creating professional, insightful maps. In … Read more

District-Wise Disability Population Analysis Using Heat Maps Easy Insights & Mapping

District-Wise Disability Population Analysis Using Heat Maps | Easy Insights & Mapping

Dive into the world of Disability Population Heat Map Analysis, where advanced mapping techniques provide district-wise insights with ease. By leveraging heat maps, we simplify complex data interpretation, offering a clear visual representation of disability distribution. This approach empowers policymakers, urban planners, and organizations to make informed decisions for improved accessibility and resource allocation. Explore … Read more

How to Create Heat Maps for Forest Cover Analysis Using GIS

Forest Cover Maps a fundamental tool within GIS, serves as a potent visualization method. It utilizes colors to represent the density or intensity of data across a geographic area, offering valuable insights into various phenomena. Key Concept to Creating Forest Cover Maps: Using Heat Map Style Heat maps are super helpful when we want to … Read more