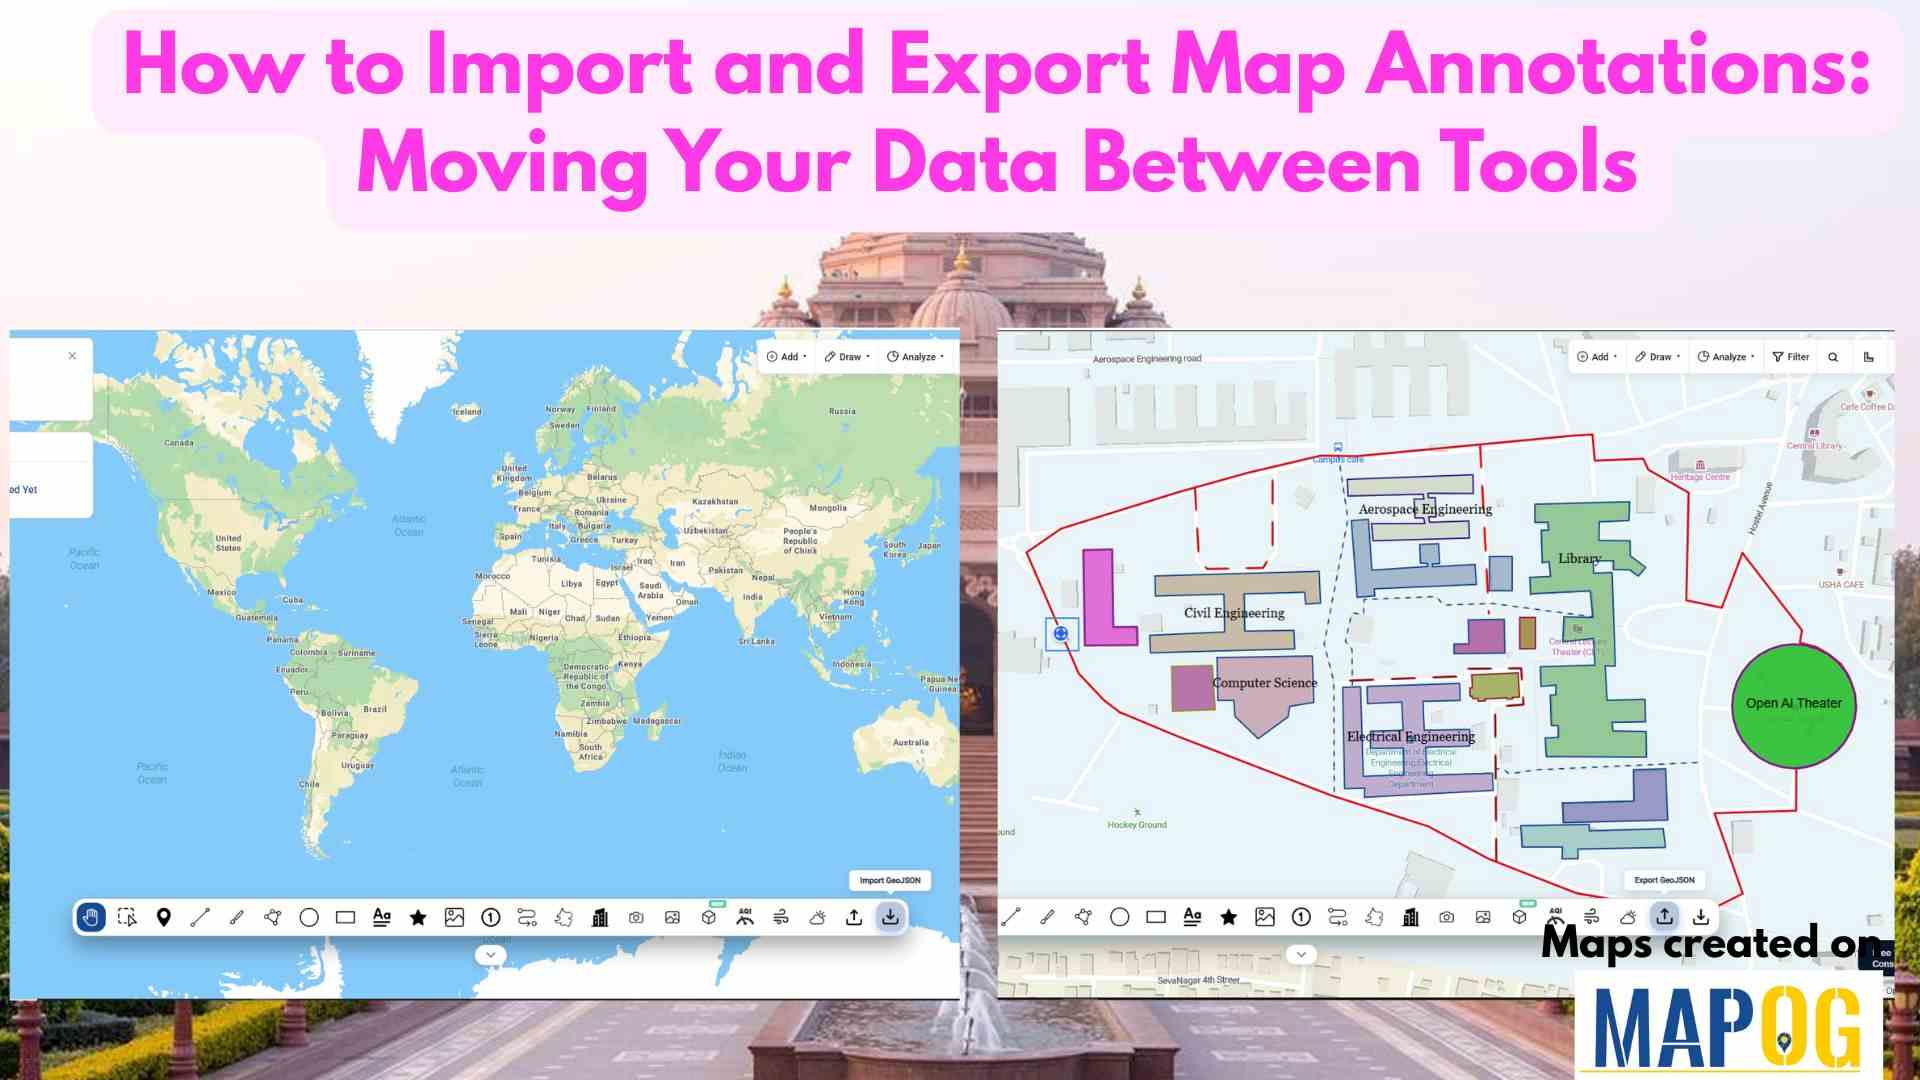
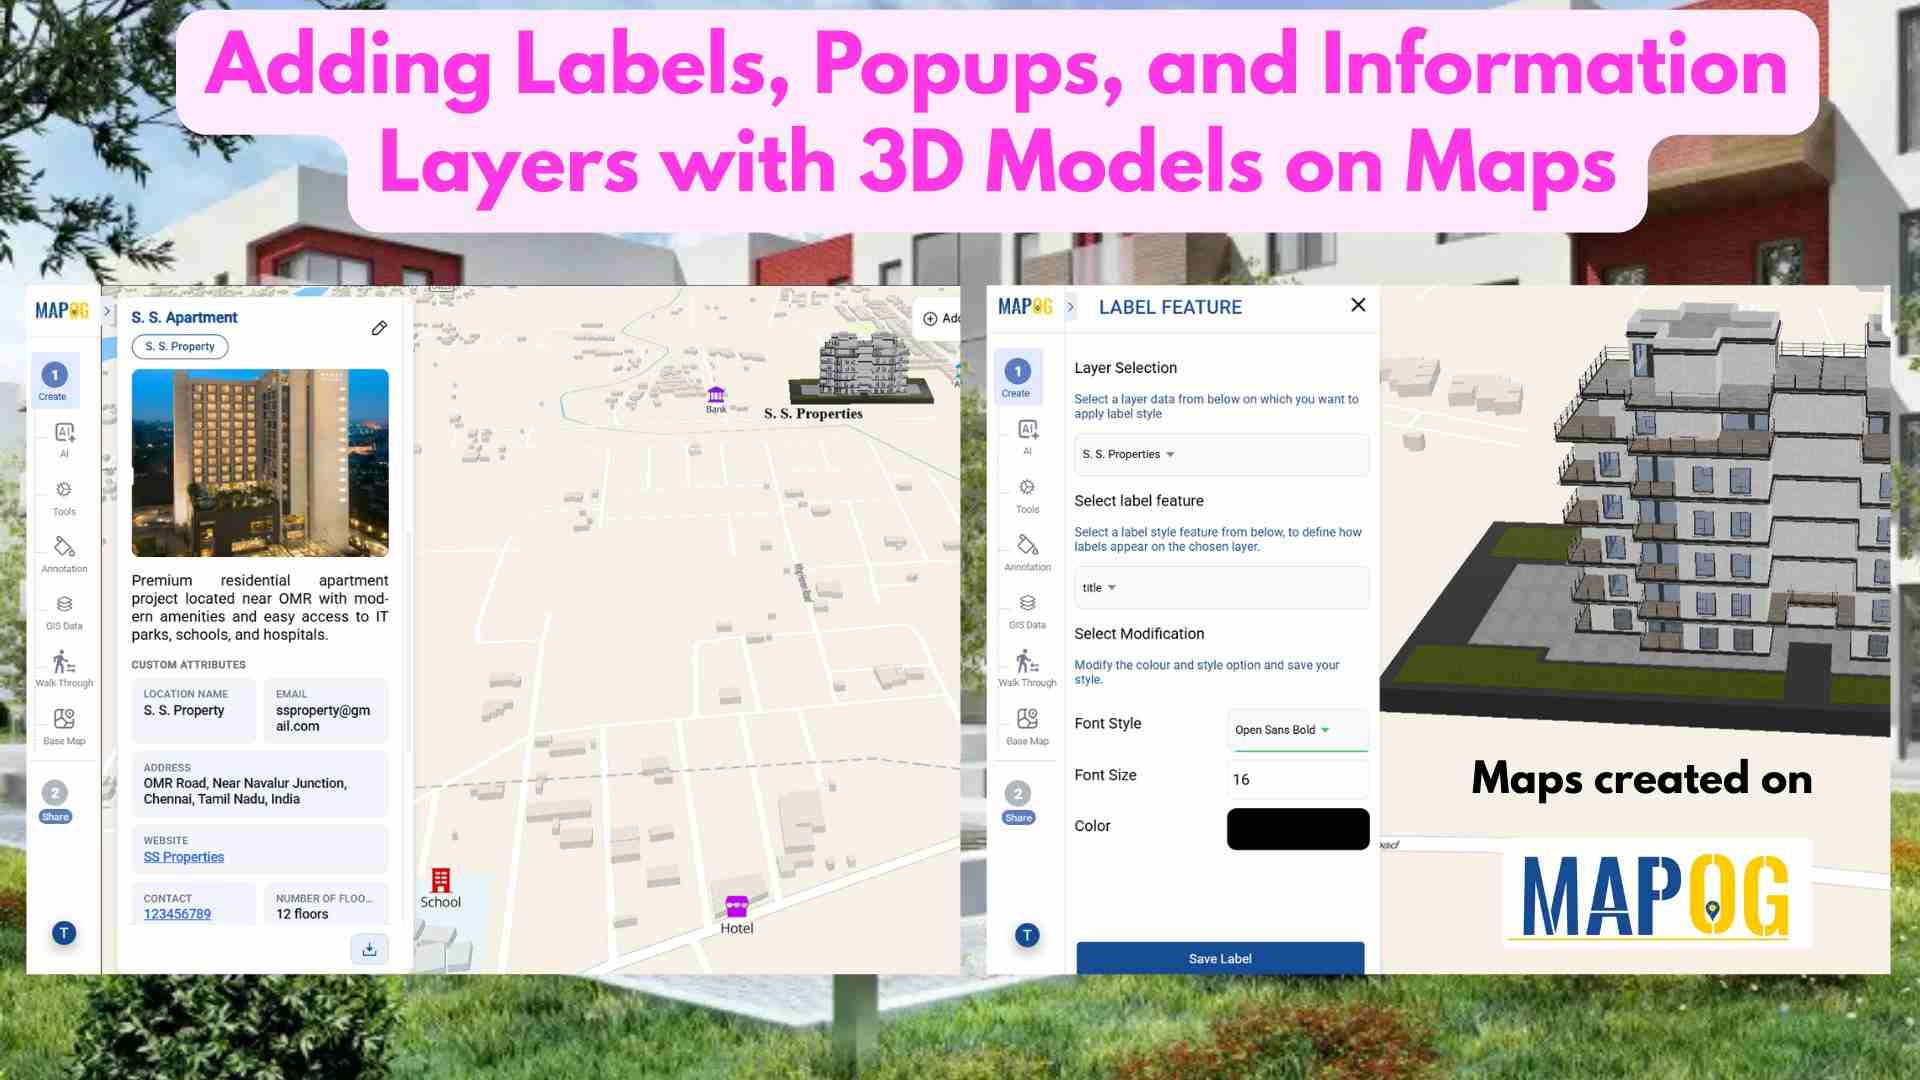
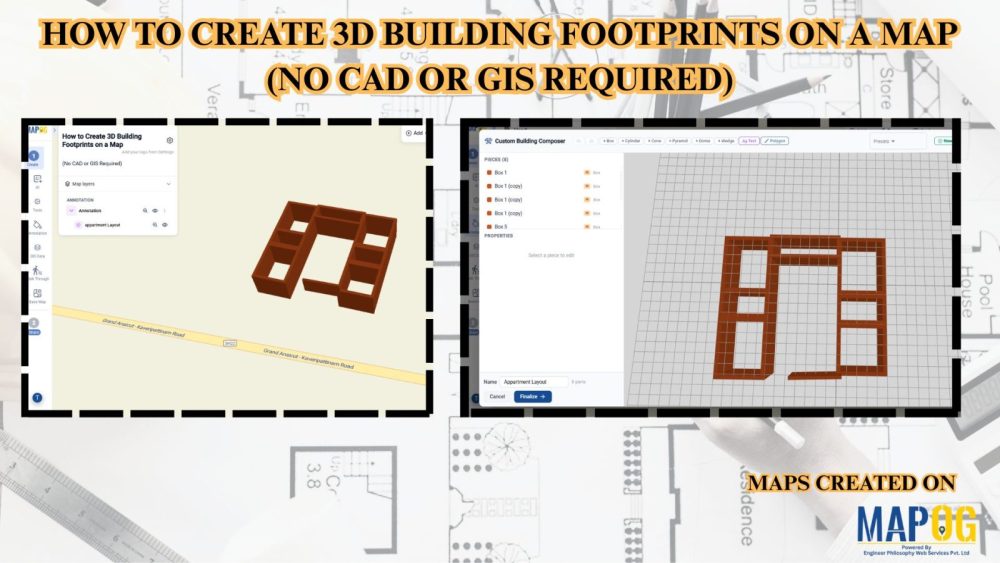
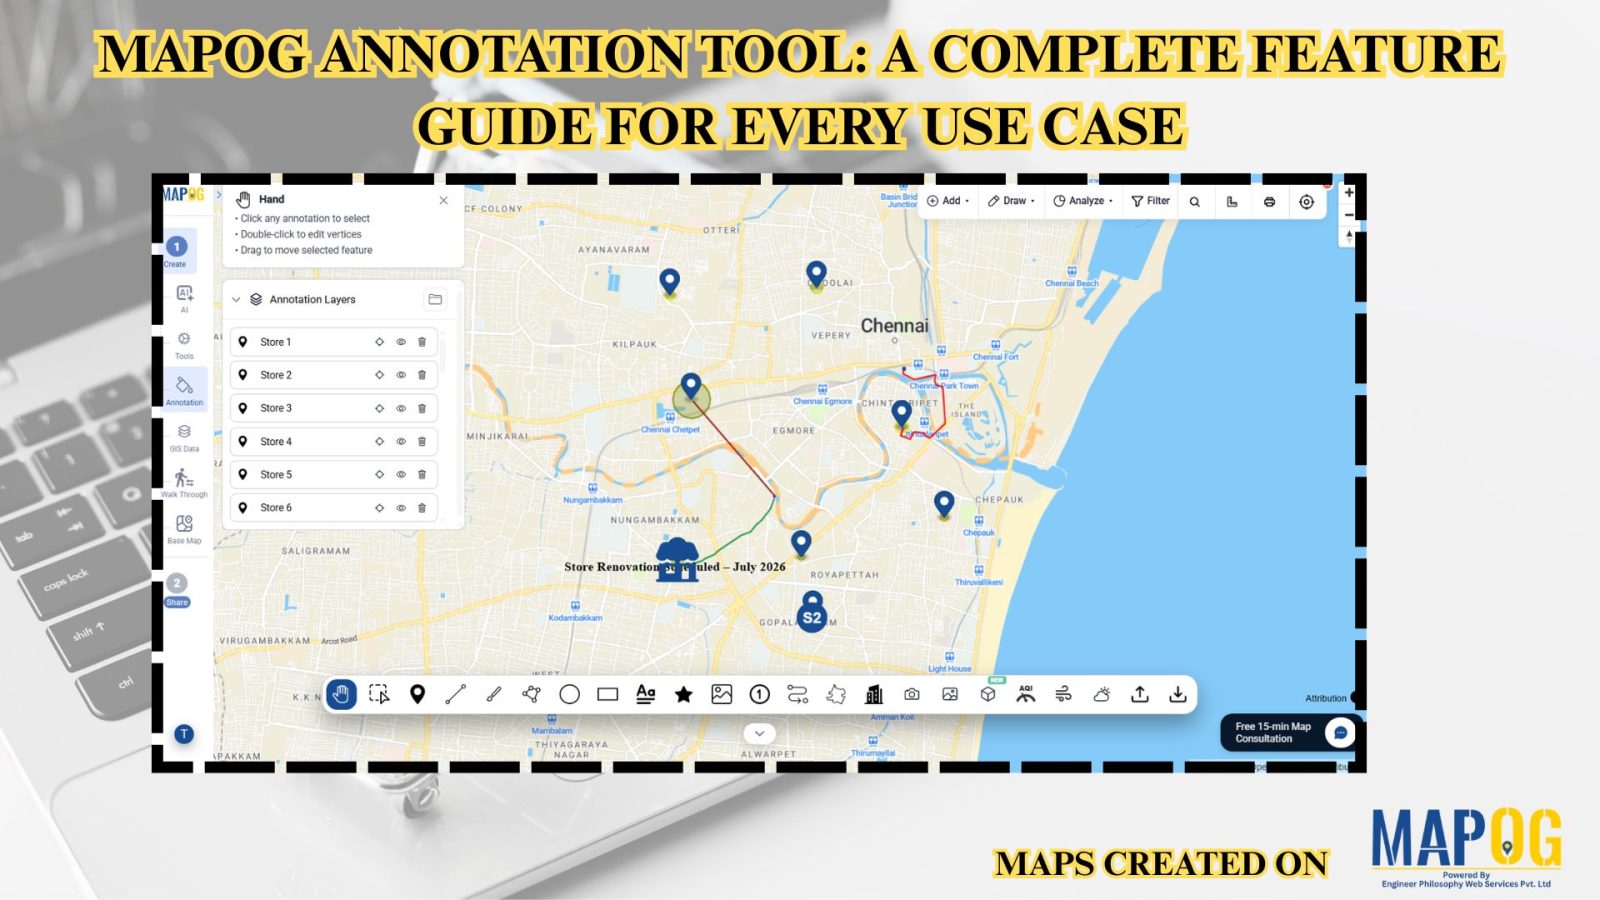
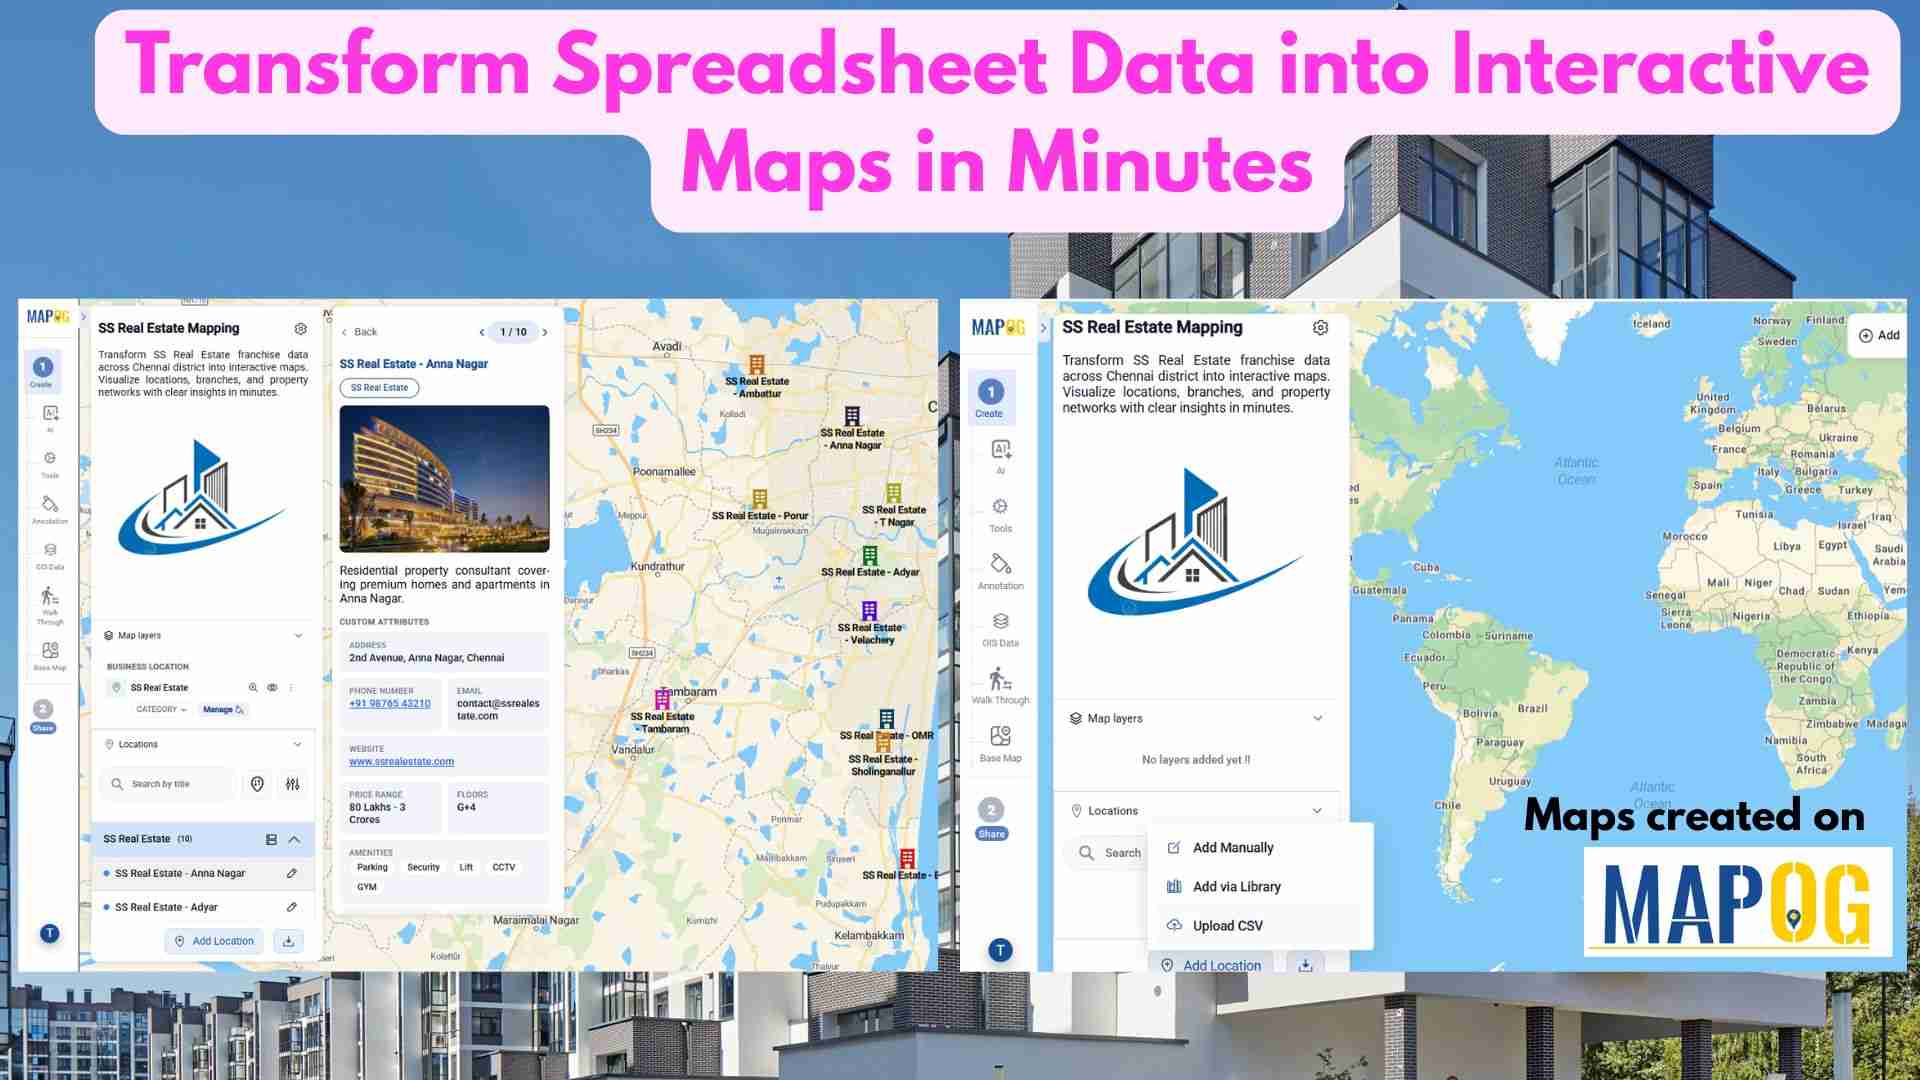
GISdata

Dashboard view demonstrating how to Filter Only the Locations That Need Action within a 5 km radius on a map using proximity and status-based filters.

How to Filter Only the Locations That Need Action Within a 5 km Radius

Managing multiple locations efficiently becomes challenging when you need to identify which sites require immediate attention. MAPOG‘s dynamic filtering system helps businesses streamline operations by pinpointing critical locations within specific geographic boundaries. Learning how to filter only the locations that need action within a 5 km radius transforms scattered data into actionable insights. Key Concept: … Read more

visualize the franchise covergae for a bakery outlet

Visualize Franchise Coverage Using Interactive Maps

Running a franchise business is no longer just about opening outlets in multiple cities. Instead, it is about understanding where your outlets are located, how they perform, and which areas remain untapped. This is where interactive maps play a crucial role. Visualize  franchise coverage on a map, businesses can instantly see location patterns, service reach, … Read more

how to apply multiple filters

How to Apply Multiple Filters Together on a Map

When you work with location-heavy data, simply placing points on a map is not enough. You need a way to apply multiple filters on map , compare categories, and instantly highlight visuals that matter. That is why applying multiple filters together on a map becomes so powerful. It helps you narrow down results, spot patterns … Read more

Filter Properties for Insights

How Developers Use Filters to Visualize Properties by Price, Type & Status

In today’s real estate tech landscape, clarity and precision in data visualization are essential for smarter property decisions. Simply listing properties isn’t enough-you need a way to slice, sort, and understand them instantly. That’s where Interactive filters come in. By Filter Properties for Insights based on price range, property type, and availability status, maps become … Read more

Analyze Village Healthcare

How to Analyze Village Healthcare Coverage Using Maps

To analyze village healthcare coverage, planners increasingly use maps because they turn scattered health data into clear, visual insights. In rural planning, decision-makers often delay actions due to poor visibility. However, when analysts map villages and healthcare facilities together, they identify coverage gaps faster. As a result, MAPOG make village healthcare coverage analysis not only … Read more

MAPOG interface showing tools to Filter Your Map Data by attributes for smarter location and site selection.

How to Filter Your Map Data by Any Attribute or Field

Modern planning teams operate in environments where speed, accuracy, and clarity directly influence outcomes. Consequently, the ability to filter your map data by any attribute becomes a core strategic skill. In high-growth sectors like EV infrastructure, teams often evaluate hundreds of potential locations before selecting only a few high-impact sites. While this process traditionally demands … Read more

How to Geocode Your Addresses

How to Geocode Your Addresses and Plot Them on a Map

How to Geocode Your Addresses and Plot Them on a Map is one of the most essential skills today for businesses, researchers, developers, and organizations who utilize location-based insights. Geocoding simply means converting a physical address into geographic coordinates such as latitude and longitude. Once those coordinates are generated, they can be plotted on a … Read more

How to Collect Customer Feedback On-Ground and view real-time responses on a live map using a mobile data collection platform.

How to Collect Customer Feedback On-Ground and See It Live on the Map

Today’s teams need real, unfiltered insights straight from the field. When you Collect Customer Feedback On-Ground, you get honest input right where customer experiences actually happen. MAPOG’s mobile data collection capability helps make this easier by letting teams gather feedback on-site and see it instantly on a map, giving everyone a clear and immediate view … Read more

Assign & Track Field Tasks Directly on a Map (With Photos & Status)

Assign & Track Field Tasks Directly on a Map (With Photos & Status)

Interactive maps turn static operations into visual workflows to assign and track field tasks, monitor routes, verify cleaning with real-time updates and photos.. Key Concept: Assign & Track Field Tasks Interactive task mapping centralizes field work, assigns tasks, tracks completion, verifies results with photos, and improves coordination and transparency. What is Assign & Track Field … Read more

How to Download Only Your Filtered Map Data in One Click

How to Download Only Your Filtered Map Data in One Click

To begin with, downloading only your filtered map data is an easy way to extract clean, relevant datasets without exporting your entire project. Moreover, this approach helps planners, teams, and analysts avoid cluttered exports and get only the insights they need. As a result, you save time and download small, ready-to-use files directly from your … Read more