Managing building data and visualizing urban structures often requires specialized GIS or CAD software. MAPOG simplifies this process by allowing users to create and visualize 3D building footprints directly on an interactive map without any advanced technical skills. This helps planners, real estate professionals, educators, and businesses better understand building layouts, heights, and urban landscapes.
Key Concept: 3D Building Footprints
3D building footprints transform standard building outlines into realistic three-dimensional structures on a map. This improves spatial visualization, supports urban planning, enhances site analysis, and helps users better understand building density, height variations, and surrounding environments.
Methodology: 3D Building Footprints
Create and visualize 3D building footprints on interactive GIS maps to improve urban analysis, planning, presentation, and location-based decision-making.
1. Choosing Your Map Type
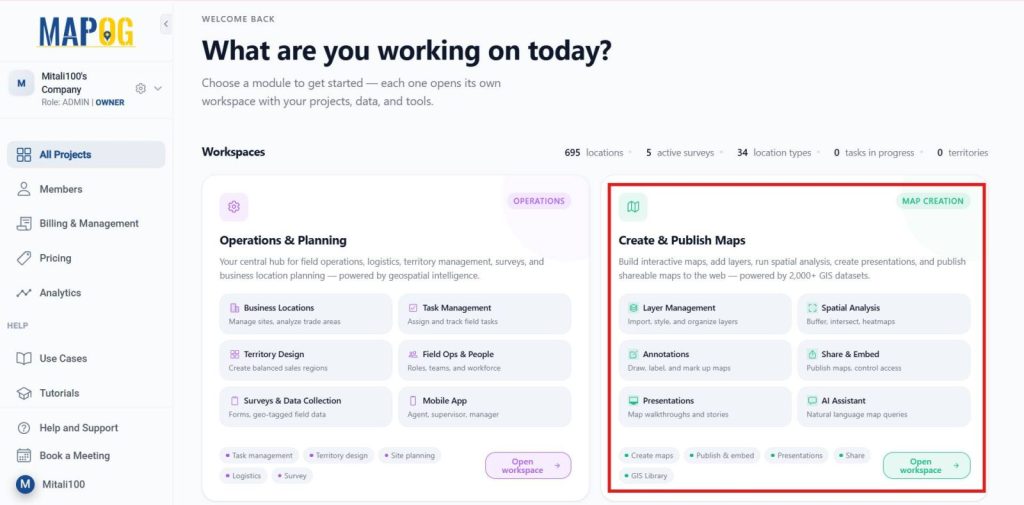
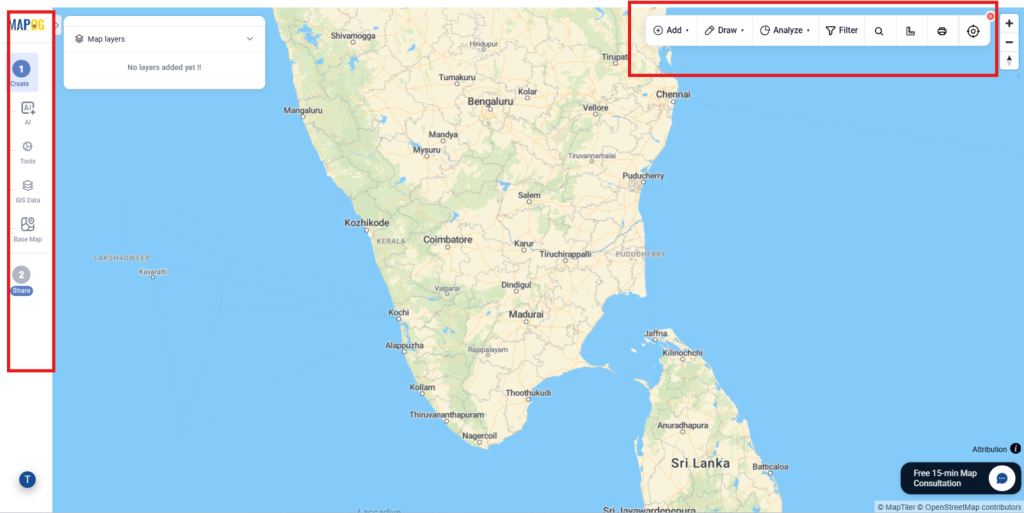
Launch MAPOG, navigate to Create and Publish Maps, and then select Open Workplace.
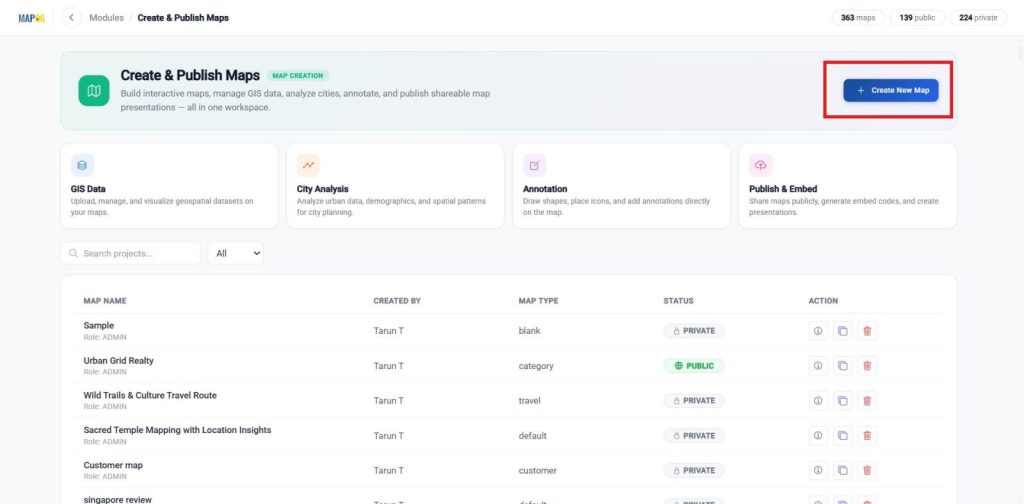
after opening workspace and click + Create New Map.
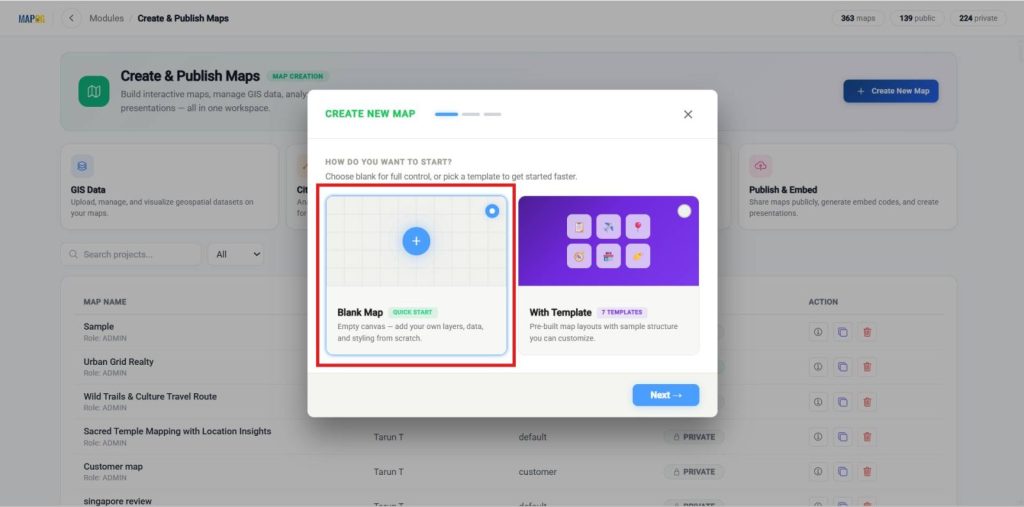
This step is important because it defines your entire workflow. If your goal is to analyze geographic data, build layers, or run spatial tools, choose a Blank Map.
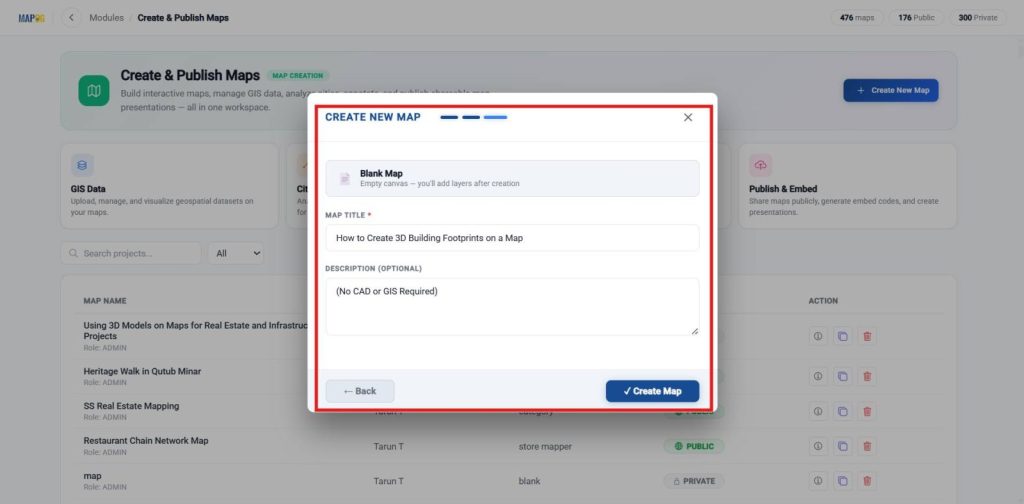
Enter a clear title and a brief description, then click Create to save your map.
A Blank Map is designed for full GIS control. It gives you a flexible environment where you can build everything from scratch and perform detailed spatial analysis.
2. Create Your 3D Model
Once the map is created, select go to the annotation in tools bar.
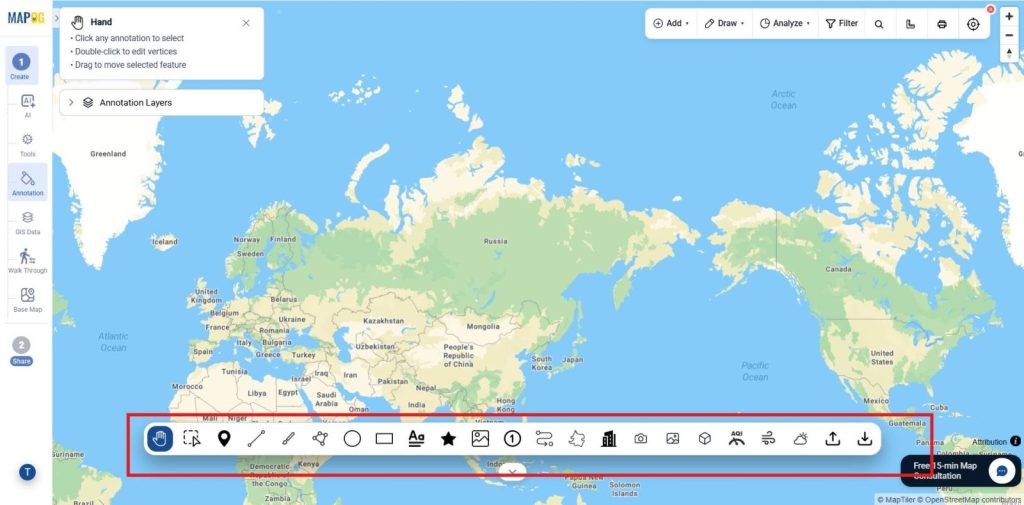
In Annotation move to the 3D boundary and select Make custom locations.
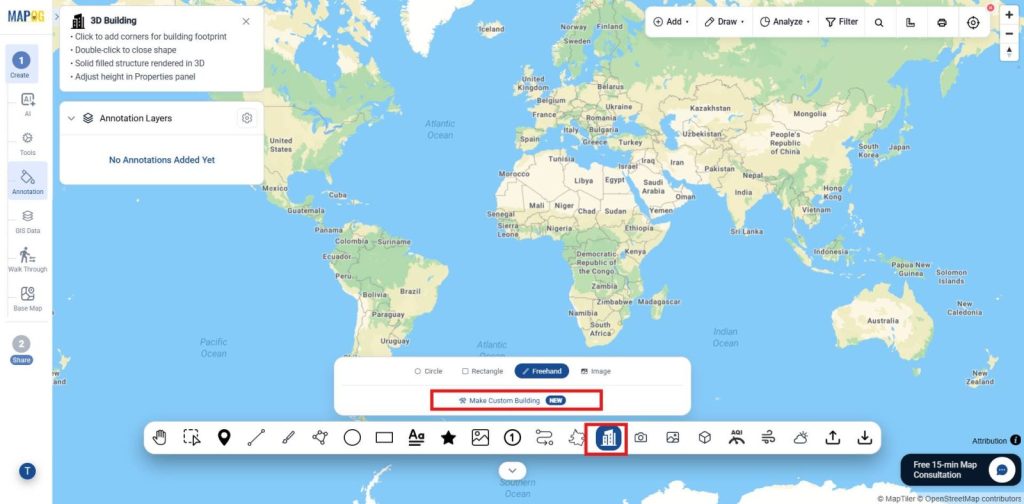
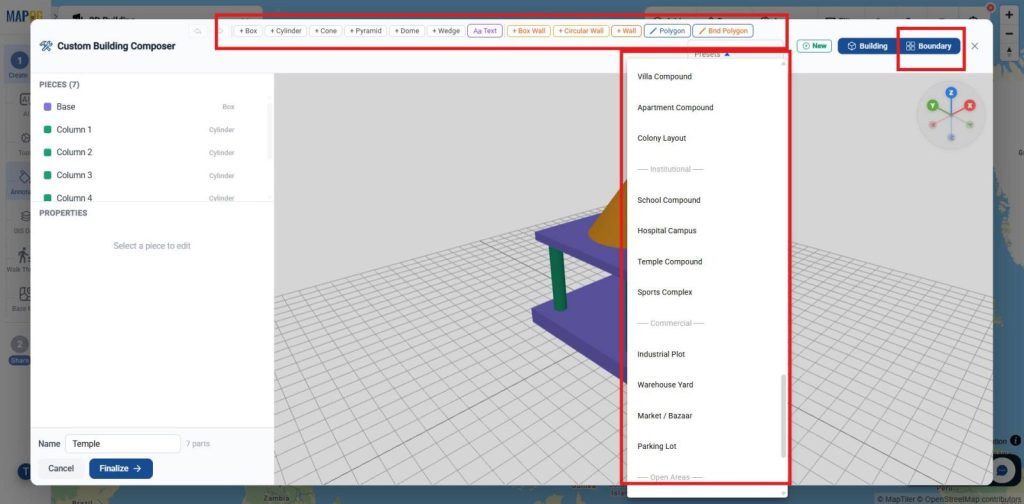
In Make custom locations, there are already readily available models in buildings and these are the tools available in those.
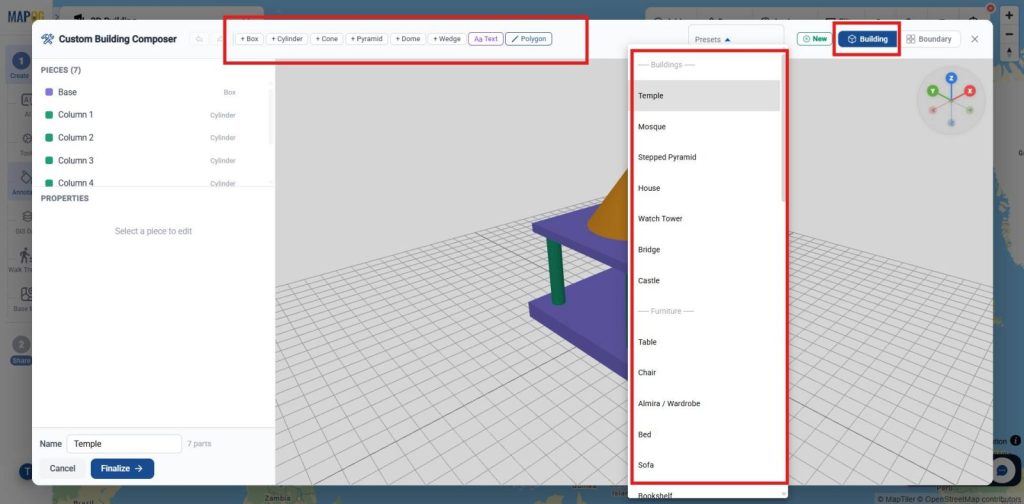
We can also turn on the Boundary to get more available models and tools related to the boundary as shown.
Now, if you want to create a new model select +New as given.
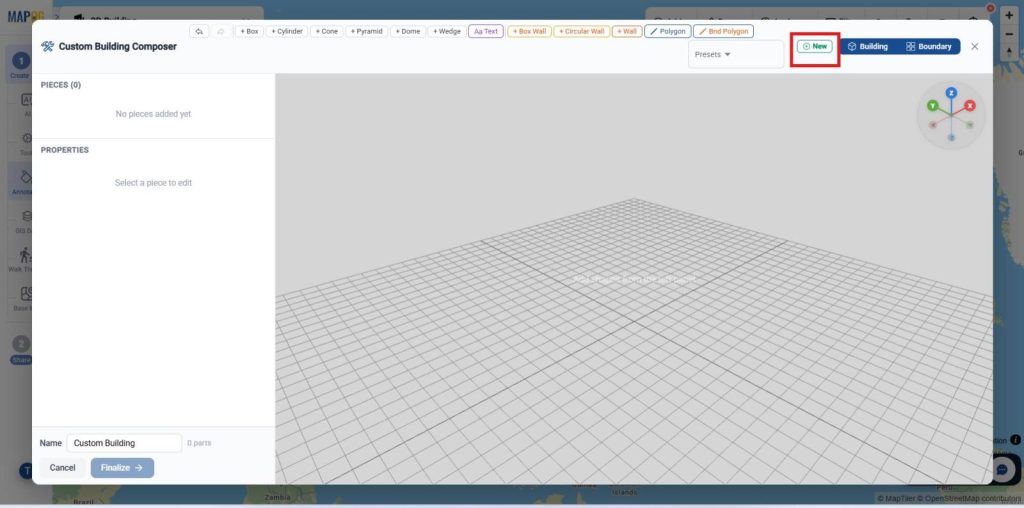
Once you create a new one, give it a name.
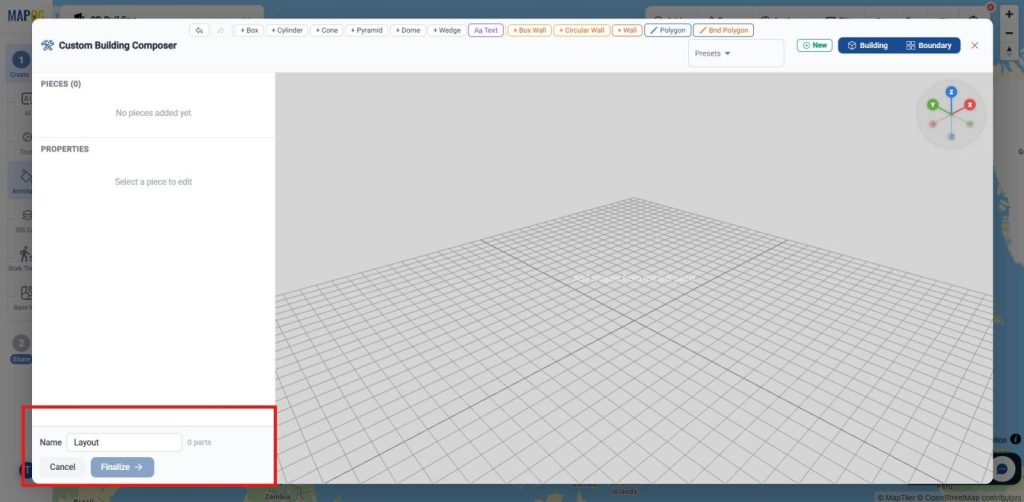
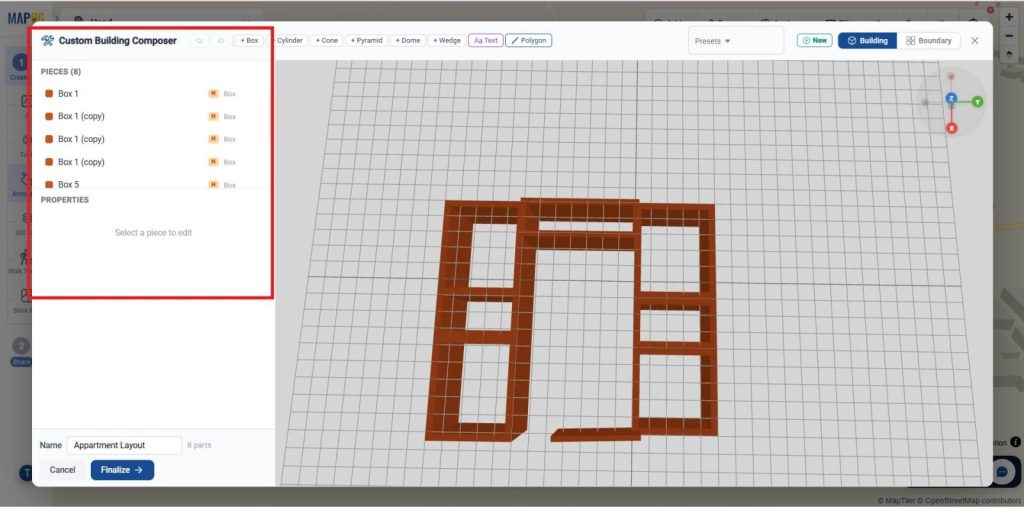
Once the basic things are done you can use the tools like wall box etc, to prepare the model you needed.
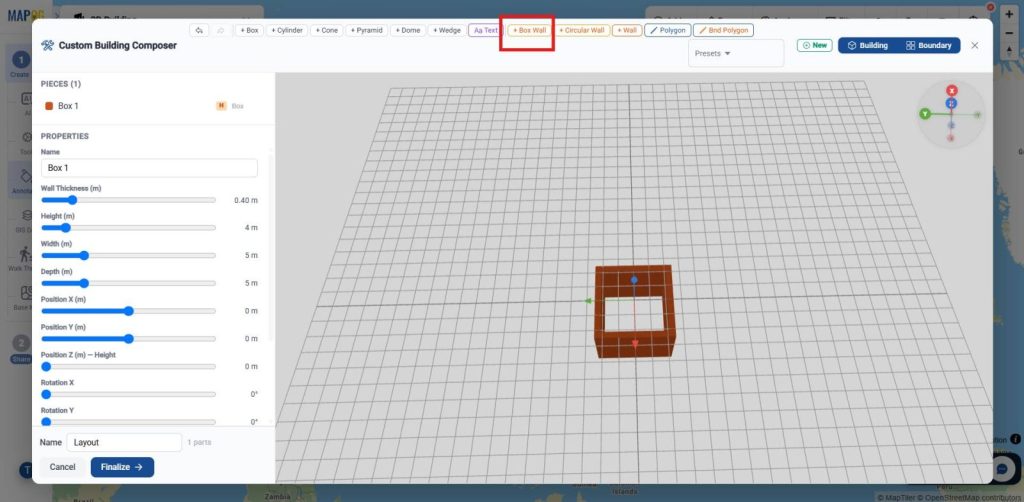
Here, in properties you can create a three-dimensional building footprint with a layout, wall thickness, positioned at the map origin with rotation, color, and texture applied as required .

Similarly prepare an entire thing as you need as the pieces have the entire list of things we created.
3. Upload Your 3D Model
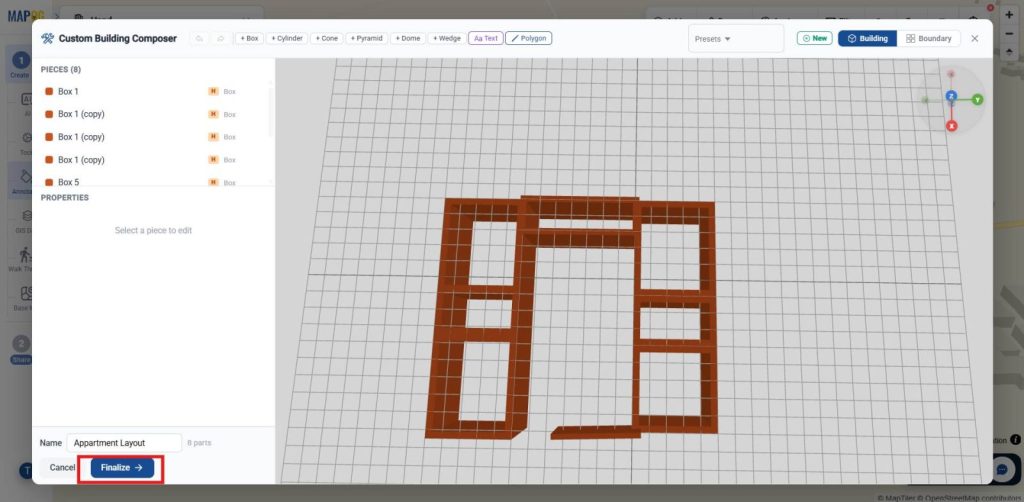
Now, select finalise to place the 3D model in your map where you require.
Once you select finalise it redirects you to the map now you can either search your location by name or Lat/Long.
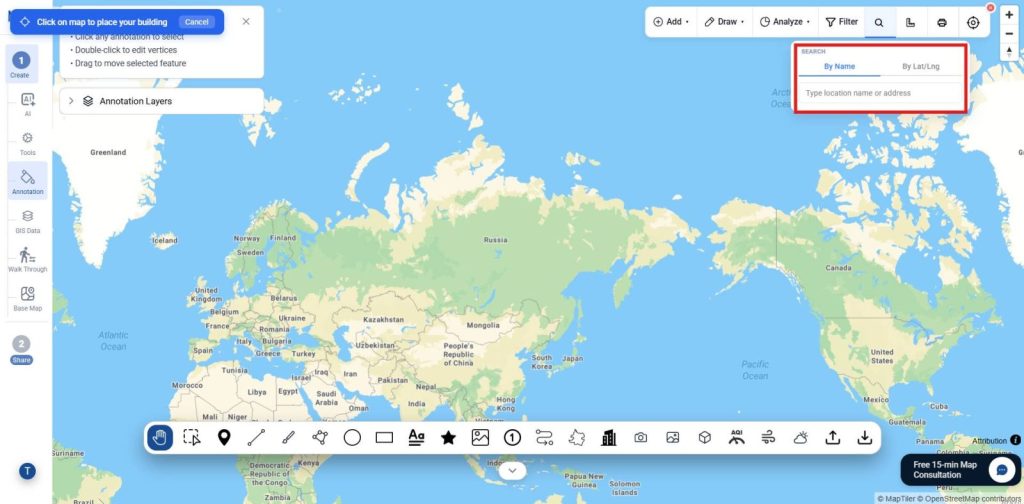
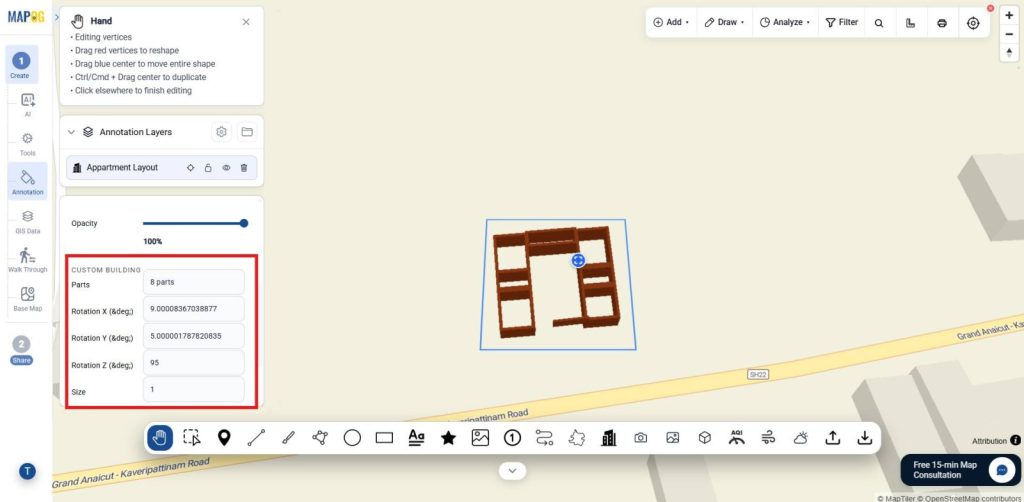
Now place the cursor and place the model where you required.
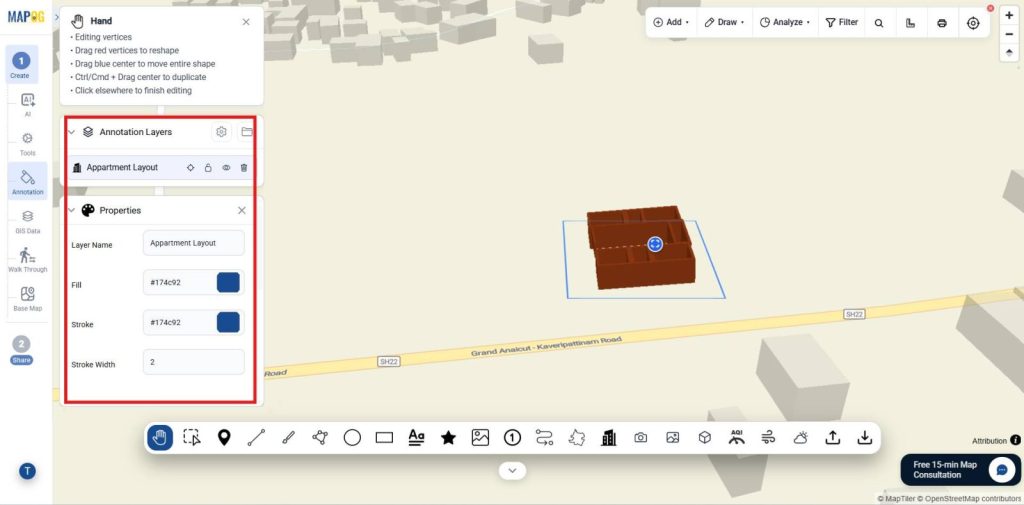
Also Here, using the properties you can adjust the part, rotation size and all as shown.
Addition, If you need to edit the model again you can go back using the edit in composer and do the required corrections and place the model.
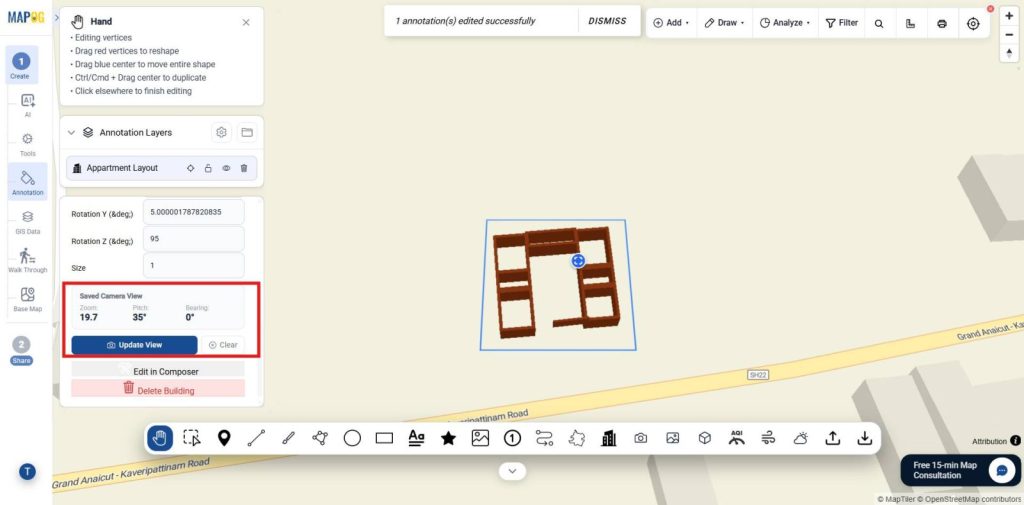
Once, you are finalised with the view you can fix it using fix view and also you can update view in future.
4. Adding Brand Logo
Now customize your project branding from Map Settings. Click Replace to upload a company logo or project image, make the required adjustments.
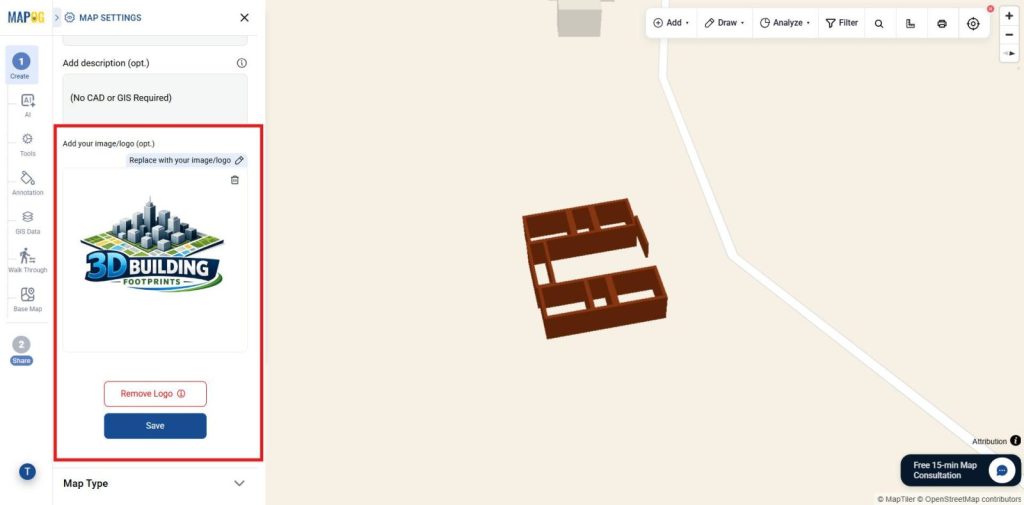
And save it as the branding element.
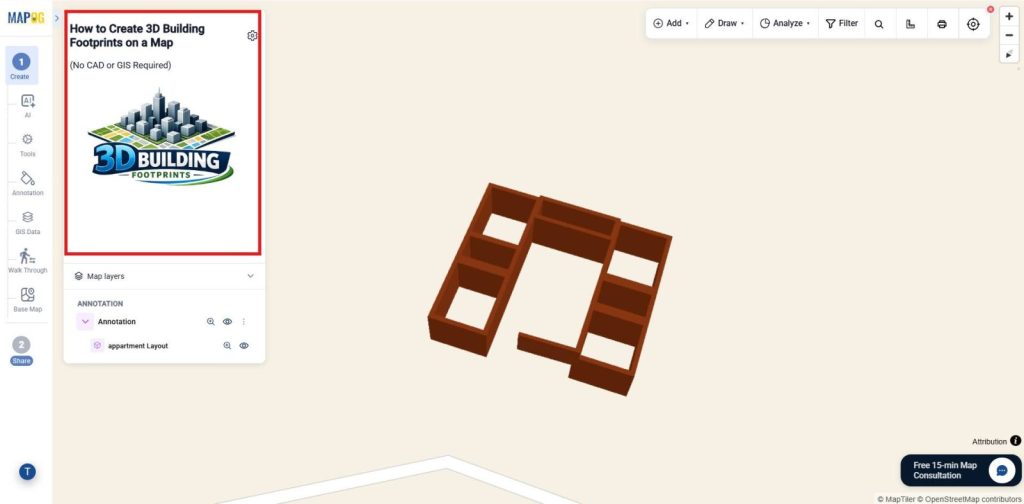
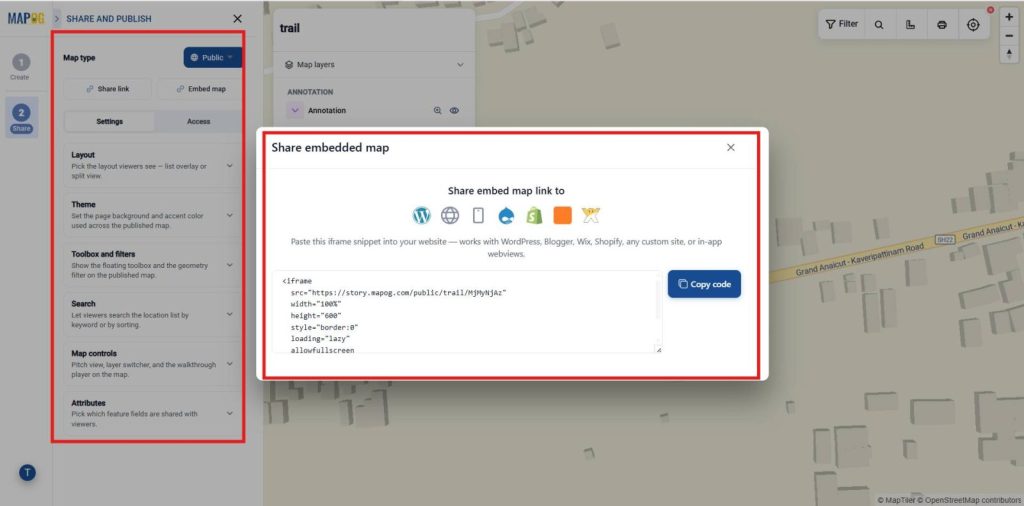
5. Publish and Share Your Map
Once setup is complete, use Preview & Share to publish your map and generate a shareable or embeddable link, letting users explore properties by all or selected attributes.
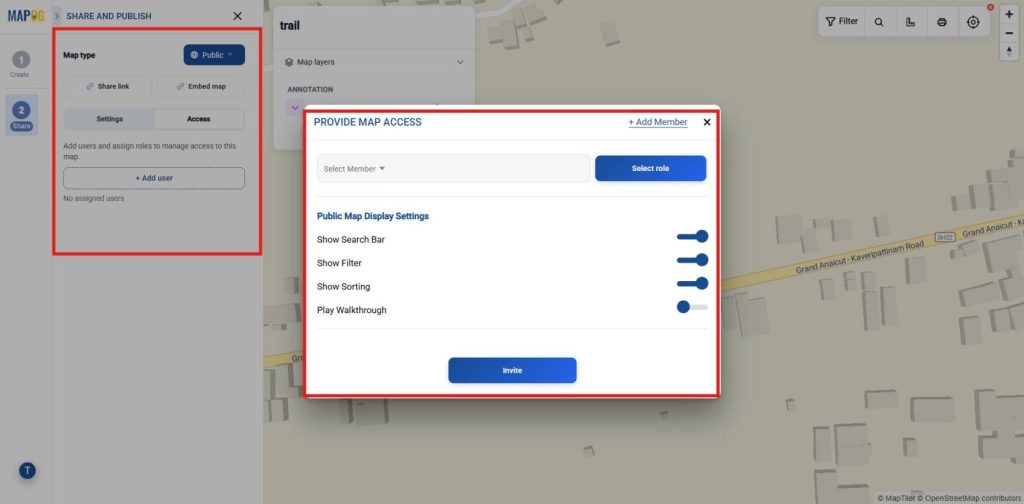
For instance, Provide map access by adding users, assigning roles, and enabling shared tools like geometry filters, search, and map controls. Use +Add Users to invite members, assign view/edit permissions, and enable public map features like search, filters, sorting, and shared tools.
Industry Use Cases and Benefits
Moreover, Visualize three-dimensional building footprints on interactive maps to improve urban planning, property presentations, site assessments, construction planning, and spatial analysis, making projects easier to understand and communicate.

Conclusion
In conclusion, MAPOG makes 3D building footprint creation simple by transforming building outlines into interactive three-dimensional visualizations, helping users analyze locations, present projects, and make informed decisions without requiring CAD or GIS expertise.