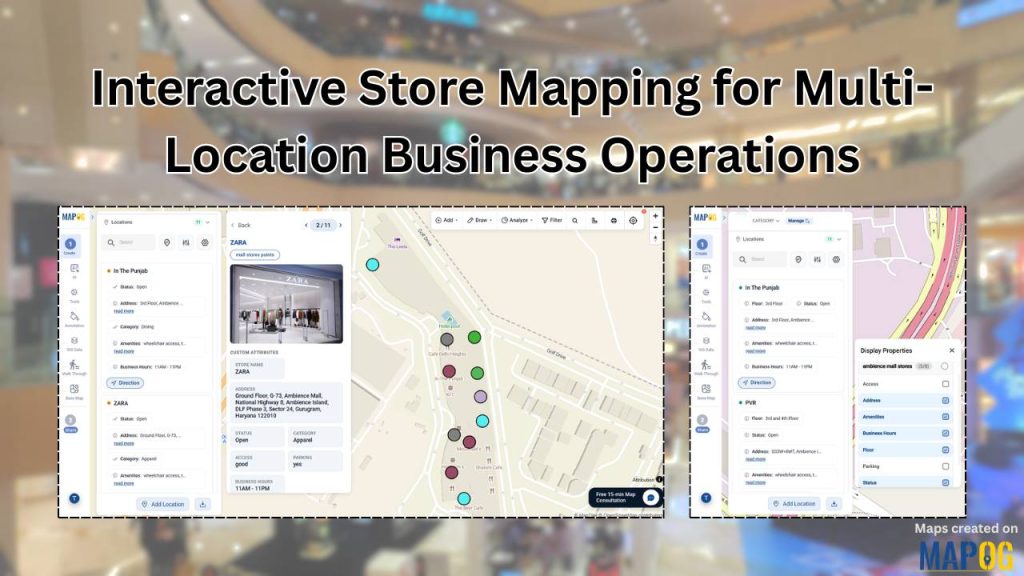
Managing an interactive, store retail network using flat spreadsheets creates massive operations friction and zero spatial context. MAPOG solves this by transforming raw data into a location-intelligent map, providing absolute spatial clarity to seamlessly track tenants, isolate vacancies, and streamline operations on a single interactive store mapping dashboard.
The Spreadsheet Bottleneck & how Interactive Store Mapping solves it
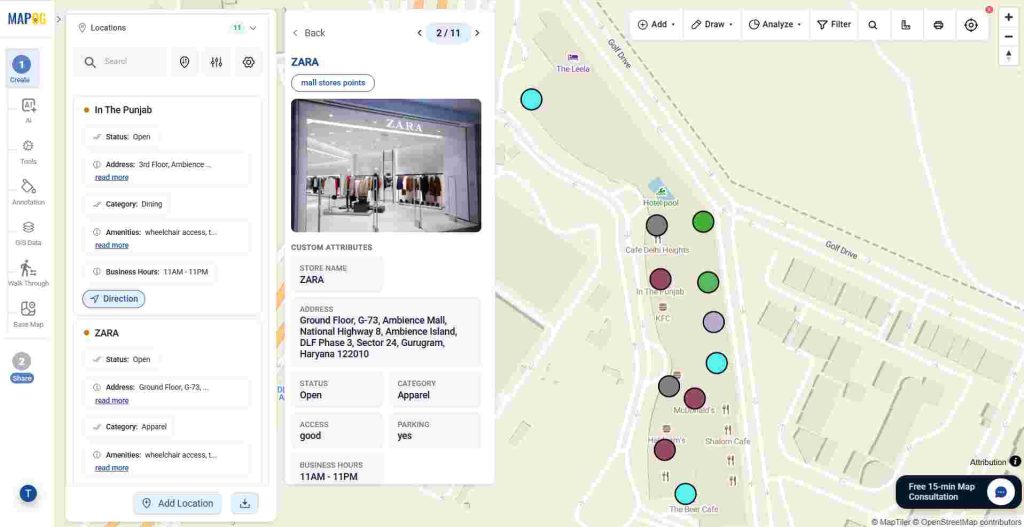
Most retail stores and operations managers are forced to rely on flat excel spreadsheets, disjointed PDFs, or static floor plans to track physical assets. Shifting from flat rows of text to a dynamic, location-intelligent, visual, and interactive dashboard is where MAPOG’s customizable store mapper canvas comes in. By centralizing an entire multi-location portfolio onto an interactive map, businesses can track tenant distribution, floor logistics, and real-time operations at a single glance.
Step-by-Step Workflow for interactive Multi Store Mapping
Transforming raw coordinates and store-data into a fully functional asset management tool is a seamless, step-by-step process. Here is how to configure it from scratch.
Step 1: Establish your data foundation
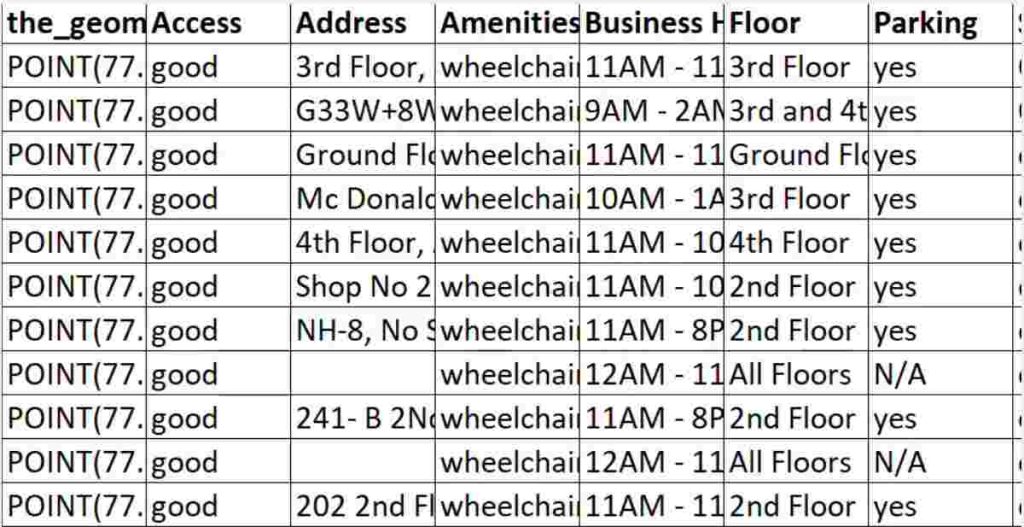
Before opening your mapping workspace, compile a clean excel or CSV spreadsheet of the locations you want to track.
Accordingly, ensure your sheet includes core operational attributes such as Store Name, Address, Category, Status, Access, Amenities, etc.
Step 2: Configure your custom business location template
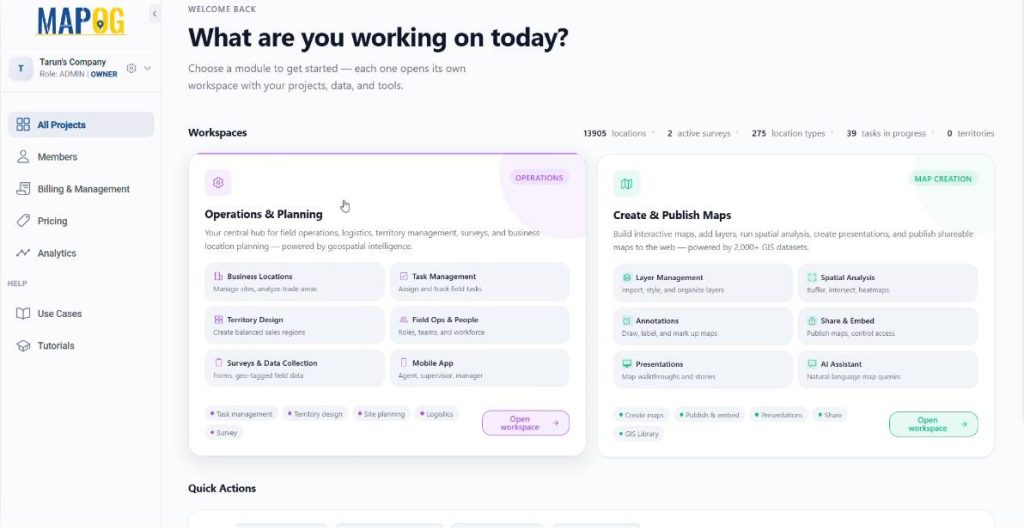
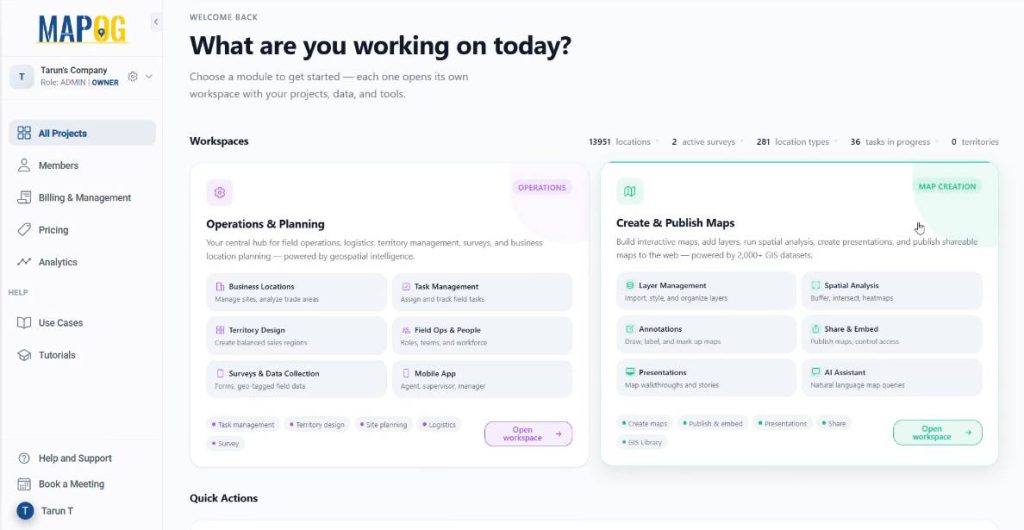
First, go to the MAPOG dashboard and navigate to the Operation & Planning workspace.
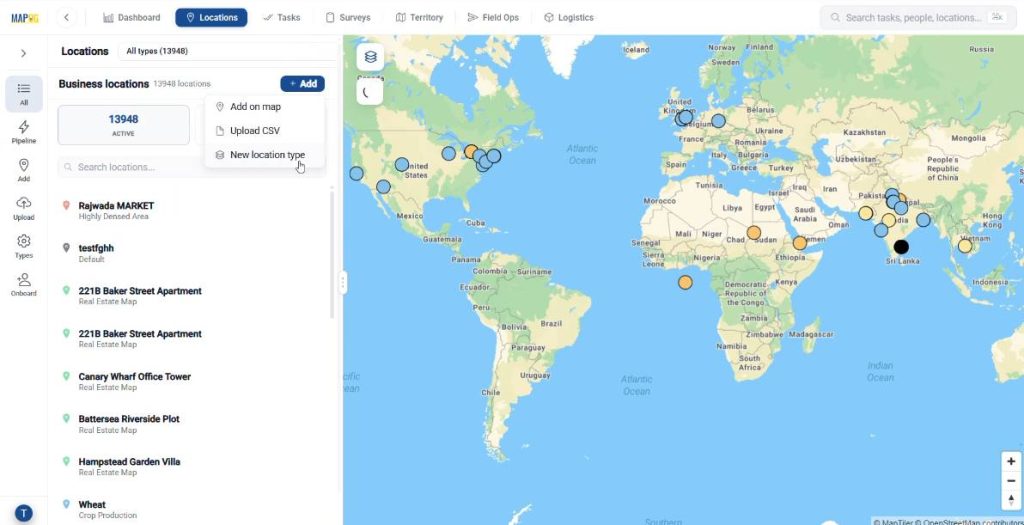
Next, go to the locations section and click Add, and select New Location Type.
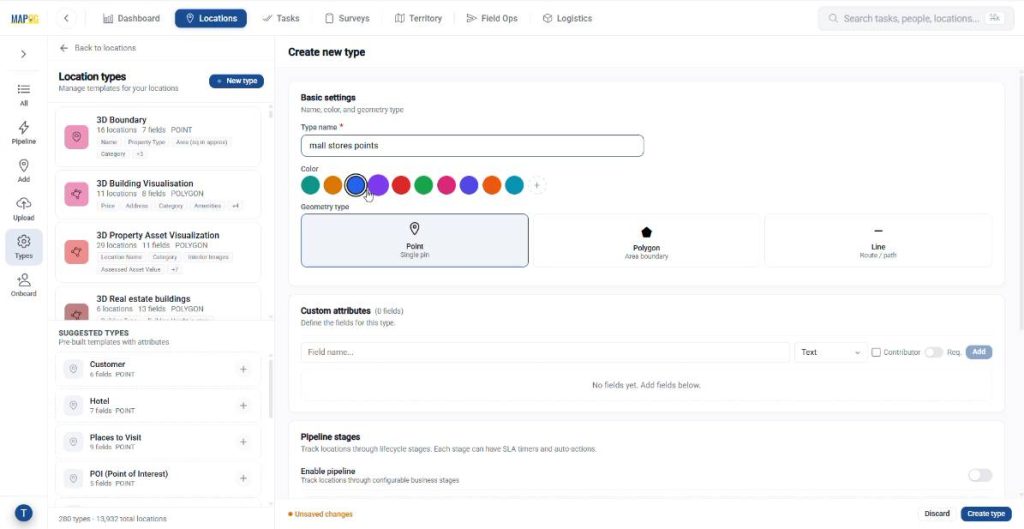
Additionally, give your location type an appropriate title, choose a color and select Point Type location.
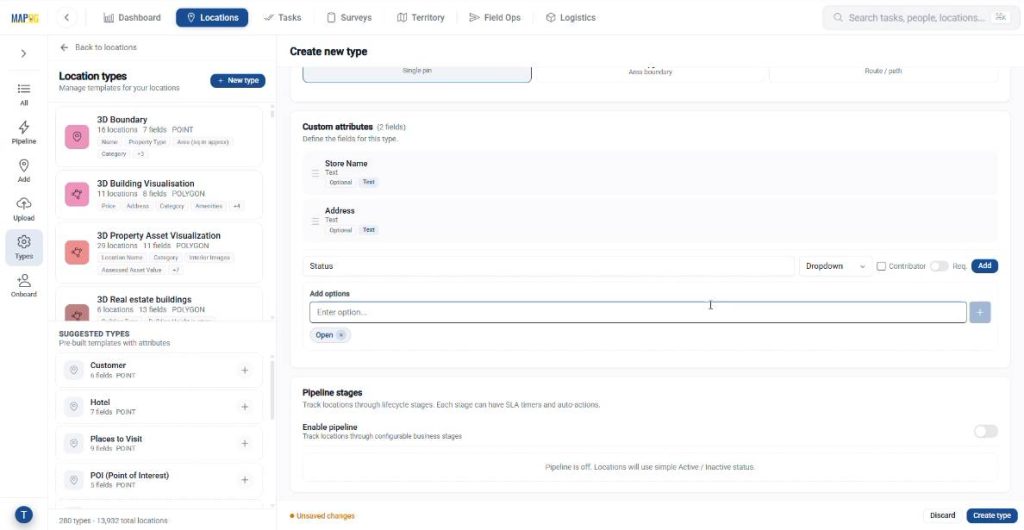
Finally, define location attributes and choose field types for your data.
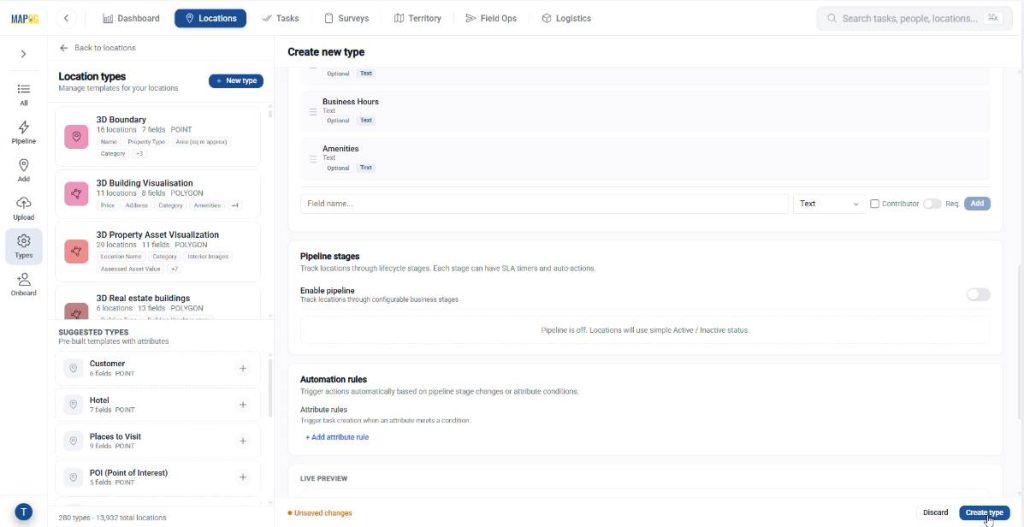
Afterward, click on create type to save the location template.
Step 3: Initialize the Branded Map Canvas
Next, return to the main dashboard and navigate to the Create and Publish Maps workspace.
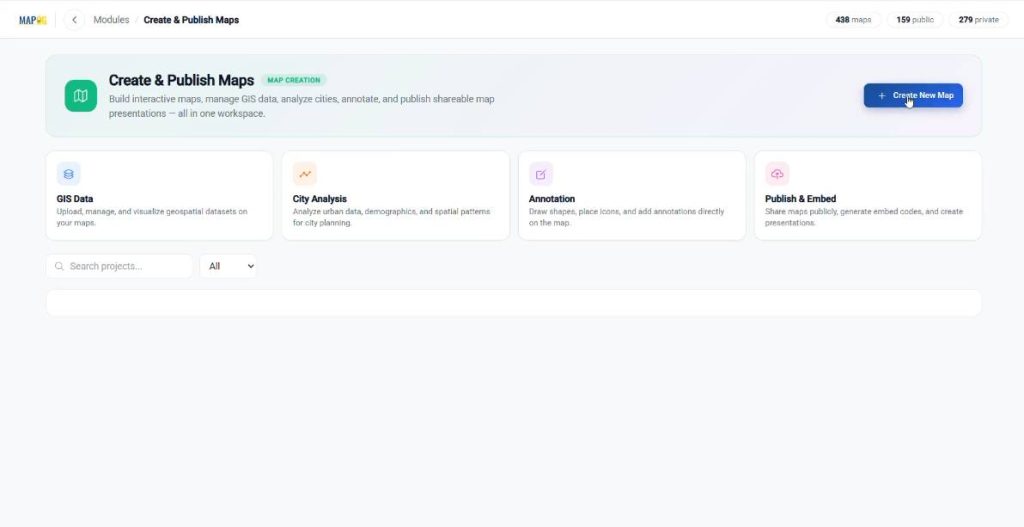
Then, click on Create New Map.
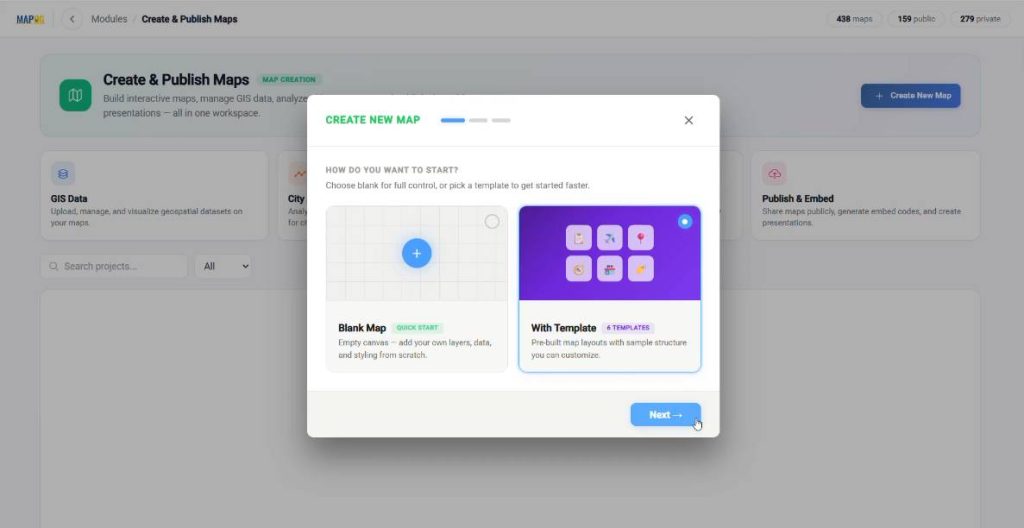
Browse through the with templates sections
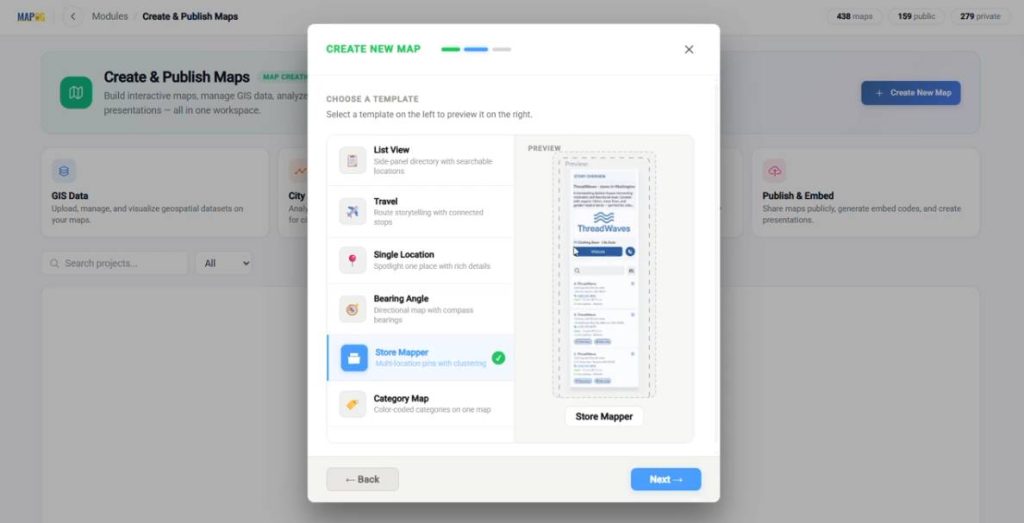
and consequently, select the Store Mapper template. This framework is pre-optimized for retail logistics, bypassing manual development.
Conversely, give your map a professional title and a brief description,
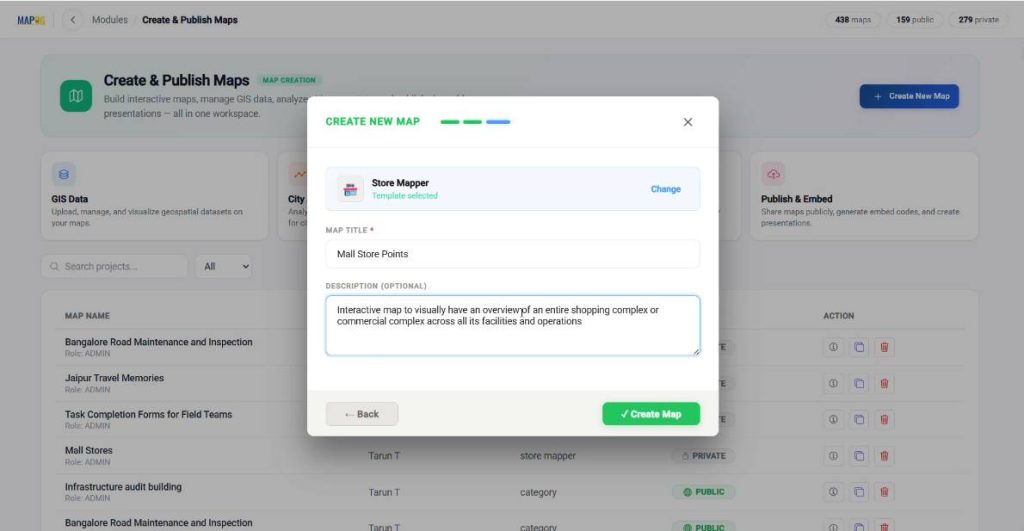
then hit Create Map.
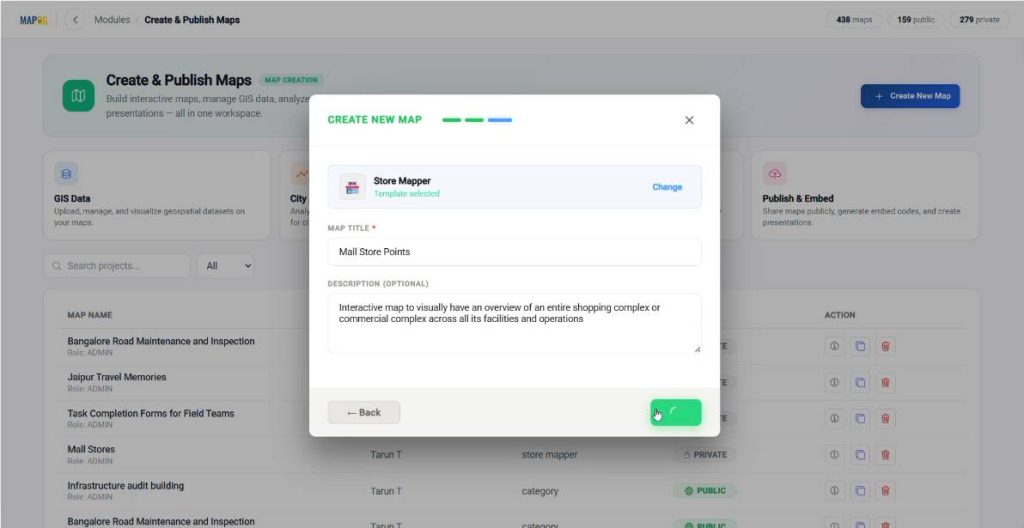
As a result, you now have a blank map with built-in retail or business operations templates ready for you to use.
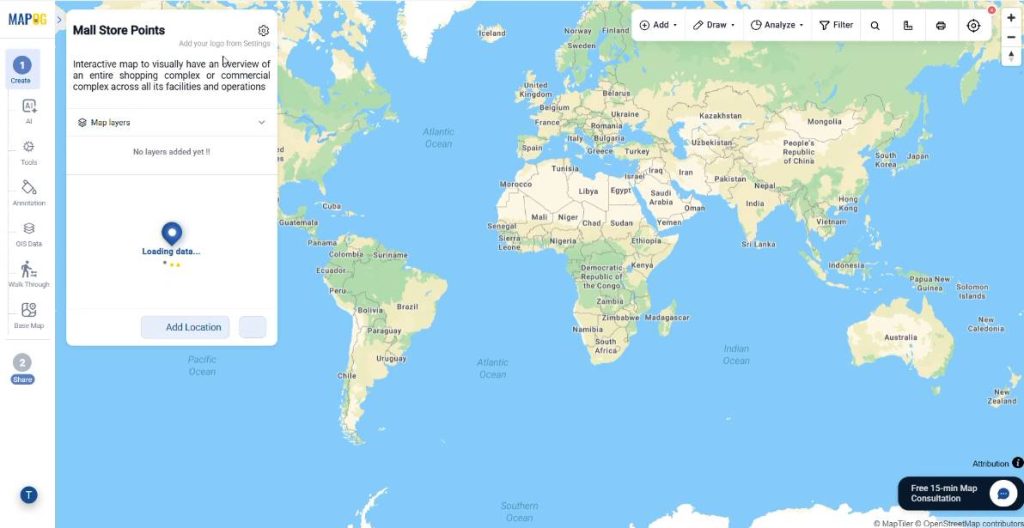
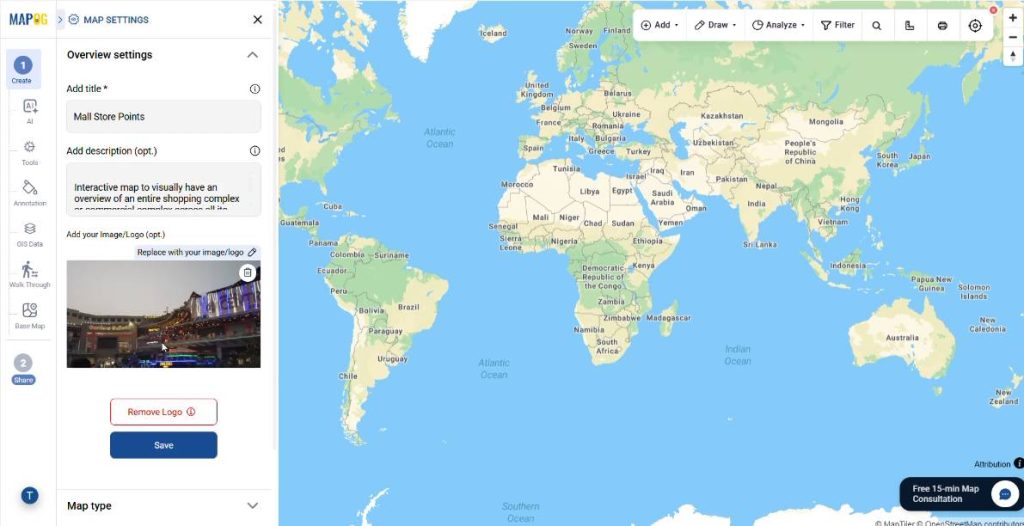
Next, go to Map Settings
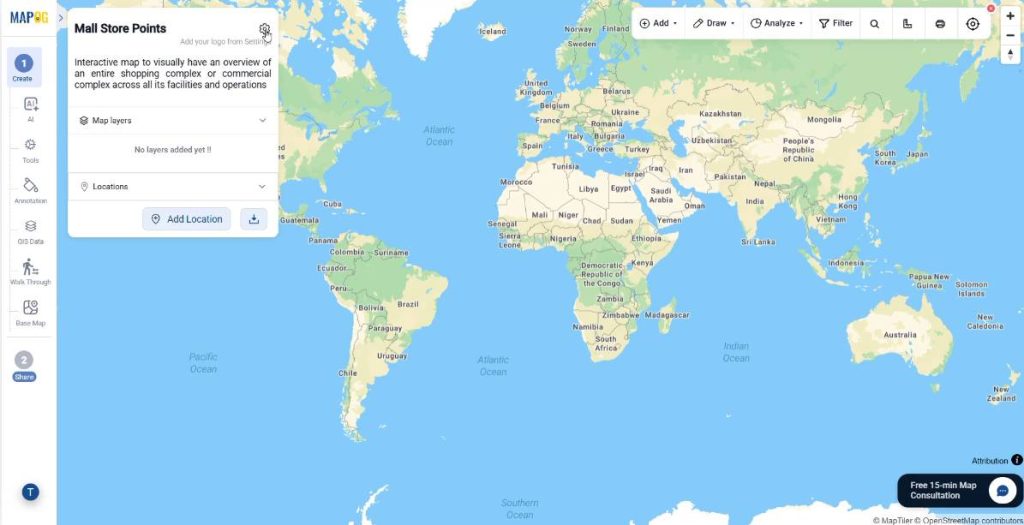
and upload your brand image/logo to instantly inject corporate credibility into the workspace.
Step 4: Import locations and match assets
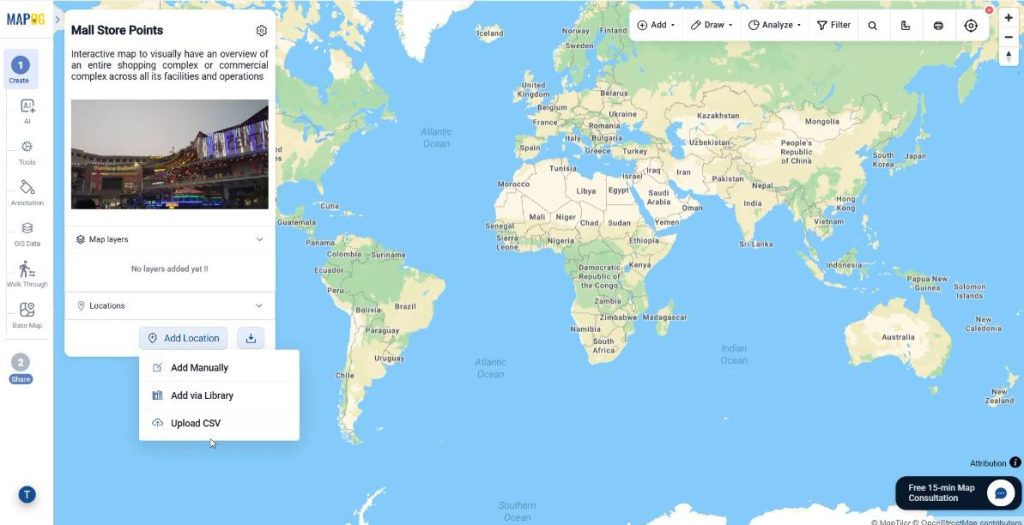
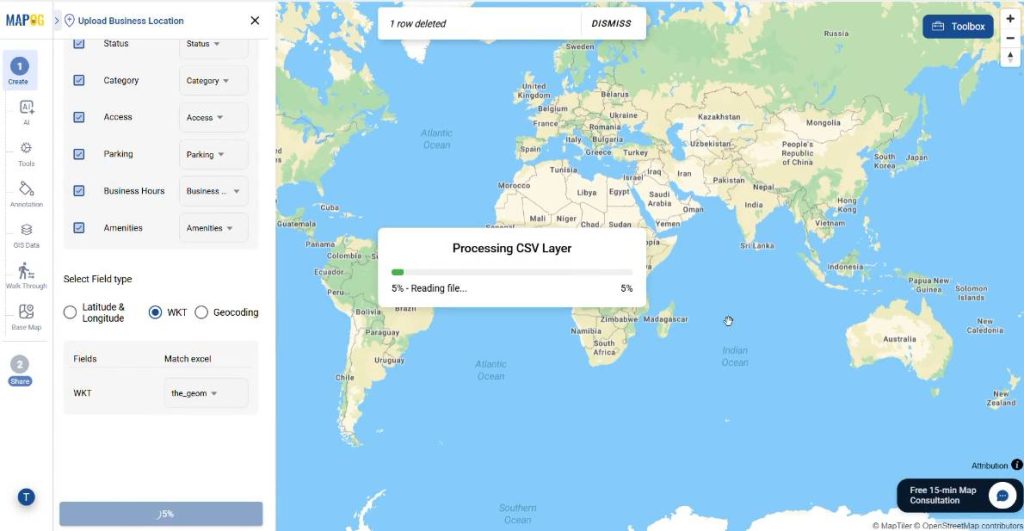
After that, navigate to Add Location and select Upload CSV.
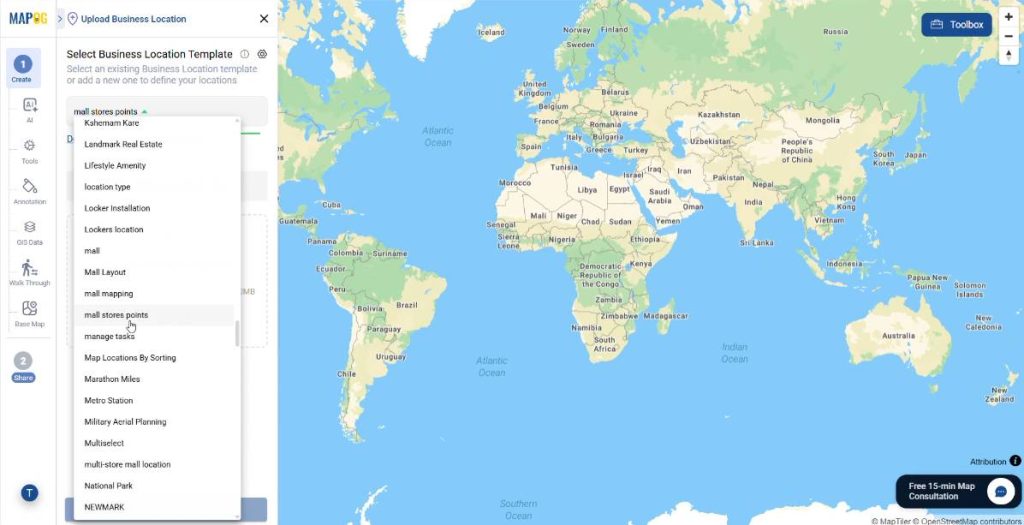
Now, from the dropdown menu, select the location type you created and upload your store-locations CSV file.
After that, map your fields by matching your excel columns to the correct map attributes. Be sure to set the store name as your Unique ID, in order to prevent duplication.
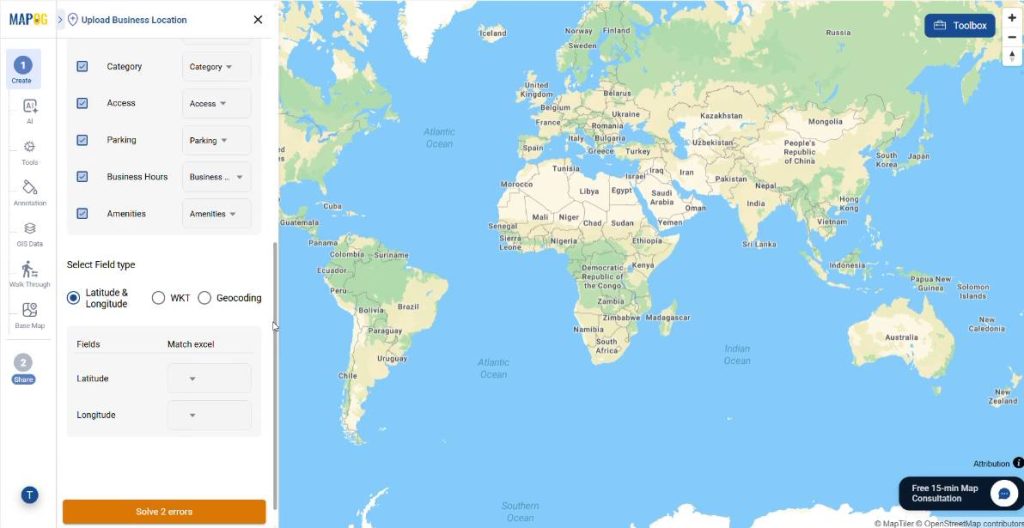
Confirm your WKT fields and hit Submit.
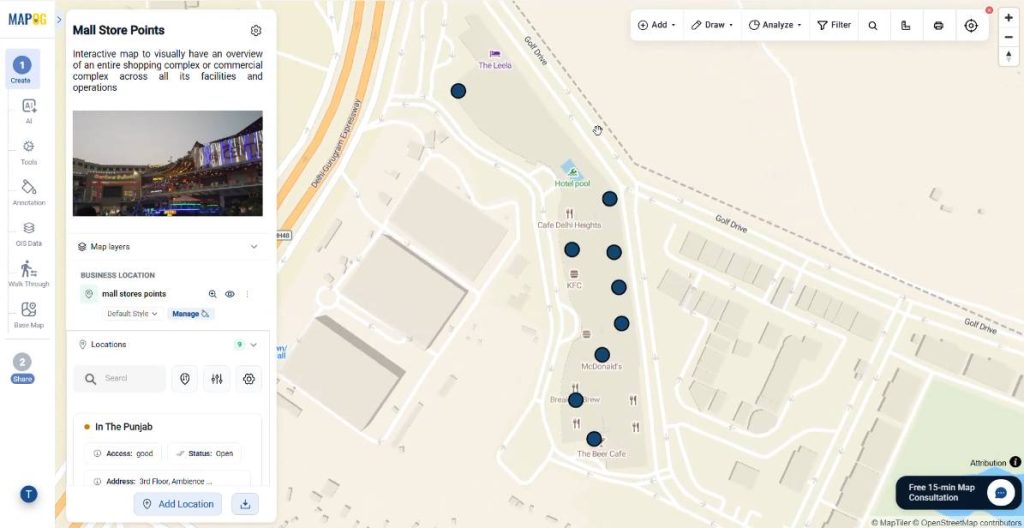
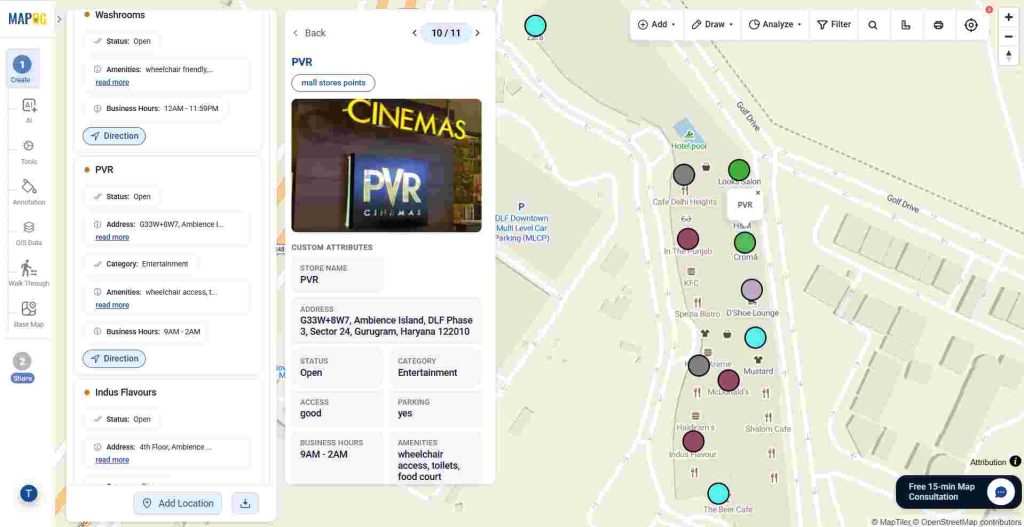
As a result, your stores will instantly pop-up as a set of interactive points across the map canvas.
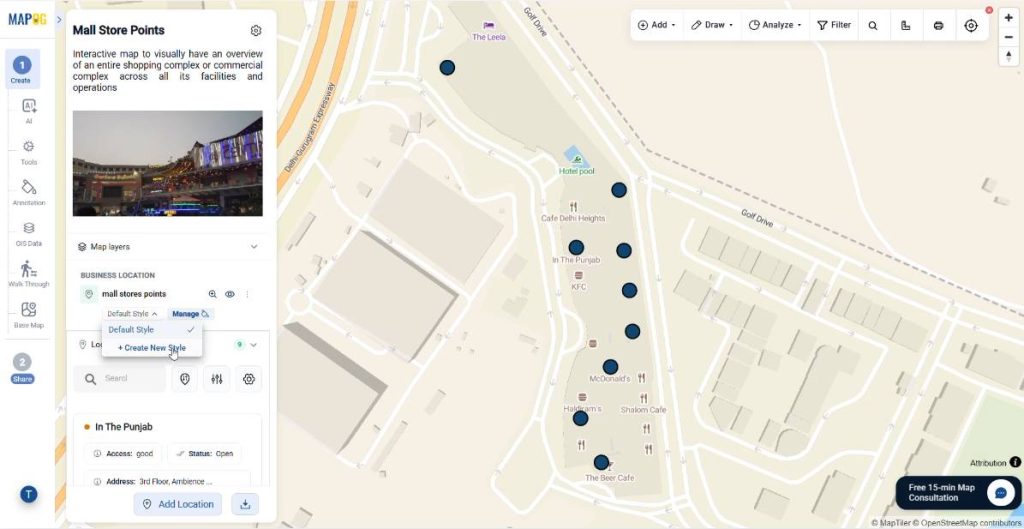
Step 5: Optimize Layouts with Layer Styles and Display Properties
For this, open the style manager and select Create New Style.
Under the Categories section, color-code or iconize categories to segment your assets by sector or access type.
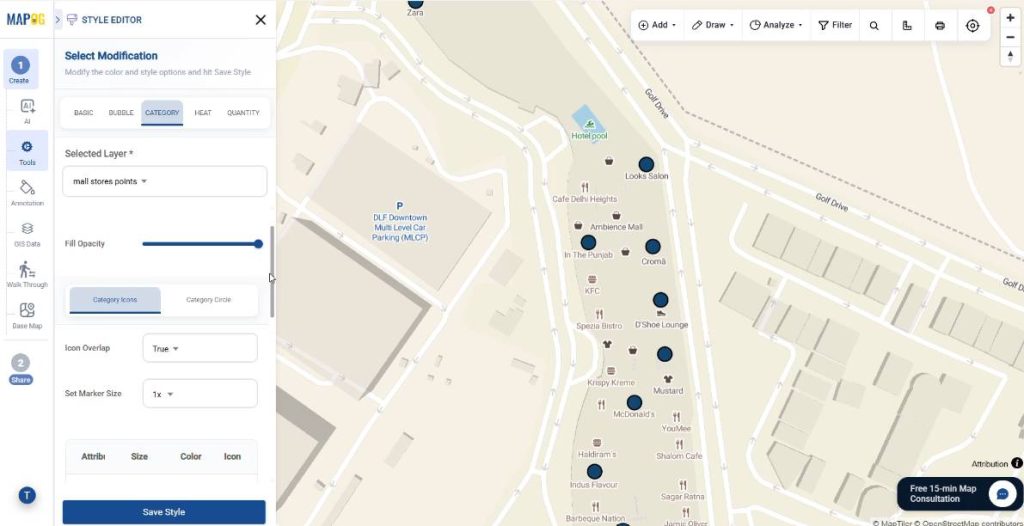
The MAPOG software automatically embeds interactive front-end options onto these styles, creating clickable call-to-action buttons for navigation.
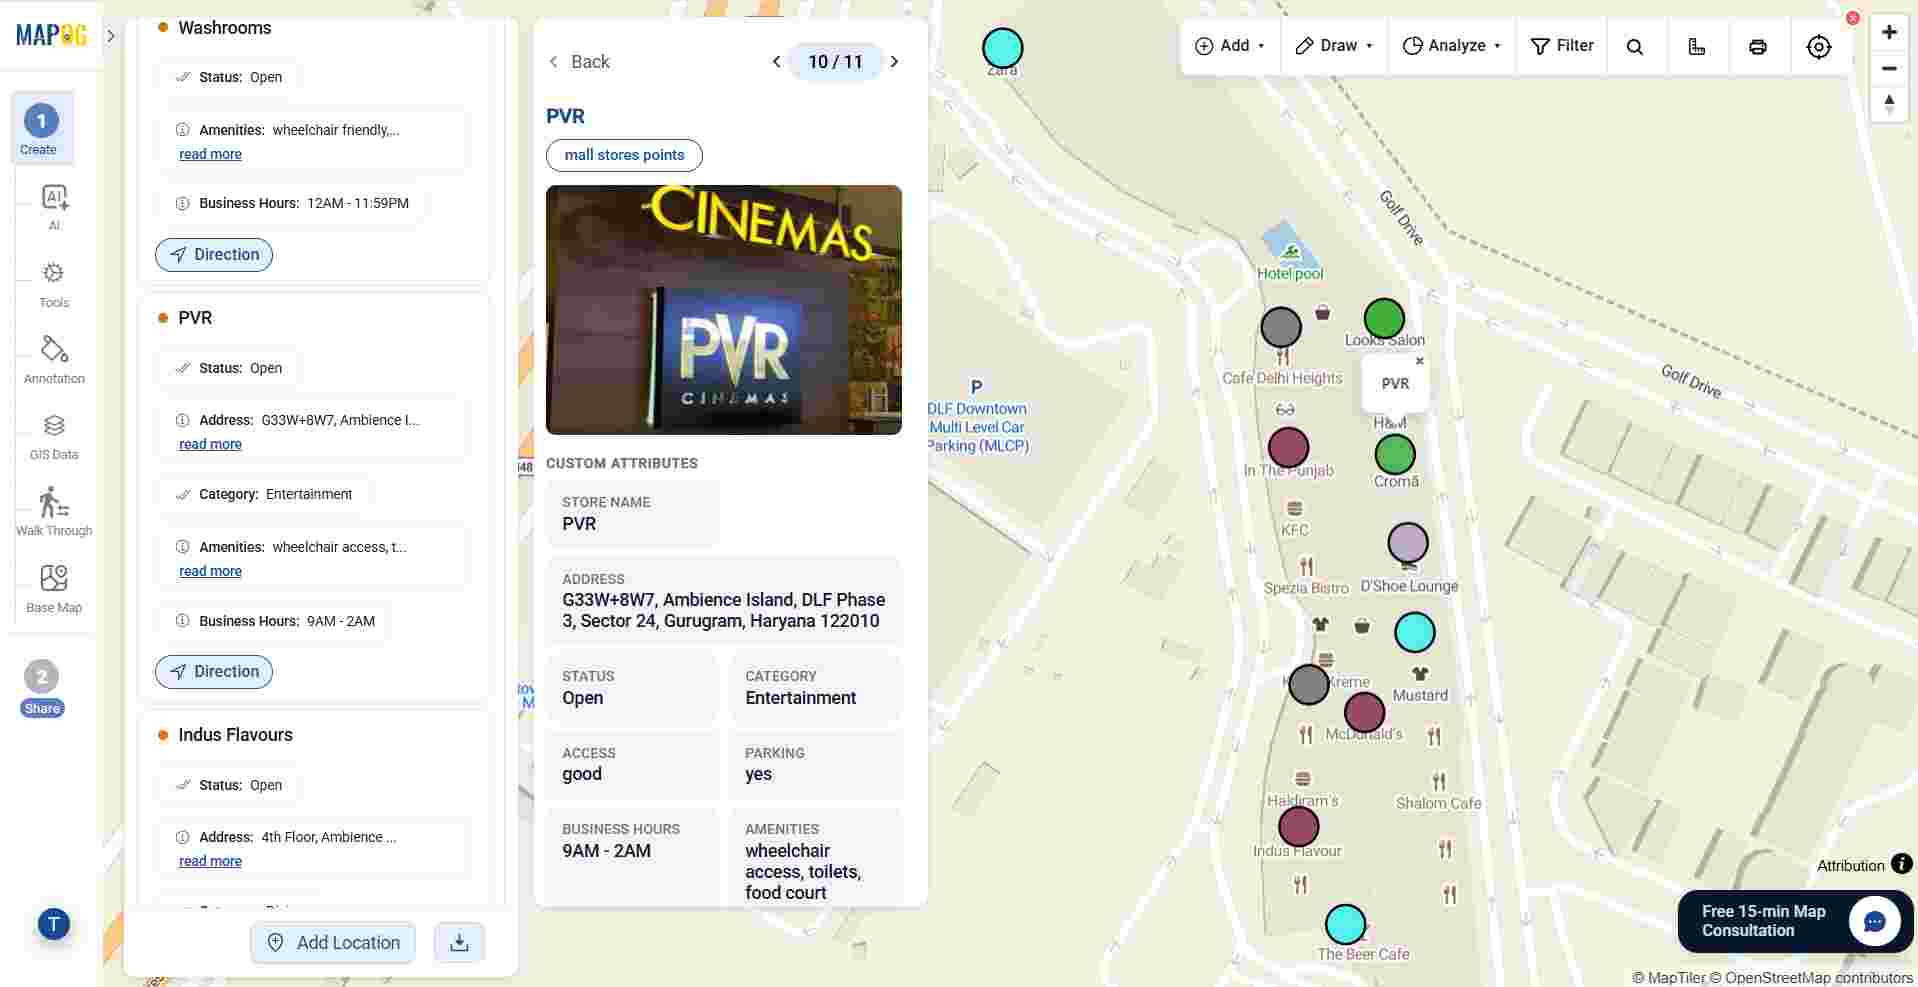
Step 6: Edit Business Locations, Display Properties, and Deploy Operational Filters
You can also edit the data of your store locations to edit, add, or delete any data you want. Select the location pin you want to edit and click on the edit icon. Choose Edit Business Locations.
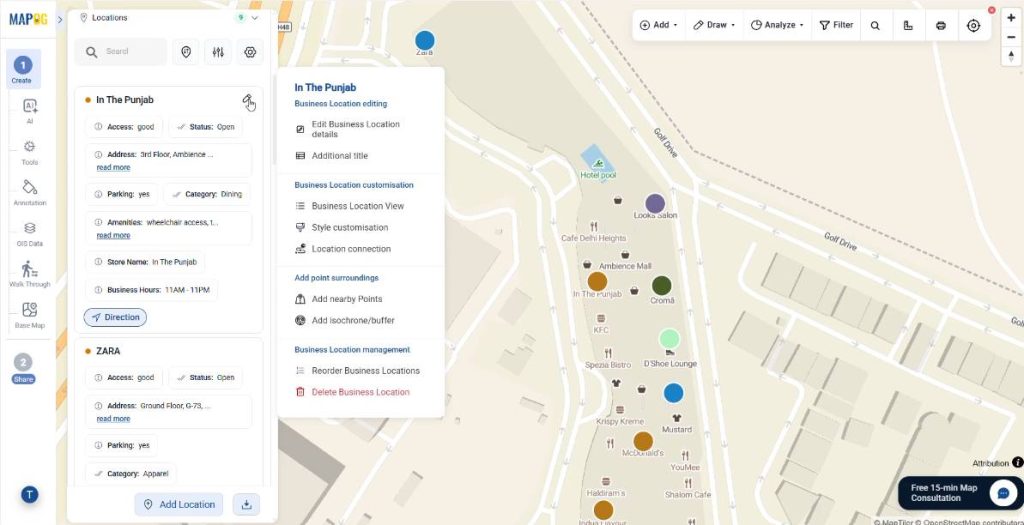
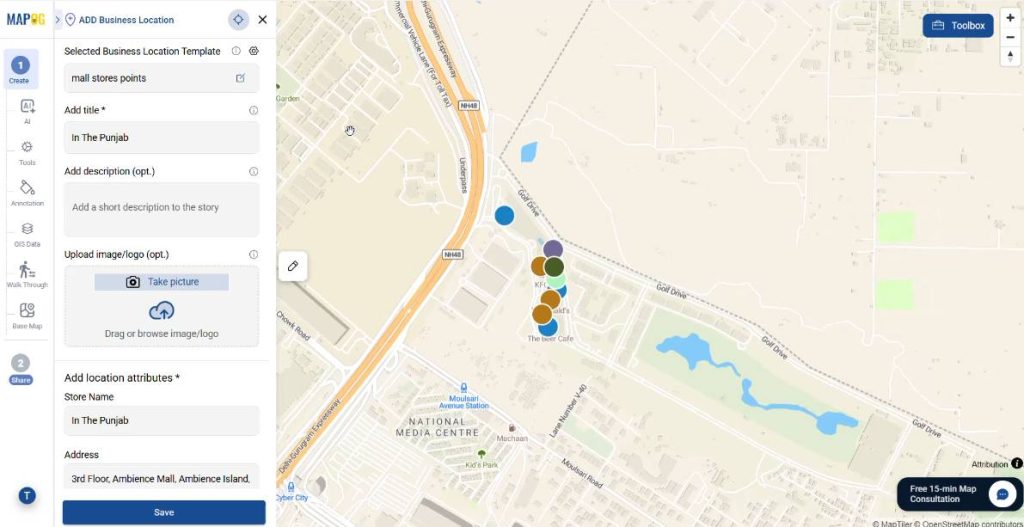
You can now edit location pins directly to update hours or images, then click save to update.
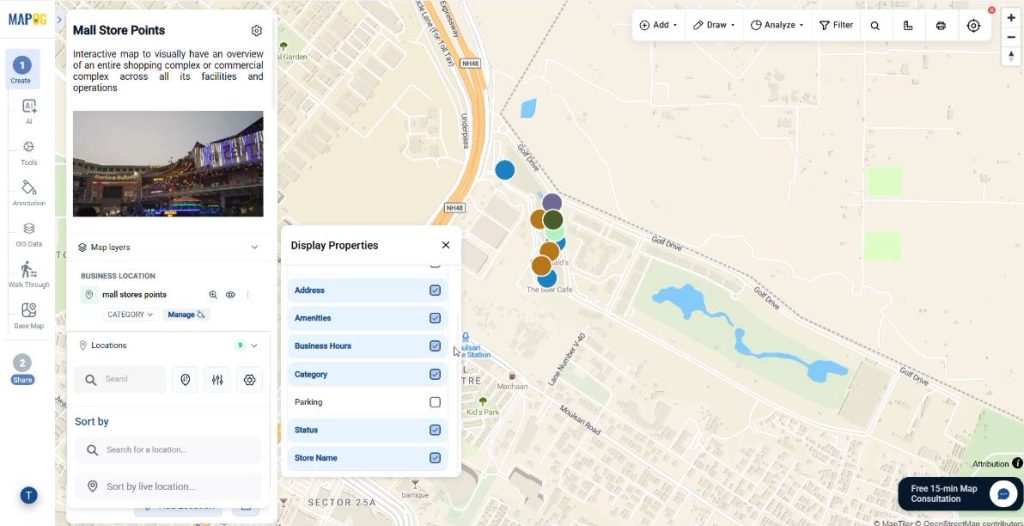
Next, use Display Properties to control information visibility by checking or unchecking specific attributes shown when clicking a location pin.
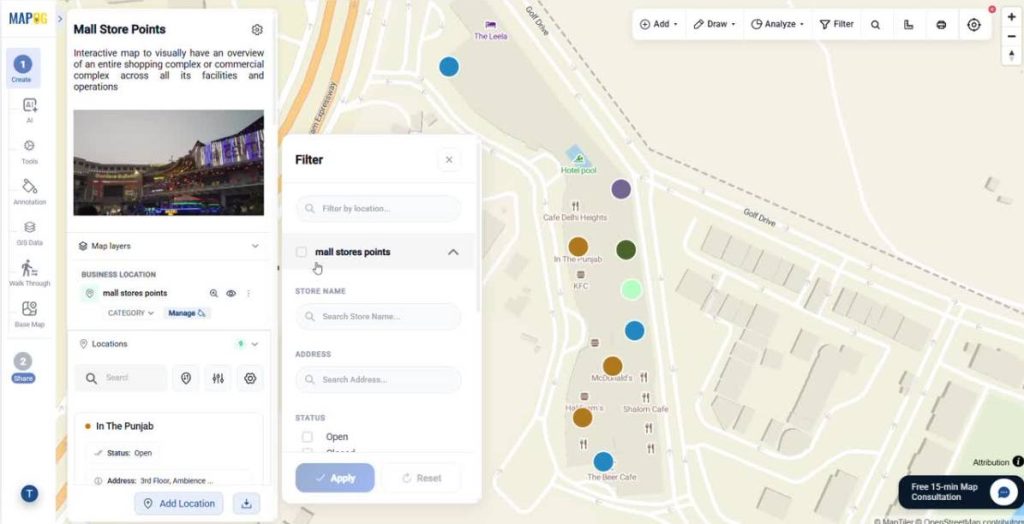
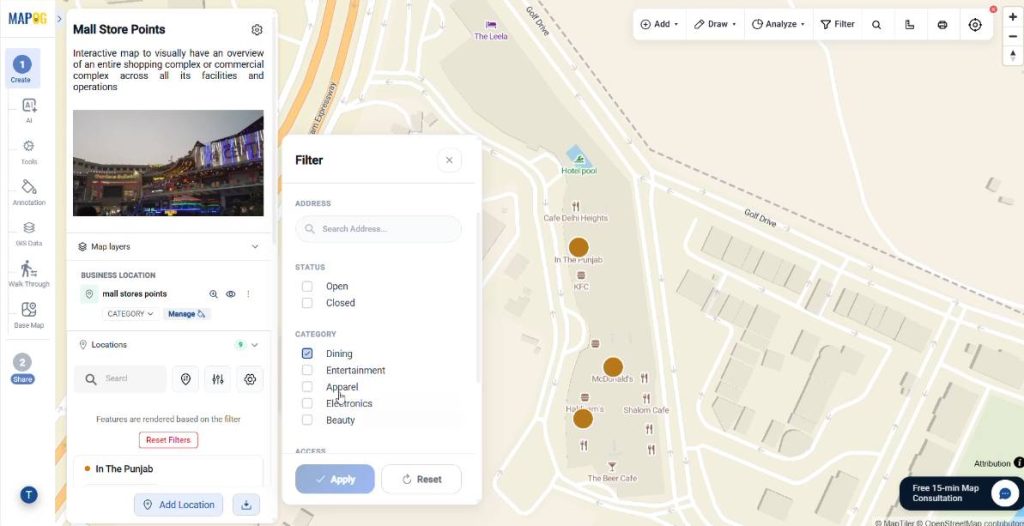
For day-to-day oversight, you can use the built-in Filter tool to isolate specific sectors – such as displaying only dining stores or tracking currently open stores – all with a single click.
Step 7: Preview and Share your Interactive Store Map
Once finalized, you can now head to the Preview and Share section to distribute your map based on your privacy needs. MAPOG lets you share your map both privately and publicly.
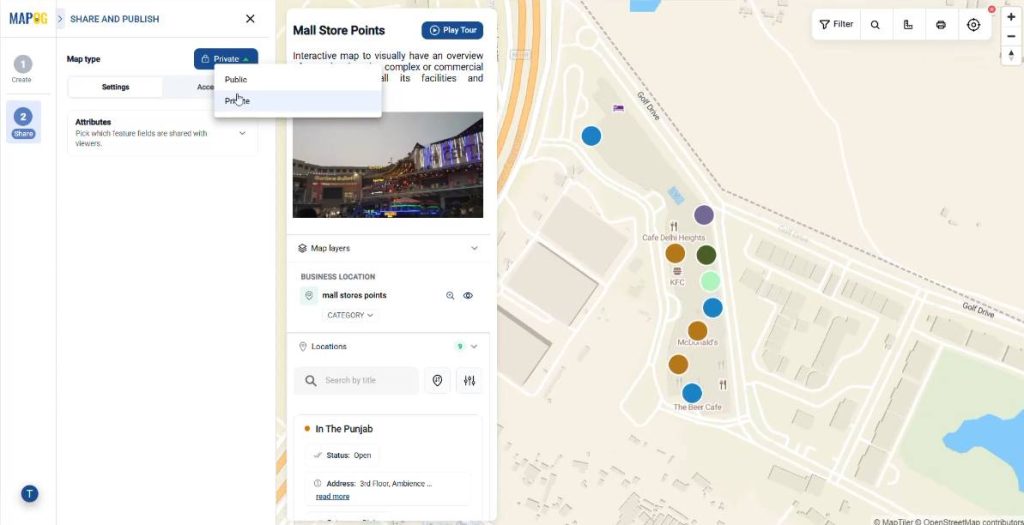
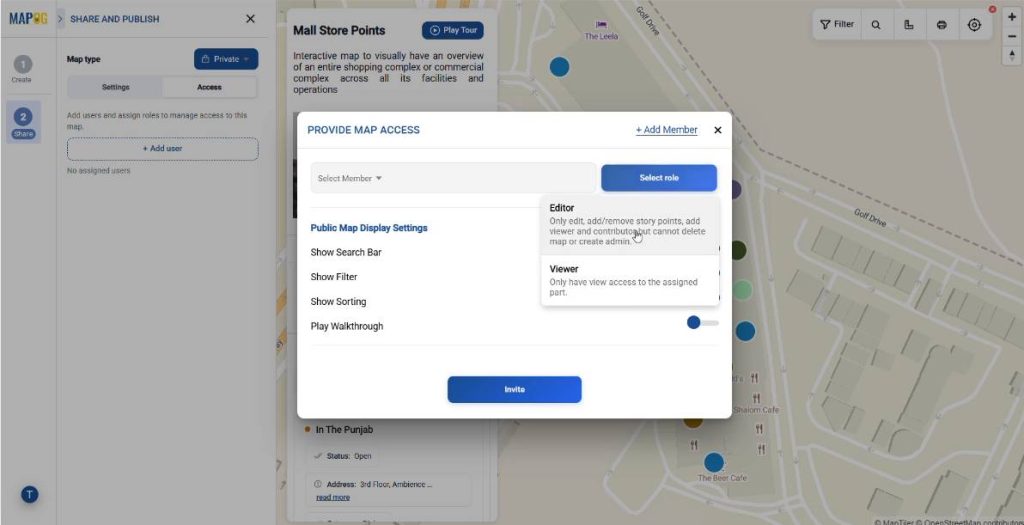
If you want to share your interactive multi store map privately, you can just assign team members, and give custom roles as Editors for operations or Viewers for executive reviews.
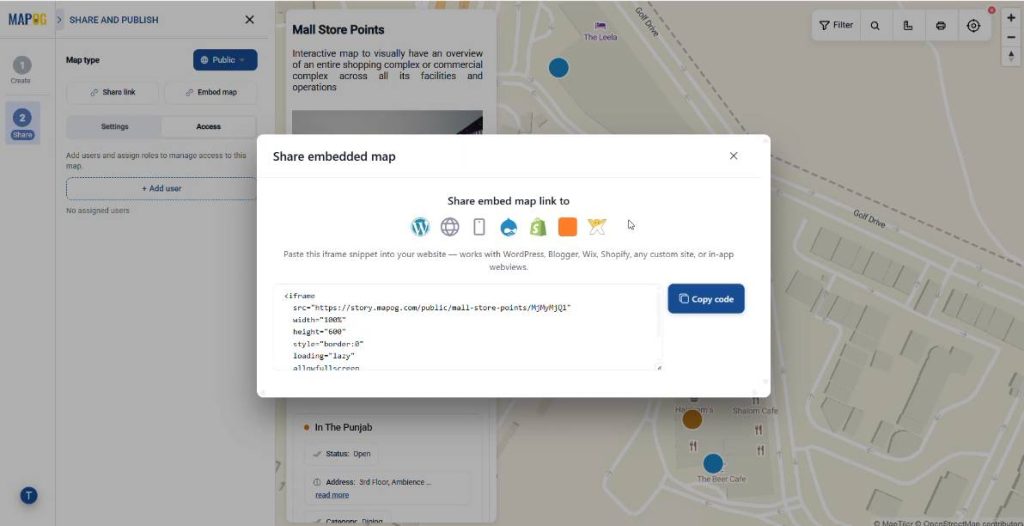
For sharing your interactive multi store map publicly, you can generate a responsive Embed Link to seamlessly display your interactive map on your company website or customer-facing mobile app.
Applications and Professional Benefits of Multi Store Operations Mapping
While highly effective for retail complexes, this spatial tracking strategy streamlines operations across multiple professional sectors:
- Commercial Real Estate: visually tracks lease timelines and instantly identifies vacancies for prospective clients.
- Logistics & Supply Chain: pinpoints distribution hubs to optimize transit routes and balance regional inventory.
- Franchise Operations: visualizes regional store performance and competitor proximity to safely plan expansion zones.
- Healthcare Facilities: maps complex hospital campuses to streamline equipment tracking and emergency response routing.
Conclusion
In modern multi-location business operations, data is abundant, but clarity is scarce. MAPOG replaces flat spreadsheets with interactive, location-intelligent, store maps, giving executives absolute spatial clarity to eliminate operations inefficiencies and unlock business growth.