Interactive maps do more than just visualize locations—they also store valuable data that can be exported, shared, and analyzed across multiple platforms. For instance, whether you’re tracking coffee shops, field points, real estate listings, or even survey data. MAPOG lets you download your mapped data layers in formats like CSV, XLS, JPG, KML, or SHP. As a result, your data is flexible and easy to use.
Key Concept of Data Exporting, Download Your Mapped Data
Exporting map data not only keeps your work versatile but also lets you reuse it across tools. In other words, you can export layers in your preferred format.
For example, you can export coffee shop locations as a CSV for Excel or alternatively as a KML for Google Earth. This way, your data stays flexible and accessible.
Process to Download Your Mapped Data
To begin with, here’s a simple yet effective step-by-step guide to help you easily export your map data from MAPOG.
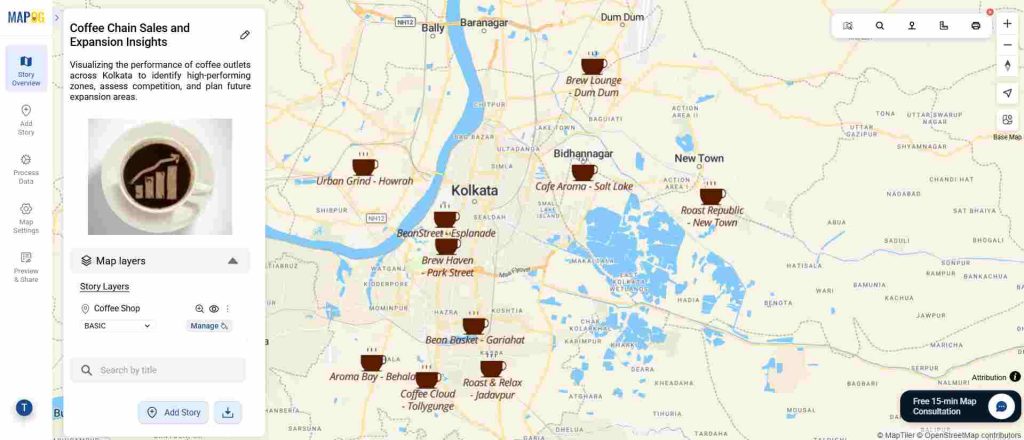
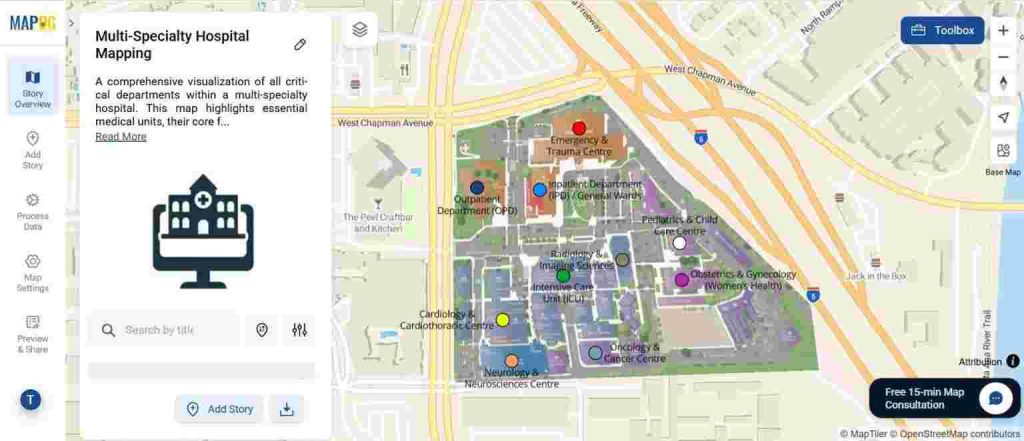
1. Create Your Interactive Map to Download Your Mapped Data
First of all, start by designing your interactive map in MAPOG. Next, add locations, layers, and relevant details—whether it’s store points, field observations, or even real estate listings.
2. Open the Style Menu
After that, once your map is ready, go to the Style Layer section of your map editor. Then, look for the three vertical dots (⋮) located next to your chosen layer’s name.
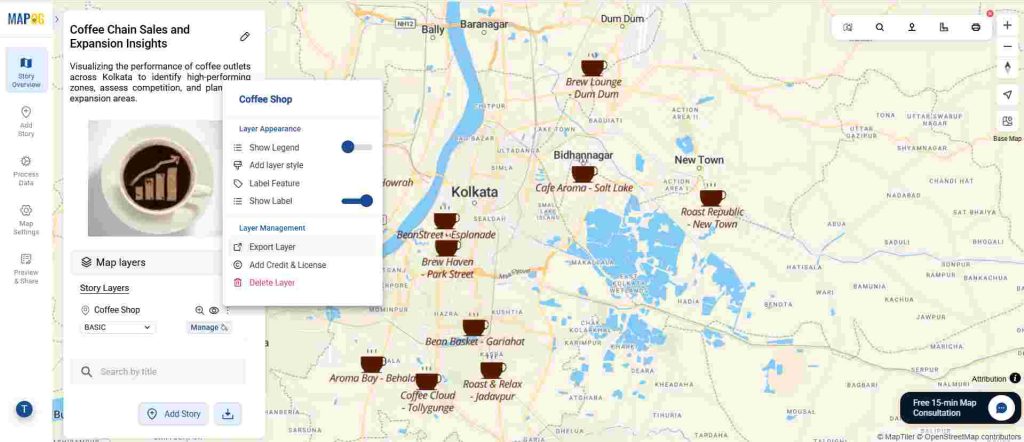
3. Right-Click and Select “Export Layer”
Next, right-click on the layer you want to download and choose Export Layer. Soon after, a dialog box will appear, giving you several options to manage your export settings.
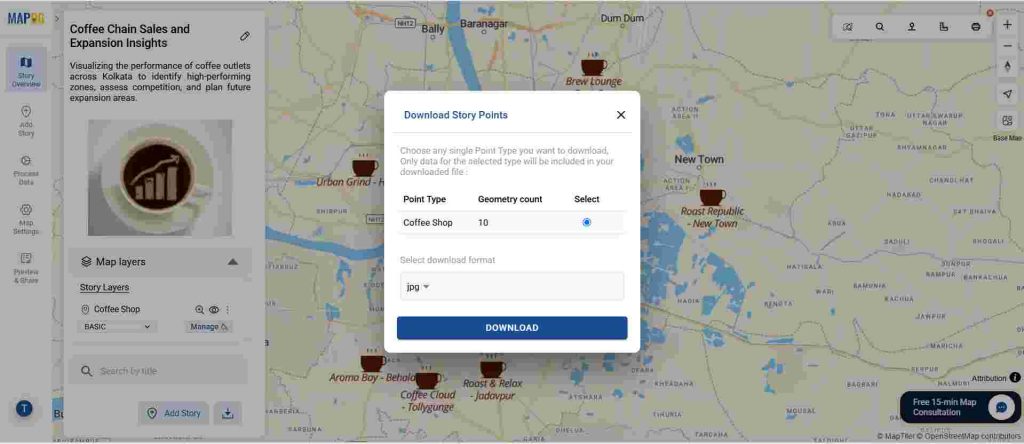
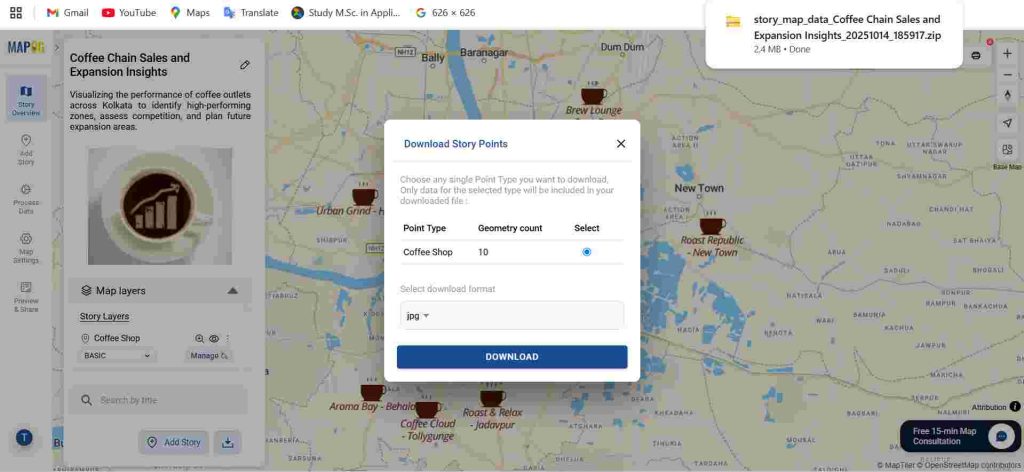
4. Choose the Layer(s) You Want to Export
At this stage, if your map contains multiple layers — for example, “Coffee Shops,” “Restaurants,” and “Parking Areas” — you can either select a single layer to download or choose multiple layers depending on what you need. This way, you have the flexibility to extract only the data that matters most to your task.
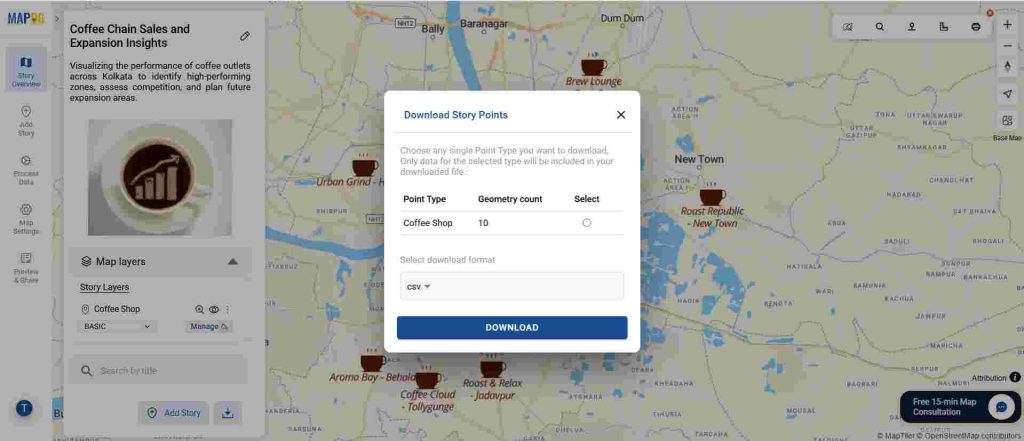
5. Select Your Preferred File Format
Furthermore, MAPOG supports many export formats—CSV, XLS, JPG, KML, SHP, including 15+ formats—giving users flexibility to manage and share data. Therefore, choose the format that best fits your project.
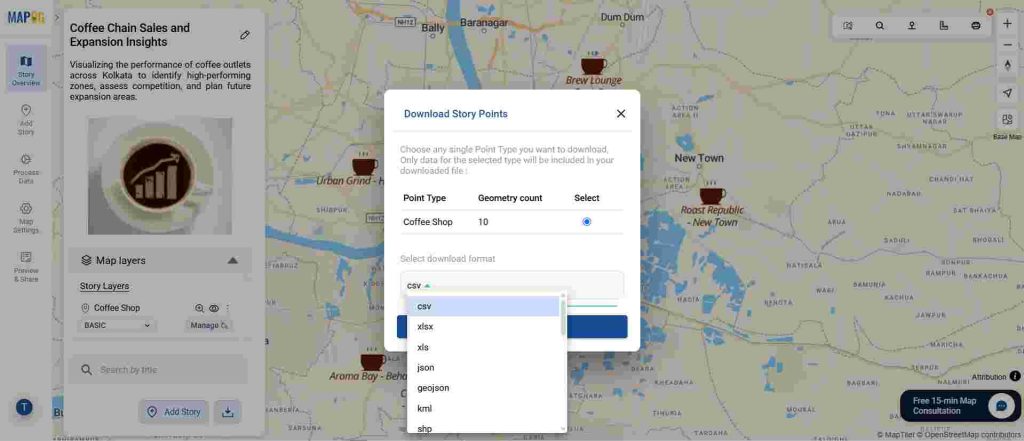
6. Click Download and Download Your Mapped Data
Finally, once you’ve selected your layers and export format, click Download. Immediately after, the file will automatically save to your device — making it ready for sharing, analysis, or even integration with other tools.

7. Export by Process Data
Another way to export your file or map is by clicking on Process Data, and then selecting the Exporting Tool.
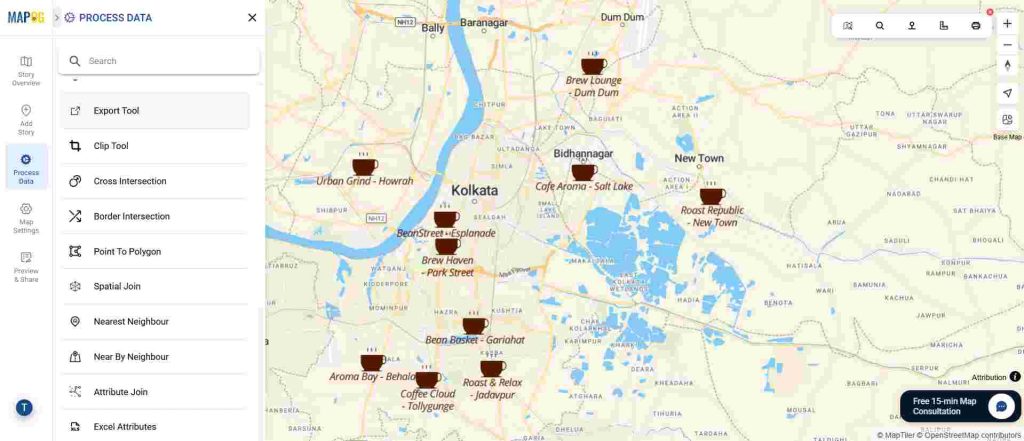
From there, choose the desired layer you want to export.
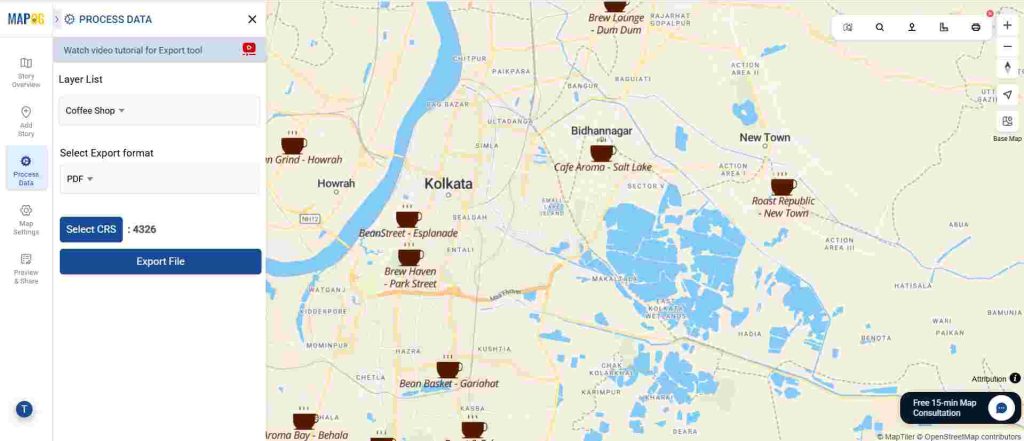
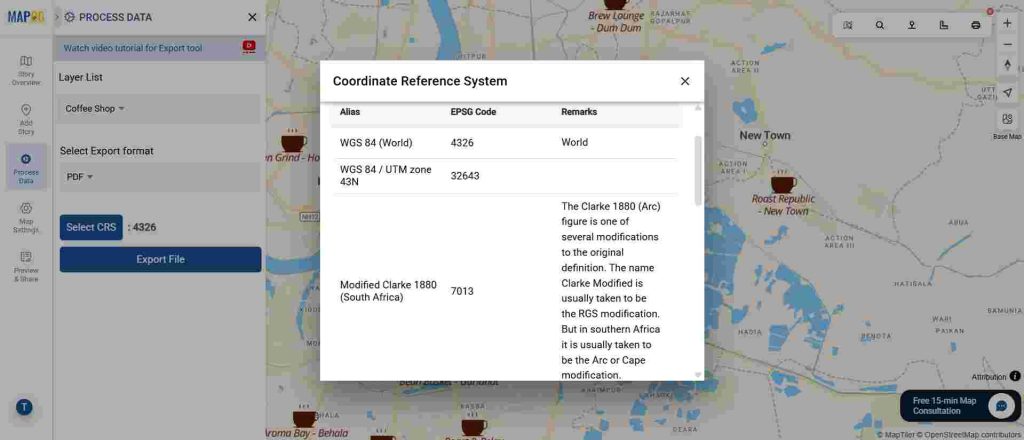
Next, select the file type you prefer, after that pick the CRS (Coordinate Reference System), and finally, click Export to complete the process.
Why Exporting Matters
Overall, exporting your mapped data makes it easier to share insights, analyze patterns, back up work, and integrate into larger workflows. As a result, it transforms your map into a versatile, multi-purpose dataset.
In terms of practical applications, exporting map data benefits various users:
- For Urban Planners: Export zoning maps to efficiently create policy reports.
- For Researchers: Download field sample locations so that spatial analysis is easier.
- For Retail Businesses: Export store networks in order to track performance.
- For Event Organizers: Share venue maps to facilitate better planning.
Ultimately, data export keeps your mapping workflow seamless and efficient.
Want to Create Your Own Interactive Map First?
Before exporting, you can easily design and customize your map using MAPOG’s map creation tools.
🔗 Learn How to Create an Interactive Map in MAPOG
Final Thought
In conclusion, downloading mapped data from MAPOG gives you full control over your information. Moreover, with just a few clicks, your map becomes a powerful, shareable, and analyzable dataset.