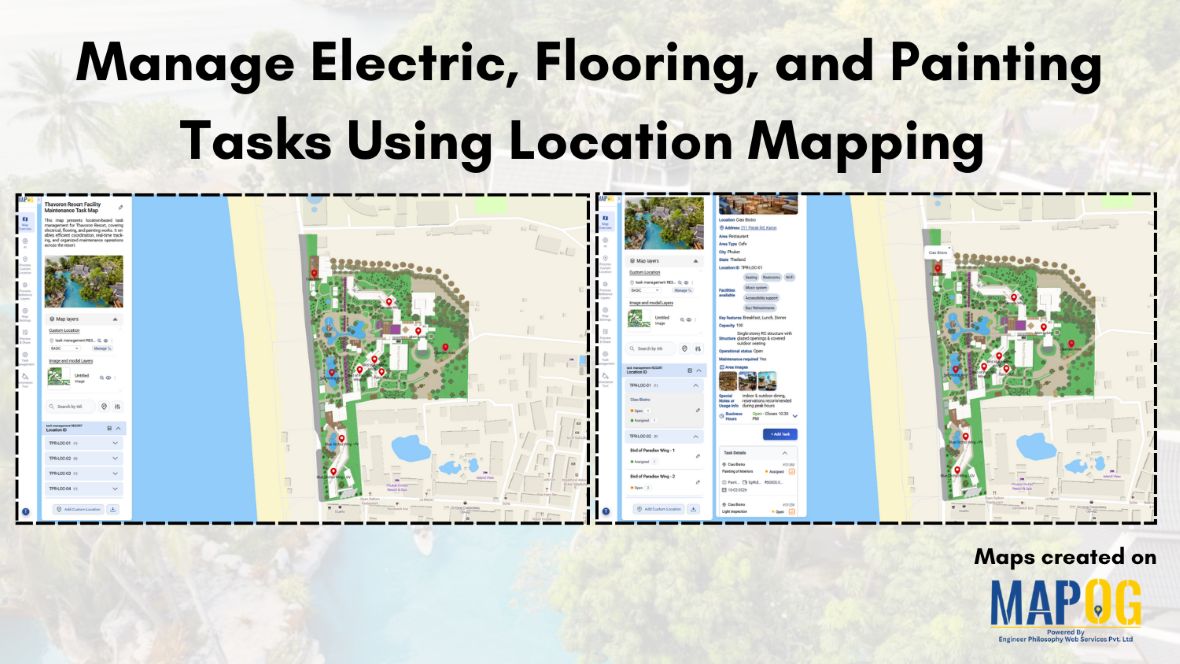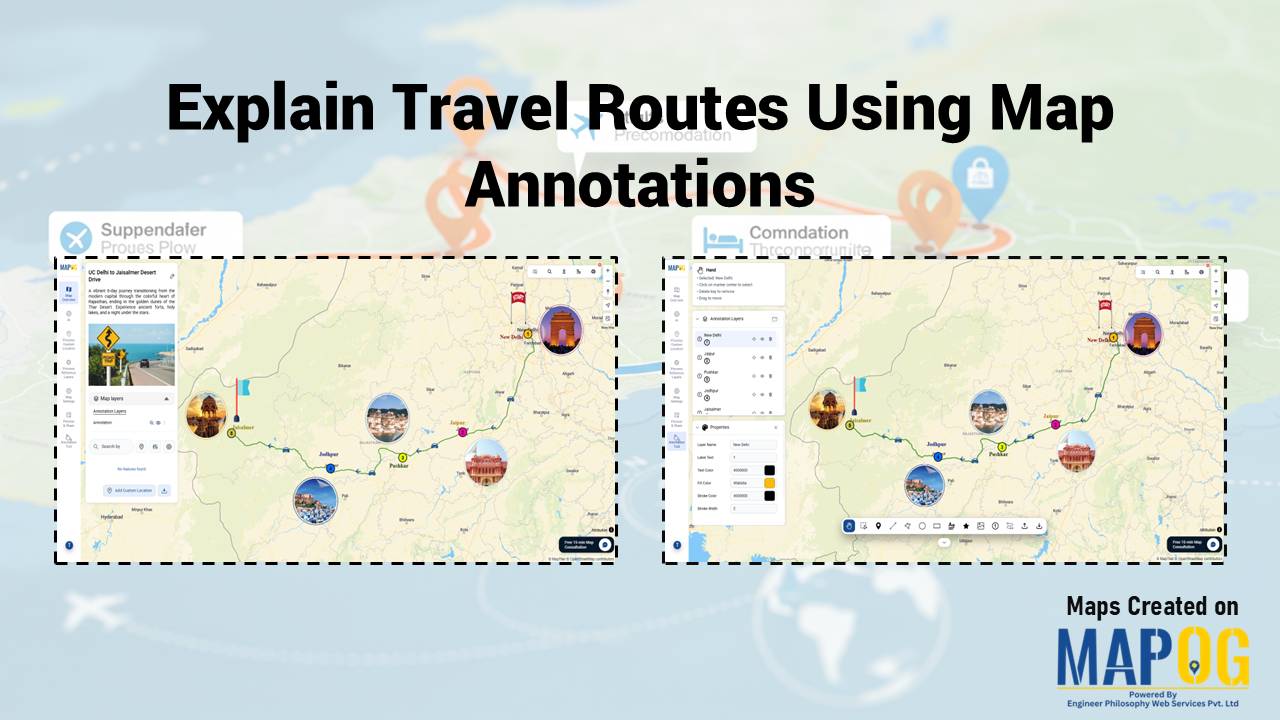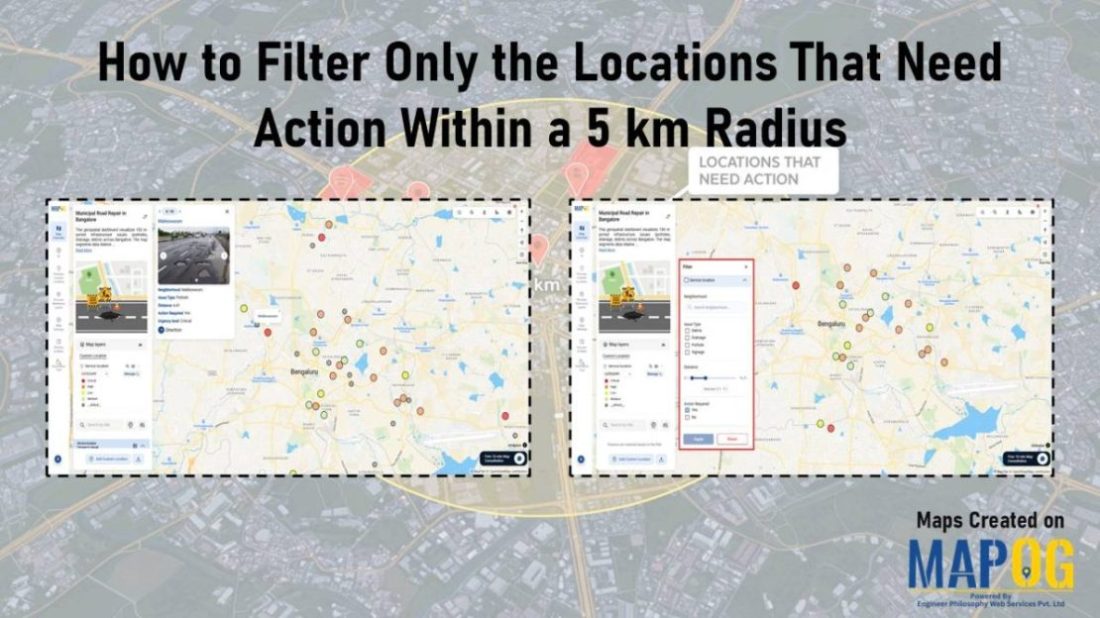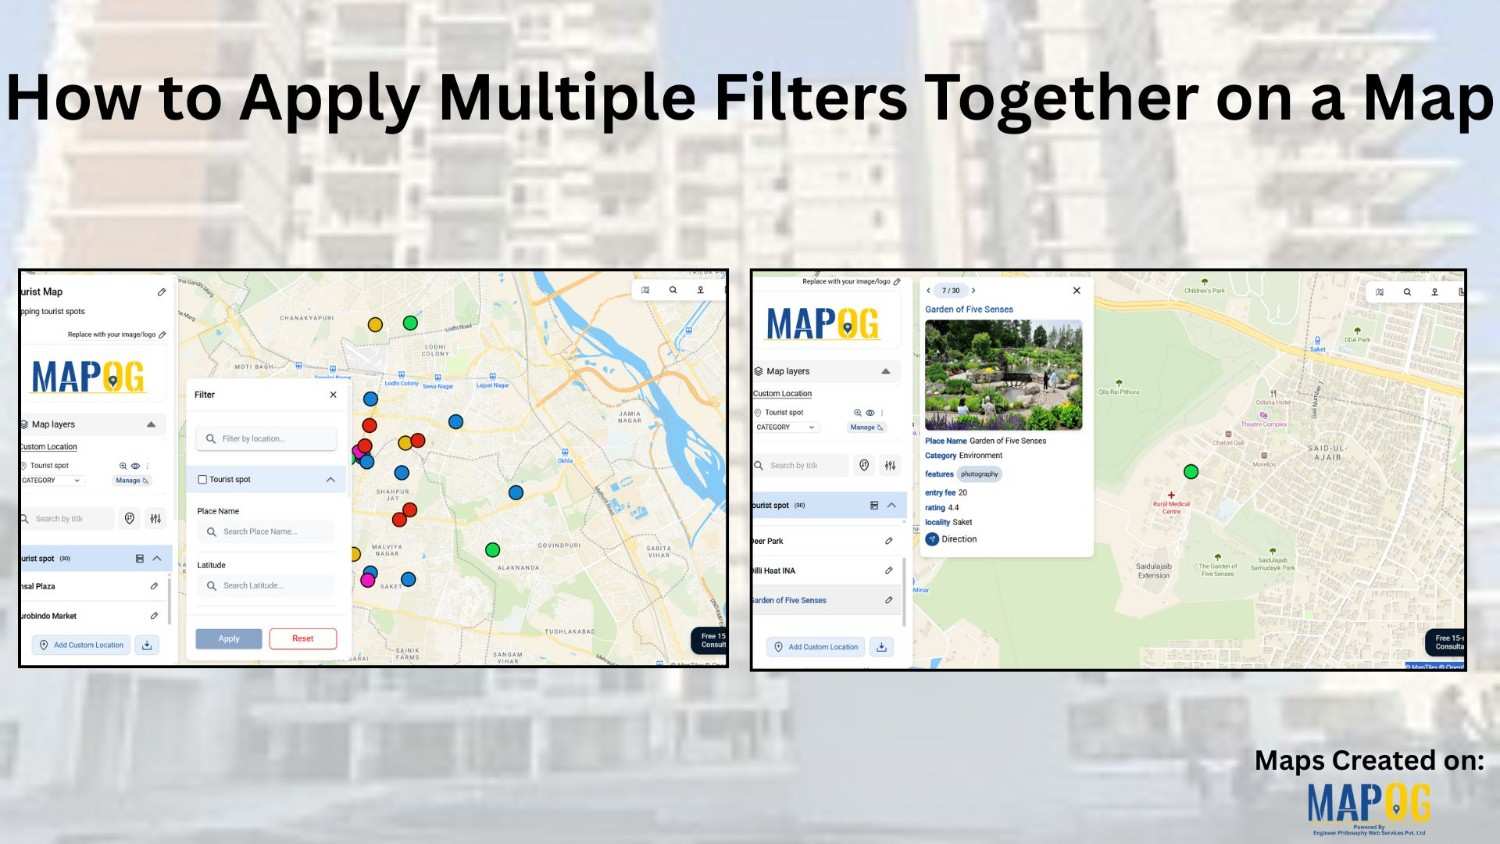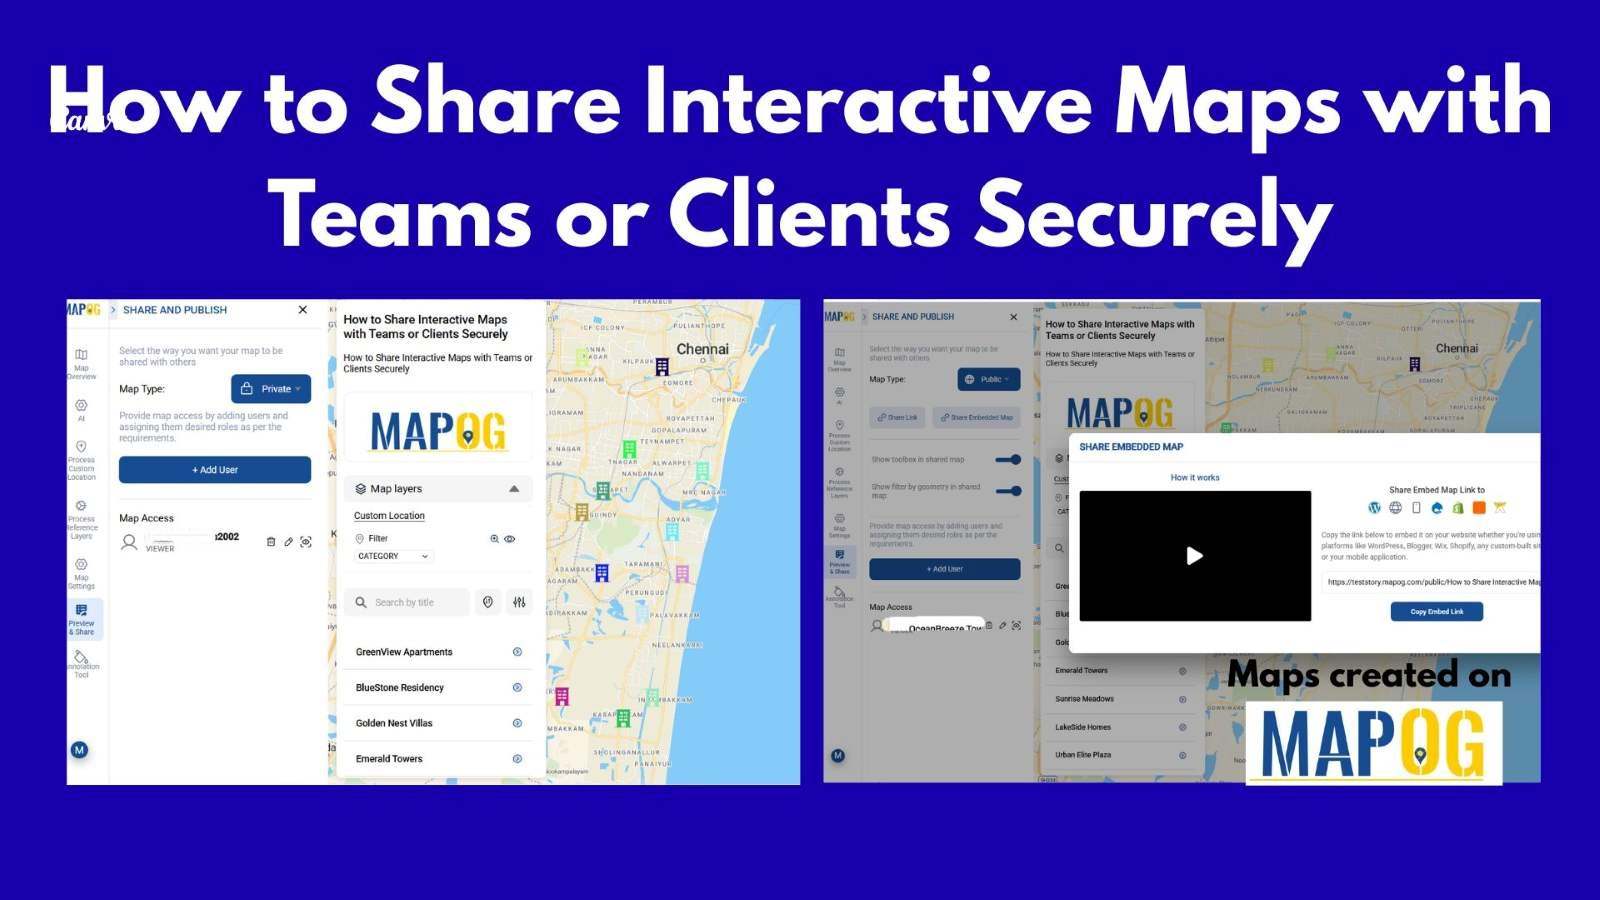
How to Assign and Track Field Tasks on a Map in Real Time
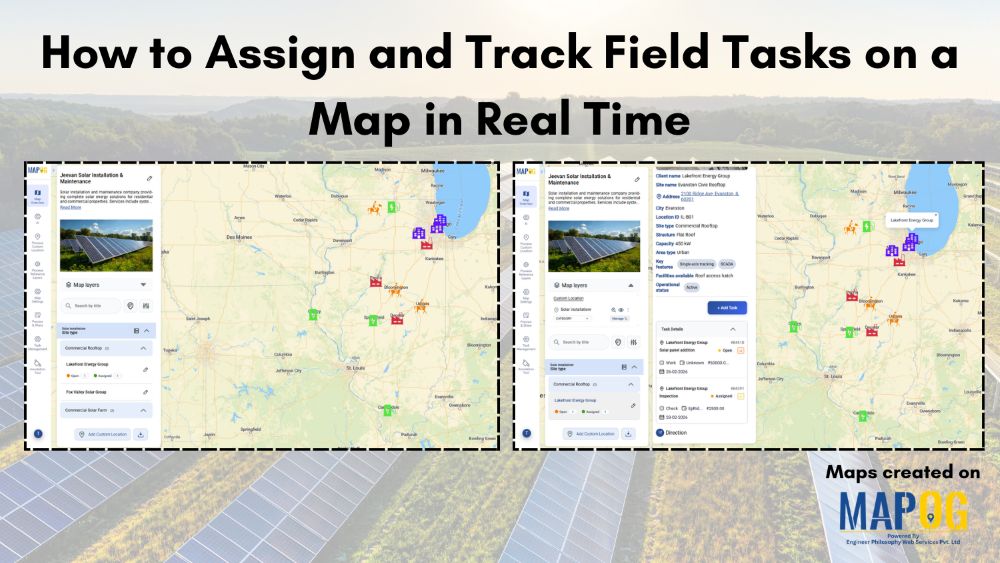
In solar installation and asset management, limited real-time visibility and fragmented field coordination quietly erode margins, delay projects, and compromise system performance. With MAPOG, you can have a real-time map which helps assign and track field tasks by linking work orders to precise locations, allowing managers to dispatch technicians based on proximity and monitoring job progress … Read more