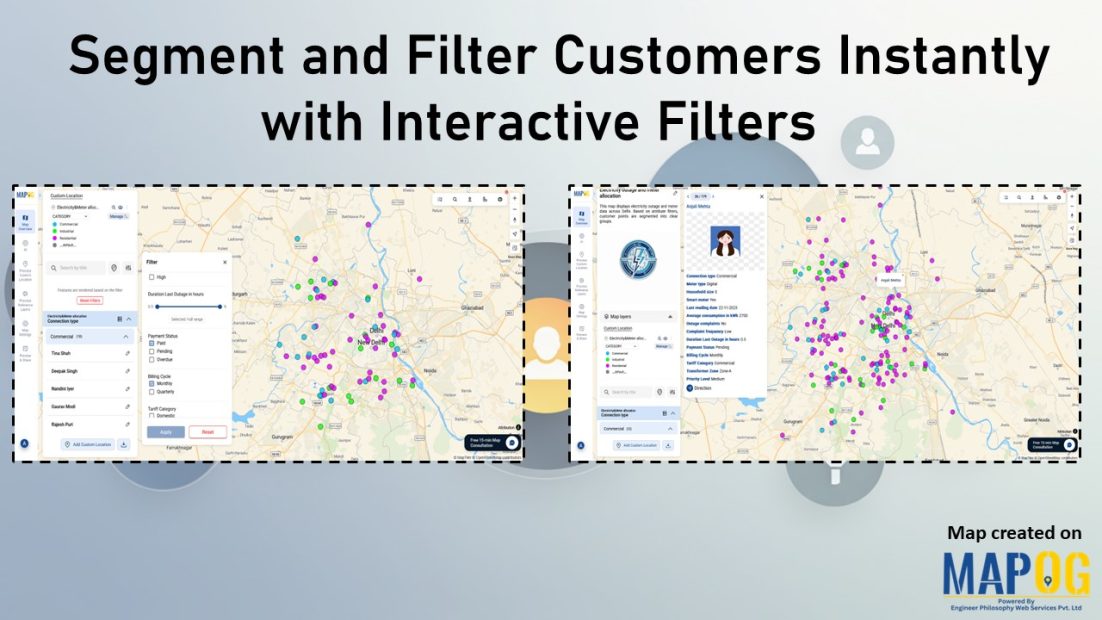
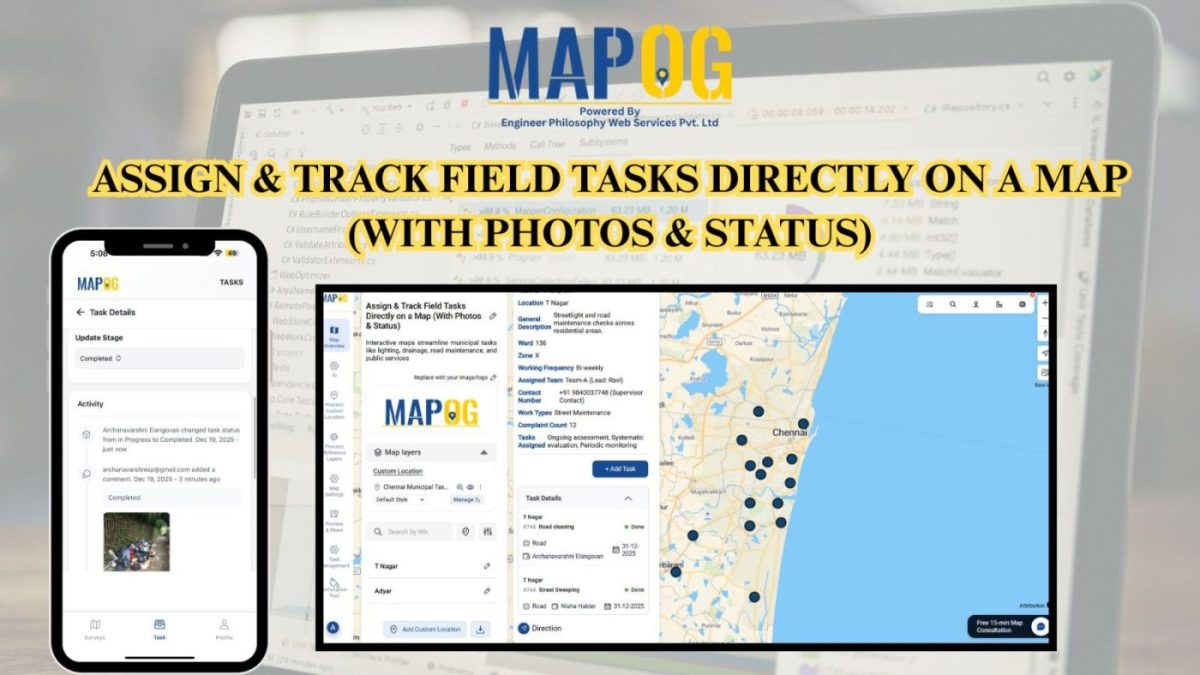
Smart Mapping

cover image

Color-Code Your Customers by Purchase Behavior on a Map

In today’s data-driven retail world, every customer leaves behind a digital footprint — where they live, how often they buy, and how much they spend. Yet, even with this information it can be difficult to decipher the bigger picture or understand where your most valuable customers actually come from. That’s why visualizing customer data matters. … Read more

Map-based insights showing customer clustering and store coverage for hotspot detection.

How to Use Map-Based Insights to Identify New Customer Hotspots

In fast-changing markets, the real challenge isn’t gathering data, it’s knowing where demand is quietly building. Many teams still rely on static reports and broad assumptions, which often miss the early signals of emerging customer interest. As a result, high-potential areas go unnoticed while resources stay concentrated in familiar zones. That’s why it’s important to … Read more

Image showing customer coverage map across multiple branches using colored pins and branch-level data.

How to Compare Customer Coverage Across Multiple Branches

When managing multiple branches, one persistent challenge is the lack of clarity around how customer coverage compares from one location to another. As a result, teams often struggle to make informed decisions. Without a structured way to compare customer coverage across multiple branches, they may rely on assumptions rather than spatial evidence. MAPOG helps solve … Read more

Cover image with article title and MAPOG screenshots showing customer location assignments to field teams.

How to Assign Customer Locations to Field Teams for Surveys

Efficient field surveys start with a clear plan, so you need a simple and accurate way to assign customer locations to field teams. When each member knows where to go, your operations move faster, data quality improves, and field time decreases. This structured approach strengthens tracking, balances workloads, and improves coverage. You can manage all … Read more

Featured image Export or Share Your Customer Maps Securely with Your Team

Export or Share Your Customer Maps Securely with Your Team

Sharing customer maps is essential for effective collaboration and decision-making when your business relies on location-based client data. With MAPOG, you can export or share customer maps showing client locations, sales regions, or service zones. Furthermore, this keeps sensitive data secure through robust permission settings and controlled access management. Key concepts: Export or Share Customer … Read more

visualize customer segments

Visualize Different Customer Segments in Different Colors on a Map

Every retail company wants to know where their customers are and how much they spend. Yet, in a busy city, even with full address data, spotting spending patterns can be difficult. High, medium and low-value customers are often scattered, making it hard to plan effectively. As a result, strategic decisions such as store expansion, marketing … Read more

Identify High-Density Customer Areas

How to Identify High-Density Customer Areas Using Interactive Maps

In every business, understanding where your customers truly come from can completely transform your growth strategy. Moreover, when you Identify High-Density Customer Areas, it becomes easier to plan expansion, target marketing efforts, and optimize logistics efficiently. For instance, imagine having a store in one area where only 20% of your customers are local, yet 80% … Read more

analyze customer distribution

How to Analyze Customer Distribution Using Map Layers

In today’s competitive market, businesses thrive when they analyze customer distribution effectively. Therefore, understanding where your customers come from, how frequently they purchase, and how their spending patterns vary across regions becomes crucial. Moreover, this insight helps you make smarter sales and marketing decisions. Fortunately, interactive mapping with MAPOG simplifies this process even further, allowing … Read more

Switch Between Map Styles

Switch Between Map Styles to View Customer Trends, Hotspots & Spending Patterns

Transform raw data into interactive visuals showing customer locations, spending, and trends. Furthermore, Switch Between Map Styles reveals interactive map insights like top buyers, regional demand, and performance gaps, enabling faster, data-driven decisions without coding. Key Concept: Switch Between Map Styles However, by smoothly Switch map styles, you can easily explore one dataset from multiple … Read more

Share Private and Public Maps

How to Share Private and Public Maps Securely

Sharing maps is essential in modern digital workflows. For example, professionals in planning, logistics, and research use map sharing tools every day to collaborate and make data-driven decisions. MAPOG makes this process simple and secure by allowing users to control visibility and access. However, it’s important to know how to share private and public maps … Read more