Smart Mapping

How to Map and Monitor Franchise Locations

How to Map and Monitor Franchise Locations in One View

Map and Monitor Franchise Locations, scattered records hinder outlet tracking. MAPOG centralizes data into interactive maps, enhancing location visibility, monitoring, regional insights, and faster, spatially informed decision-making. Key Concept: Map and Monitor Franchise Locations Franchise location maps help track store locations, monitor performance, manage site visits, coordinate teams, compare regional results, and support reporting. This improves … Read more

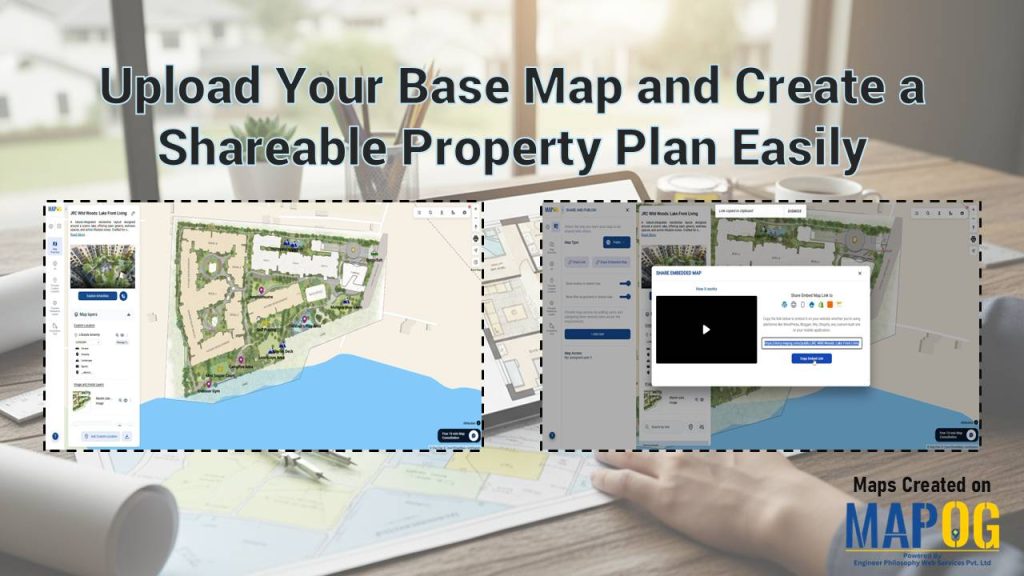
Shows features like geo-referencing layout image and adding attribute details for creating an interactive campus map for real estate projects.

Create an Interactive Campus Map for Real Estate Projects

Modern real estate developments such as campuses, townships, and estates involve many buildings and amenities. However, they are still shown through static layouts or spreadsheets, which fragment information and hinder navigation. Therefore, MAPOG resolves these challenges by enabling an interactive campus map for real estate projects that combines geo-referenced layouts, structured attributes, indicators, and filters. … Read more

Interface showing how to download the you mapped data in different formats and different ways.

How to download the you mapped data in different formats

In geospatial projects, one of the biggest hurdles is data lock‑in. Often, mapping platforms restrict downloads to limited formats, forcing teams to spend extra time converting files or risking the loss of important attributes. Consequently, collaboration slows and efficiency drops. MAPOG addresses this challenge by making it simple to download mapped data in a format … Read more

Map interface showing cycling route across the UK with breakpoints, photos, and text annotations.

How to Map Your Complete Cycling Journey with Breakpoints, Photos & Route Lines

Many cyclists struggle to preserve their journeys because GPS tracks, photos, and notes often end up scattered across different apps; as a result, breakpoints lose context, memories fade, and sharing becomes fragmented. However, when you map your complete cycling journey with MAPOG, everything comes together, routes, breakpoints, photos, and reflections; into one interactive storytelling map … Read more

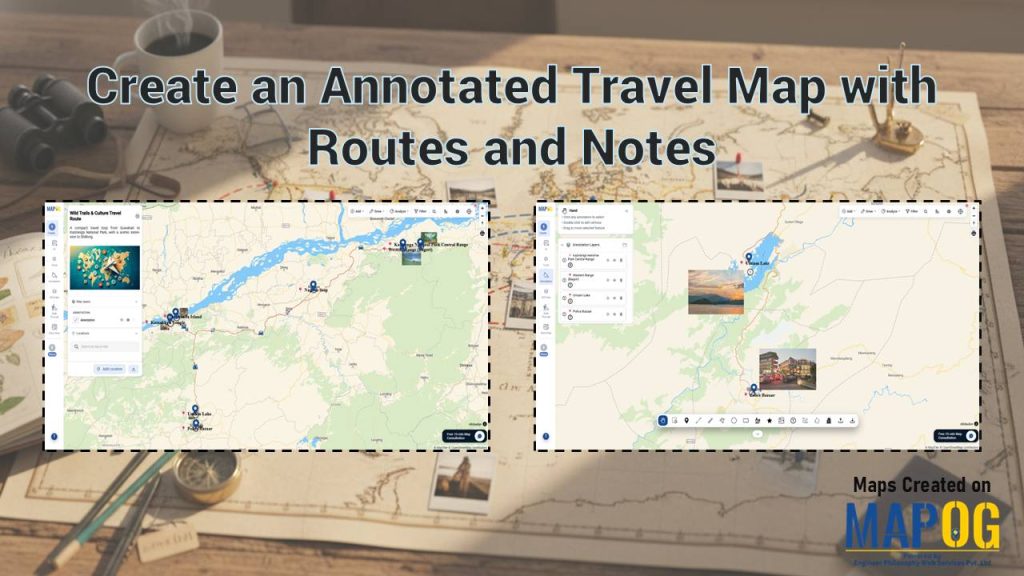
Cover image showing annotated travel routes.

How to Explain Travel Routes Using Map Annotations

Travel agencies struggle to present complex itineraries because raw GPS tracks and scattered notes often confuse tourists. Consequently, travelers lose context, and memories fade into fragmented data. However, businesses now Explain Travel Routes Using these Travel Maps to transform these fragments into interactive experiences. By using the MAPOG’s Map annotation tool, travel professionals weave routes, … Read more

Dashboard view demonstrating how to Filter Only the Locations That Need Action within a 5 km radius on a map using proximity and status-based filters.

How to Filter Only the Locations That Need Action Within a 5 km Radius

Managing multiple locations efficiently becomes challenging when you need to identify which sites require immediate attention. MAPOG‘s dynamic filtering system helps businesses streamline operations by pinpointing critical locations within specific geographic boundaries. Learning how to filter only the locations that need action within a 5 km radius transforms scattered data into actionable insights. Key Concept: … Read more

Capture Drug Inspection Data

Capture Drug Inspection Data and Photos from the Field

Capture Drug Inspection Data efficiently is no longer optional—especially when inspections happen across multiple locations and teams. Today, field teams need a reliable way to collect store details, verify compliance, and upload photos in real time. With MAPOG’s Mobile Data Collection and the MAPOG Contributor App, we can plan drug inspections, assigned, captured, and reviewed … Read more

Use Filters to View Only the Data You Need on Your Map

Use Filters to View Only the Data You Need on Your Map

Using filters to view only the data you need on your map is one of the most effective ways to turn complex location datasets into clear, actionable insights. Instead of navigating through cluttered points, filters help you spotlight the information that truly matters, whether it’s by category, status, rating, or any other attribute. This focused … Read more

Turning Your Trip Plan

Turning Your Trip Plan into a Smart Travel Map: Adding Routes, Images & Days

Turning your trip plan into something visual, organized, and interactive is no longer complicated. Instead of juggling notes, screenshots, and lists, a smart travel map helps your journey unfold day by day on a single canvas. With MAPOG and its powerful Annotation features, trip planning is not only simplified but also made visually engaging. As … Read more

MAPOG interface showing tools to Filter Your Map Data by attributes for smarter location and site selection.

How to Filter Your Map Data by Any Attribute or Field

Modern planning teams operate in environments where speed, accuracy, and clarity directly influence outcomes. Consequently, the ability to filter your map data by any attribute becomes a core strategic skill. In high-growth sectors like EV infrastructure, teams often evaluate hundreds of potential locations before selecting only a few high-impact sites. While this process traditionally demands … Read more