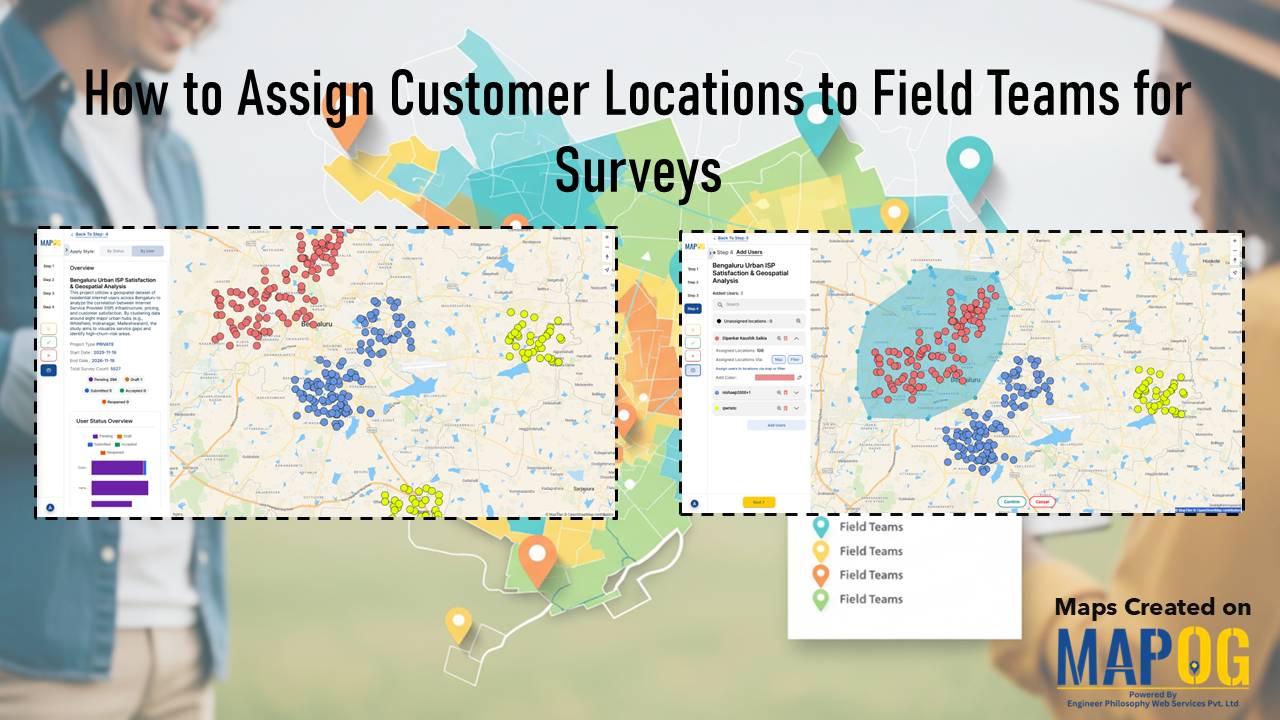
Land Price Mapping: GIS-Based Visualization for Real Estate Insights
Adding an area’s vector data – incorporate quantity style – show the different land prices in that area – Easily interpret with legend.
In today’s data-driven world, maps are no longer just tools for navigation, they are powerful instruments for analysing patterns, making informed decisions, and solving complex problems. Whether Tracking Population and Literacy Data Attribute , Thematic Mapping for Data Analysis or a researcher visualising data, MAPOG is your go-to platform for creating professional, insightful maps. In … Read more
Dive into the world of Disability Population Heat Map Analysis, where advanced mapping techniques provide district-wise insights with ease. By leveraging heat maps, we simplify complex data interpretation, offering a clear visual representation of disability distribution. This approach empowers policymakers, urban planners, and organizations to make informed decisions for improved accessibility and resource allocation. Explore … Read more
GIS optimizes supply chains and logistics by enabling precise route planning, fleet tracking, warehouse Site Selection, Demand Forecasting, and Risk Assessment. It enhances inventory management, facilitating warehouse location selection, reduces transportation costs, improves delivery efficiency, and supports data-driven decision-making, ensuring streamlined operations, better resource utilisation, and improved customer satisfaction across supply networks. Key Concept in … Read more
GIS plays a vital role in irrigation planning and water resource management by optimising site selection, assessing water demand, designing irrigation networks, and analysing crop suitability. Additionally, it enhances decision-making through spatial analysis, monitors water distribution, prevents water logging, and integrates data for sustainable and efficient water resource utilisation. Key Concept in Monitoring GIS in … Read more
GIS plays a crucial role in air quality monitoring and pollution control. It maps sources, tracks emissions, and Identifies Hotspots for better decision-making. GIS supports in Air Quality mapping, Urban Planning, Evaluates Control Measures, and helps reduce key pollutants like PM, NOx, SO2, CO, O3, and VOCs through technology and regulations, promoting sustainability. Key Concept … Read more
In today’s rapidly evolving urban landscapes, GIS for Smart City Planning plays a crucial role in building efficient, livable, and sustainable environments. By leveraging GIS in urban planning, city authorities can effectively manage traffic congestion, design accessible green spaces, and streamline infrastructure development. Geographic Information Systems empower planners with data-driven insights, helping them transform challenges … Read more
Planning a trip can be one of the most exciting yet overwhelming tasks. With multiple locations to visit, and routes to plan, having everything in one place can make all the difference. That’s where a tourist itinerary map comes in handy! Instead of juggling multiple travel apps and notes, you can organize your entire trip … Read more
Start a historical trail with MAPSTORY and follow the route and importance of “Gandhi’s Dandi Aviyan: A Path to Freedom with MAPSTORY” a critical event in the fight for India’s independence. Use MAPOG’s immersive mapping technology to explore the route and the significance of this historical march. Key Concepts This is a way to digitally … Read more
Interactive maps are powerful tools for visualizing data in a way that’s easy to understand and engaging. Style Maps by Categories or Quantities in MAPOG allows you to highlight trends, differences, and relationships effectively. Whether you’re mapping demographic data, business insights, or geographical patterns, the ability to customize styles is crucial for making your data … Read more