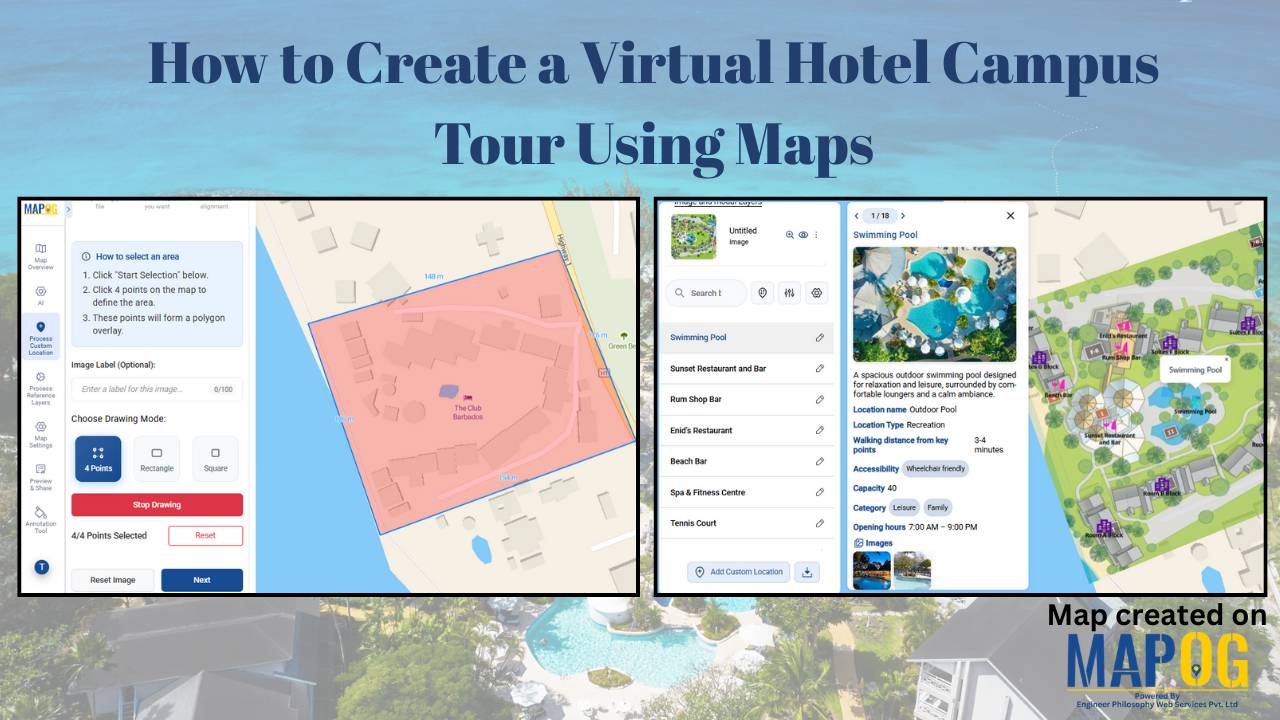
Category Filters

Dashboard view demonstrating how to Filter Only the Locations That Need Action within a 5 km radius on a map using proximity and status-based filters.

How to Filter Only the Locations That Need Action Within a 5 km Radius

Managing multiple locations efficiently becomes challenging when you need to identify which sites require immediate attention. MAPOG‘s dynamic filtering system helps businesses streamline operations by pinpointing critical locations within specific geographic boundaries. Learning how to filter only the locations that need action within a 5 km radius transforms scattered data into actionable insights. Key Concept: … Read more

visualize the franchise covergae for a bakery outlet

Visualize Franchise Coverage Using Interactive Maps

Running a franchise business is no longer just about opening outlets in multiple cities. Instead, it is about understanding where your outlets are located, how they perform, and which areas remain untapped. This is where interactive maps play a crucial role. Visualize  franchise coverage on a map, businesses can instantly see location patterns, service reach, … Read more

how to apply multiple filters

How to Apply Multiple Filters Together on a Map

When you work with location-heavy data, simply placing points on a map is not enough. You need a way to apply multiple filters on map , compare categories, and instantly highlight visuals that matter. That is why applying multiple filters together on a map becomes so powerful. It helps you narrow down results, spot patterns … Read more

Filter Properties for Insights

How Developers Use Filters to Visualize Properties by Price, Type & Status

In today’s real estate tech landscape, clarity and precision in data visualization are essential for smarter property decisions. Simply listing properties isn’t enough-you need a way to slice, sort, and understand them instantly. That’s where Interactive filters come in. By Filter Properties for Insights based on price range, property type, and availability status, maps become … Read more

Use Filters to View Only the Data You Need on Your Map

Use Filters to View Only the Data You Need on Your Map

Using filters to view only the data you need on your map is one of the most effective ways to turn complex location datasets into clear, actionable insights. Instead of navigating through cluttered points, filters help you spotlight the information that truly matters, whether it’s by category, status, rating, or any other attribute. This focused … Read more

MAPOG interface showing tools to Filter Your Map Data by attributes for smarter location and site selection.

How to Filter Your Map Data by Any Attribute or Field

Modern planning teams operate in environments where speed, accuracy, and clarity directly influence outcomes. Consequently, the ability to filter your map data by any attribute becomes a core strategic skill. In high-growth sectors like EV infrastructure, teams often evaluate hundreds of potential locations before selecting only a few high-impact sites. While this process traditionally demands … Read more

Visualize Field Office

How to Visualize Field Office & Community Coverage on a Map

To visualize field office coverage, organizations increasingly rely on maps because they present operational data clearly and quickly. Instead of managing scattered spreadsheets, you can see how field offices and communities connect spatially. Moreover, when coverage areas are visualized together, planning gaps become obvious. Using MAPOG, which support Excel uploads, GIS Data, and custom location … Read more

sales area

How to Spot High and Low Sales Areas Using Interactive Maps

When businesses work with sales data spread across multiple locations, spreadsheets alone often fail to reveal meaningful insights. Simply listing numbers does not clearly show where performance is strong or weak. That is why MAPOG  plays a crucial role in sales  visuals . By visualizing sales data geographically, you can instantly high and low sales … Read more

Filter Map Points

Filter Map Points by Attribute Values (From Excel/CSV)

When working with large datasets on a map, it can be difficult to focus on only the information you need. By filtering map points using attribute values stored in an Excel or CSV file, you can quickly highlight specific categories, ranges, or conditions—such as cities above a certain population, demographics, or locations with active status. … Read more

Interface showing customer data points segmented and filtered instantly using dynamic filters, with color-coded clusters for real-time insights

Segment and Filter Customers Instantly with Interactive Filters

Most teams already have customer data, but the way it’s managed often hides the details that matter. Consequently, diverse attributes collapse into uniform rows, obscuring meaningful distinctions. As a result, strategies become generic, and critical signals stay hidden. However, static reports flatten complexity, leaving no room for precision. With MAPOG, teams can segment and filter … Read more