Category Filters

Cover image Location-based dashboard to manage housekeeping tasks across hotel rooms.

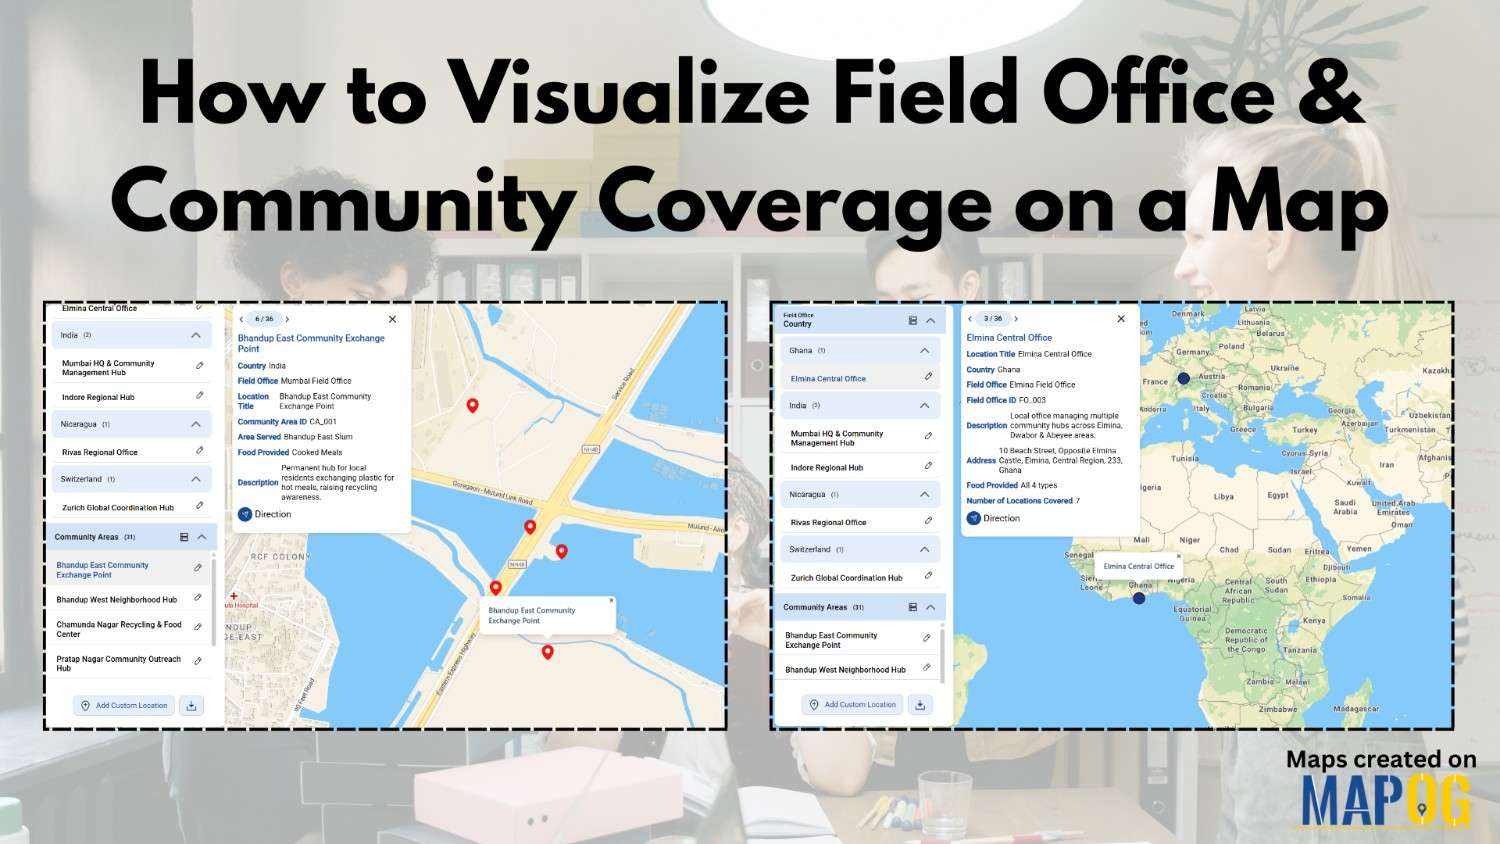
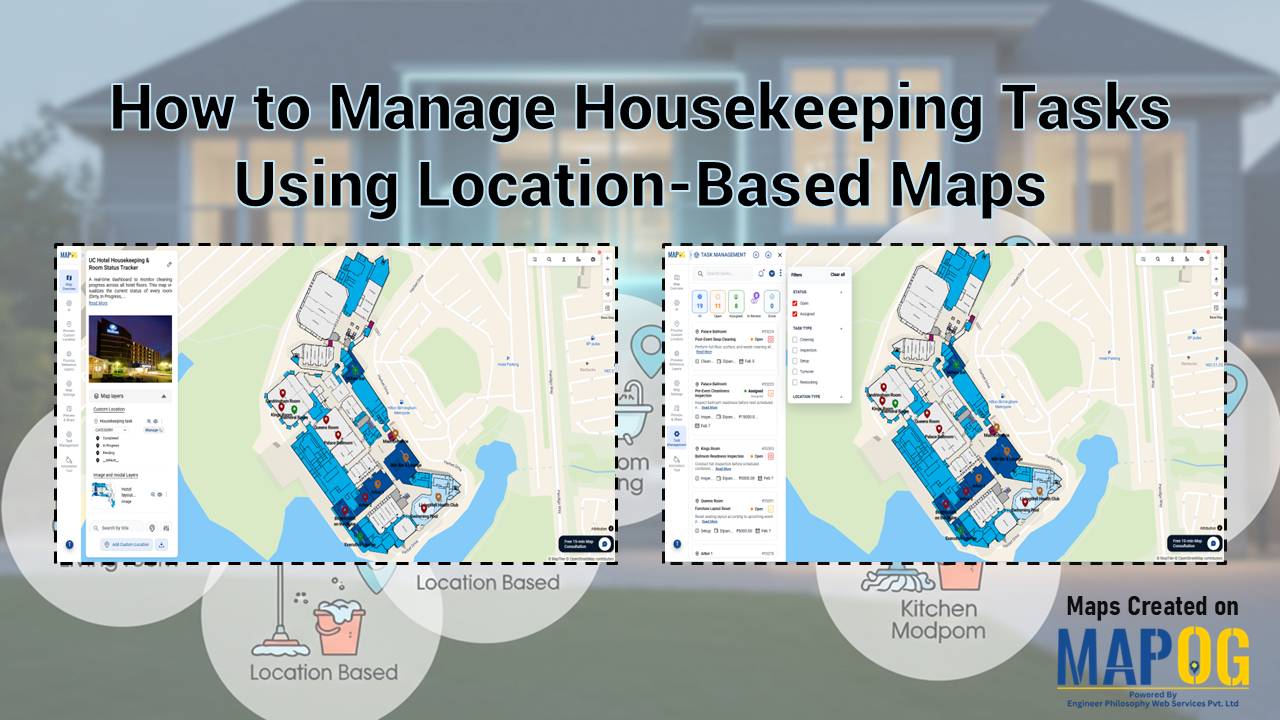
How to Manage Housekeeping Tasks Using Location-Based Maps

Facility managers often struggle with paper checklists and delayed updates when tracking cleaning staff. Modern teams use visual dashboards to see which rooms need attention. This article shows how to manage housekeeping tasks using location-based maps with MAPOG. Key Concept: Manage Housekeeping Tasks Using Location-Based Maps A location-based map system digitally marks and color-codes each … Read more

How to Track & Manage Interior Design Site Visits on a Map

How to Track & Manage  Interior Design Site Visits on a Map

Interior design teams often struggle with multiple site visits, scattered updates, delayed follow-ups, and low project visibility. When data is spread across tools, coordination slows and decisions take longer. Manage Interior Design Site Visits with MAPOG by bringing all locations, visit status, tasks, timelines, and teams into one clear, interactive map with real-time data, improving … Read more

Visualize Property Assets Using 3D Building Mapping

Visualize Property Assets Using 3D Building Mapping

Traditional spreadsheets and flat property listings hide high-value real estate assets to flat rows of data, critical spatial context making it hard to understand location impact, building scale, and asset relationships slowing decisions and increasing guesswork. MAPOG changes this by transforming real estate data into interactive 3D building maps, allowing teams to Visualize Property Assets … Read more

Dashboard view demonstrating how to Filter Only the Locations That Need Action within a 5 km radius on a map using proximity and status-based filters.

How to Filter Only the Locations That Need Action Within a 5 km Radius

Managing multiple locations efficiently becomes challenging when you need to identify which sites require immediate attention. MAPOG‘s dynamic filtering system helps businesses streamline operations by pinpointing critical locations within specific geographic boundaries. Learning how to filter only the locations that need action within a 5 km radius transforms scattered data into actionable insights. Key Concept: … Read more

visualize the franchise covergae for a bakery outlet

Visualize Franchise Coverage Using Interactive Maps

Running a franchise business is no longer just about opening outlets in multiple cities. Instead, it is about understanding where your outlets are located, how they perform, and which areas remain untapped. This is where interactive maps play a crucial role. Visualize  franchise coverage on a map, businesses can instantly see location patterns, service reach, … Read more

how to apply multiple filters

How to Apply Multiple Filters Together on a Map

When you work with location-heavy data, simply placing points on a map is not enough. You need a way to apply multiple filters on map , compare categories, and instantly highlight visuals that matter. That is why applying multiple filters together on a map becomes so powerful. It helps you narrow down results, spot patterns … Read more

Filter Properties for Insights

How Developers Use Filters to Visualize Properties by Price, Type & Status

In today’s real estate tech landscape, clarity and precision in data visualization are essential for smarter property decisions. Simply listing properties isn’t enough-you need a way to slice, sort, and understand them instantly. That’s where Interactive filters come in. By Filter Properties for Insights based on price range, property type, and availability status, maps become … Read more

Use Filters to View Only the Data You Need on Your Map

Use Filters to View Only the Data You Need on Your Map

Using filters to view only the data you need on your map is one of the most effective ways to turn complex location datasets into clear, actionable insights. Instead of navigating through cluttered points, filters help you spotlight the information that truly matters, whether it’s by category, status, rating, or any other attribute. This focused … Read more

MAPOG interface showing tools to Filter Your Map Data by attributes for smarter location and site selection.

How to Filter Your Map Data by Any Attribute or Field

Modern planning teams operate in environments where speed, accuracy, and clarity directly influence outcomes. Consequently, the ability to filter your map data by any attribute becomes a core strategic skill. In high-growth sectors like EV infrastructure, teams often evaluate hundreds of potential locations before selecting only a few high-impact sites. While this process traditionally demands … Read more

Visualize Field Office

How to Visualize Field Office & Community Coverage on a Map

To visualize field office coverage, organizations increasingly rely on maps because they present operational data clearly and quickly. Instead of managing scattered spreadsheets, you can see how field offices and communities connect spatially. Moreover, when coverage areas are visualized together, planning gaps become obvious. Using MAPOG, which support Excel uploads, GIS Data, and custom location … Read more