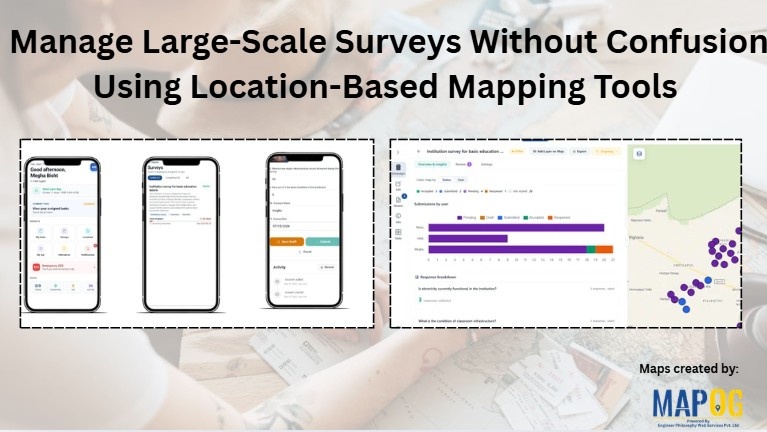
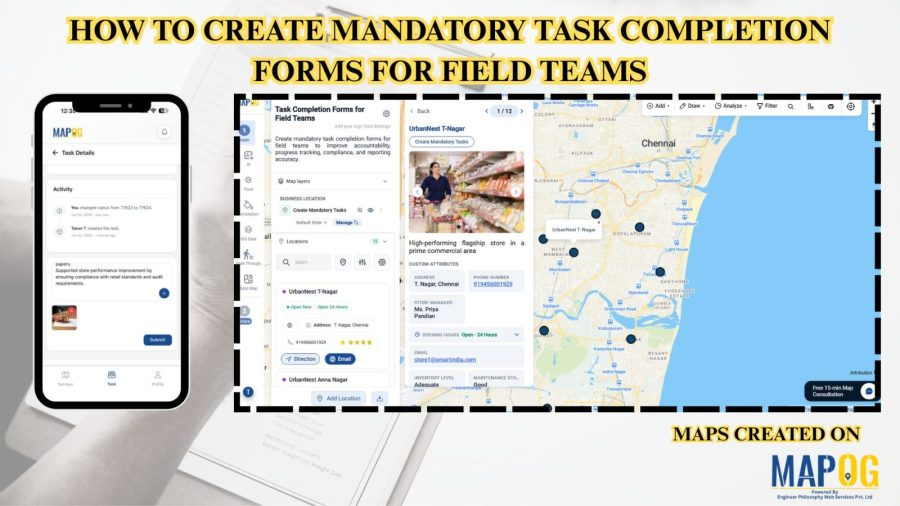
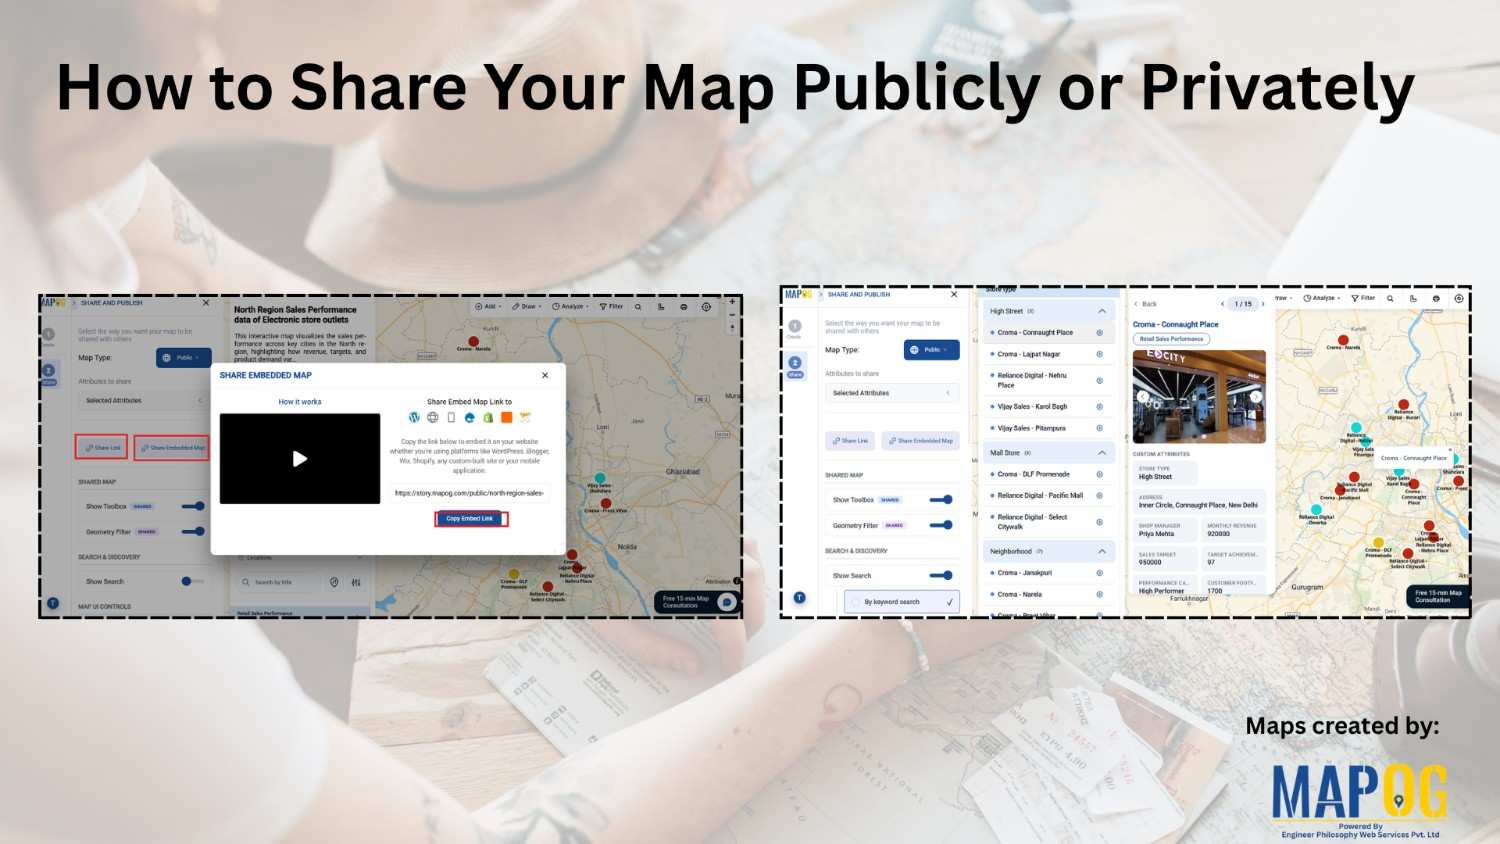
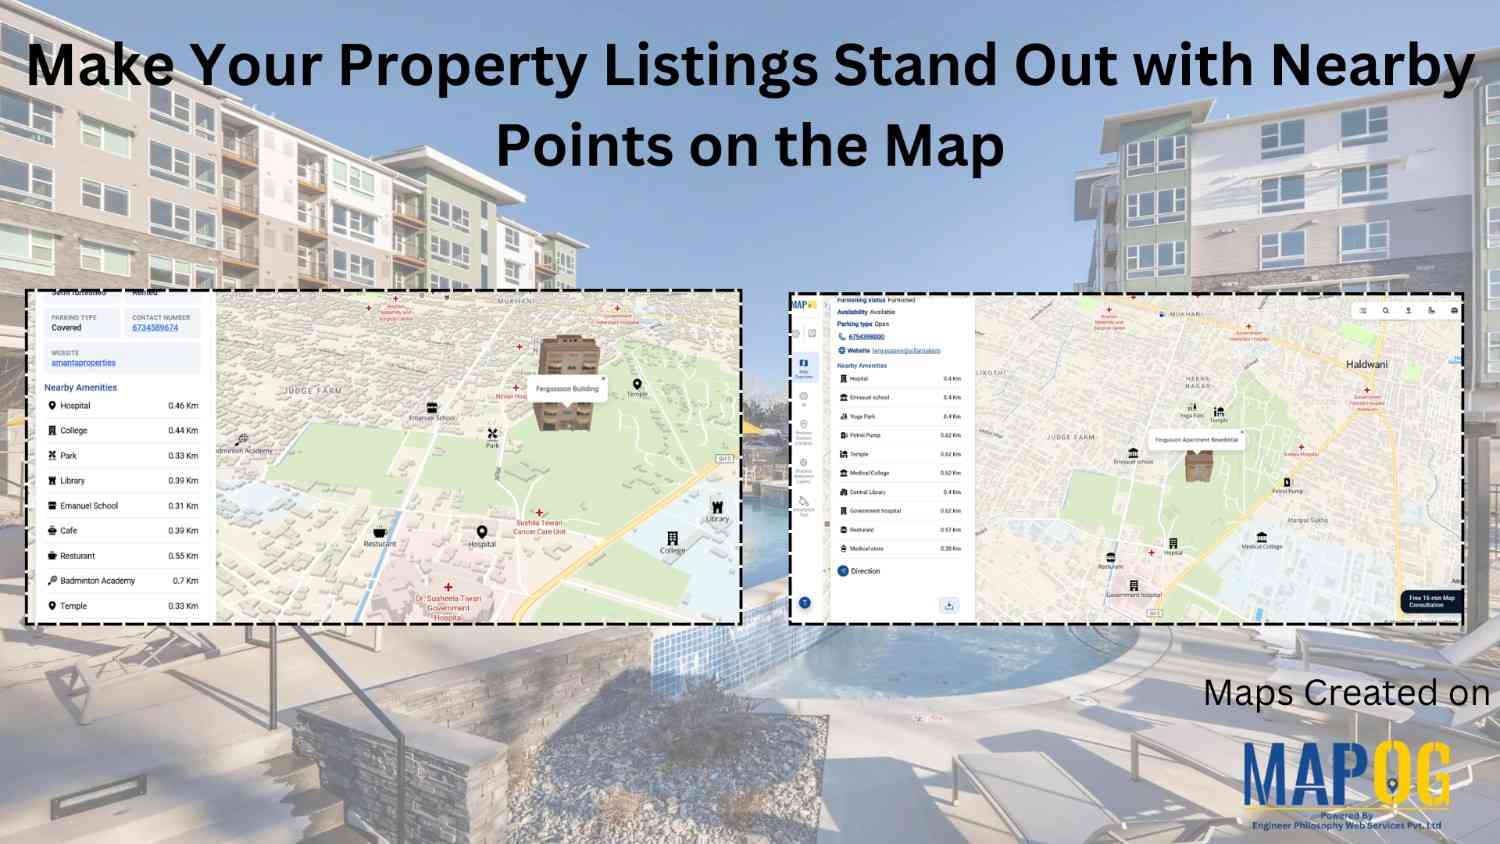
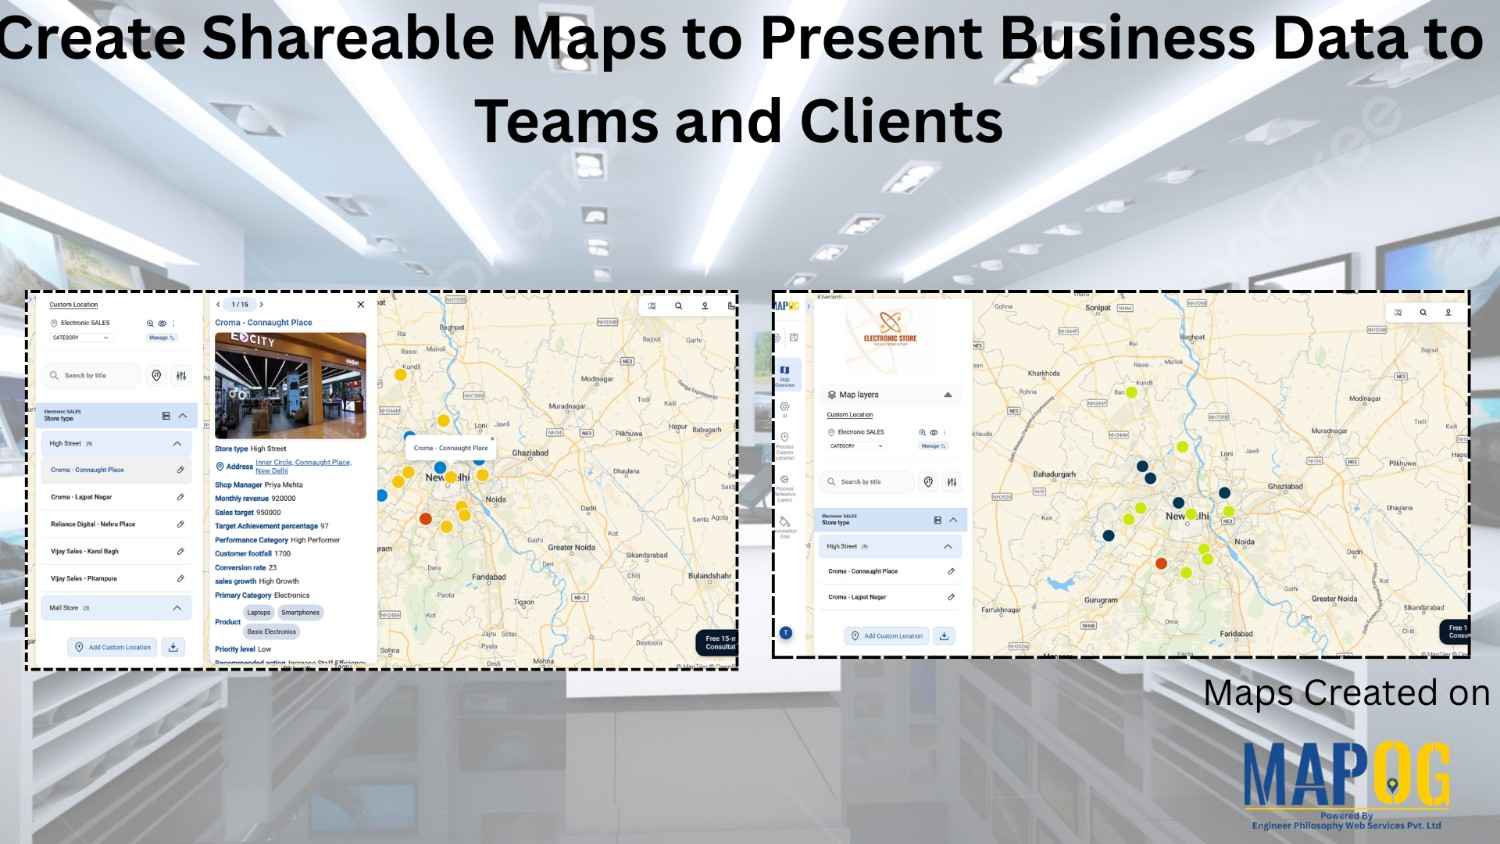
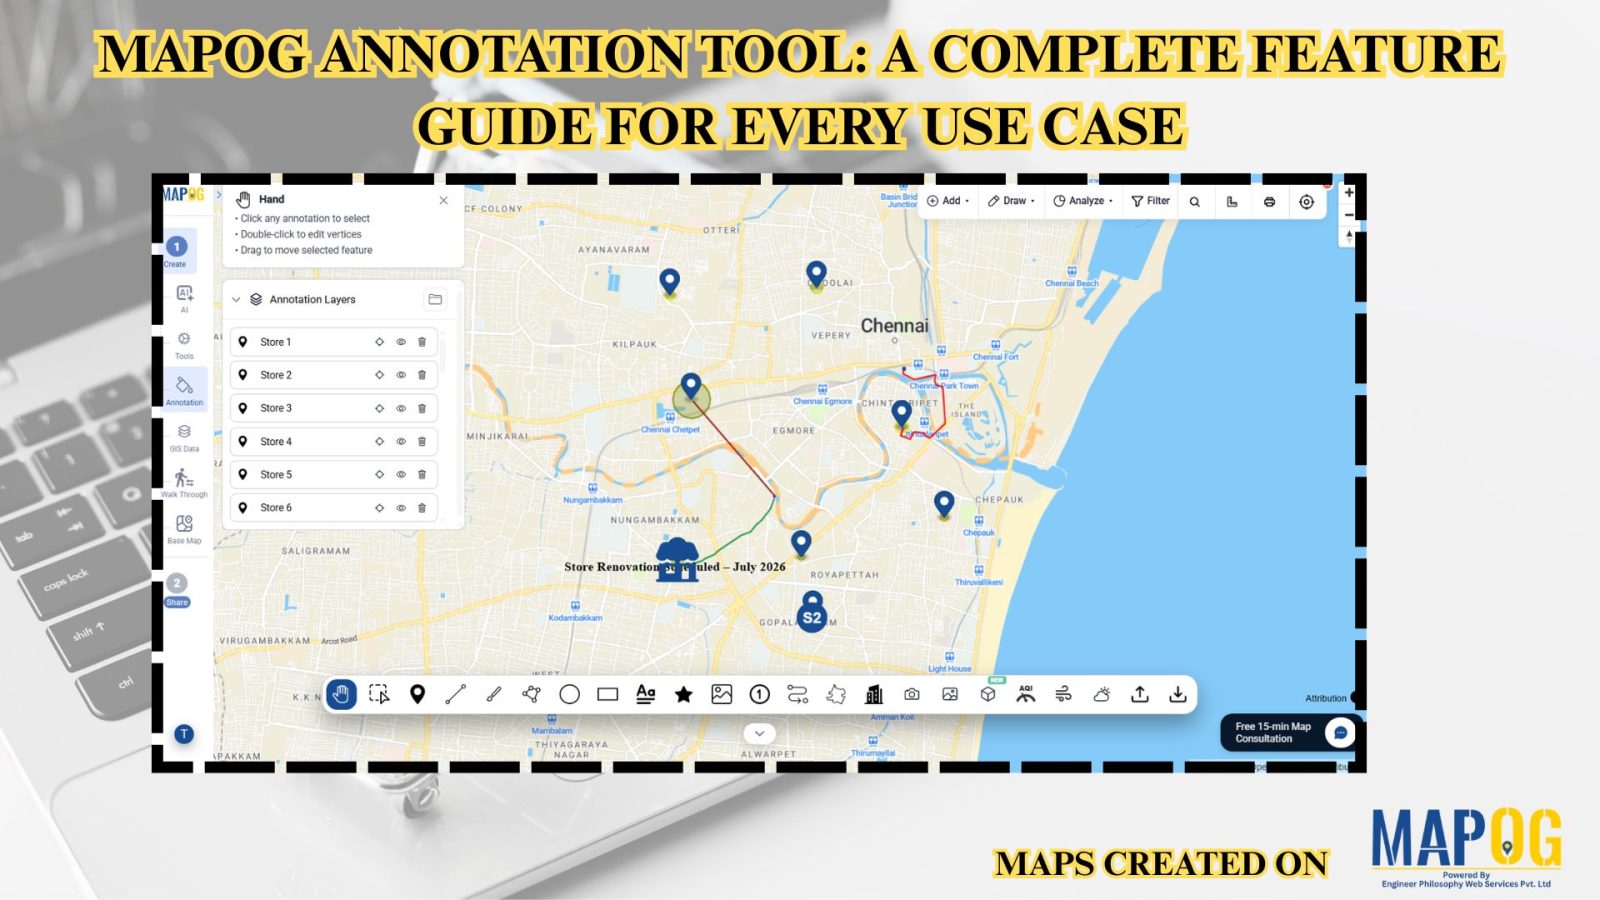
Business Advice

Cover page displaying interactive map presentation ready

How to Create Interactive Maps That Make Your Presentations Stand Out

To create interactive maps that make presentations stand out often runs into a familiar problem: spatial data gets flattened by static visuals. Bullet points can’t show movement. Charts miss relationships. And maps, when passive, lose their power to engage.This disconnect is especially clear when presenting franchise networks, logistics zones, or planning overlays. Without interactivity, audiences … Read more

Download Your Mapped Data in Different Formats

Download Your Mapped Data in Different Formats

Interactive maps do more than just visualize locations—they also store valuable data that can be exported, shared, and analyzed across multiple platforms. For instance, whether you’re tracking coffee shops, field points, real estate listings, or even survey data. MAPOG lets you download your mapped data layers in formats like CSV, XLS, JPG, KML, or SHP. … Read more

Why Every Business Needs a Visual Map, Not Just a Dashboard

Why Every Business Needs a Visual Map, Not Just a Dashboard

Dashboards summarize numbers, but visual maps reveal where and why things happen. Business Needs a Visual Map for example, a coffee chain can use MAPOG to see café locations, spot top performers, and analyze competitor proximity in one interactive platform. Moreover, visual maps also help real estate, logistics, healthcare, and many other industries turn complex … Read more

Manage and Share Location-Based Projects Online with an All-in-One Mapping Tool

In today’s fast-paced project environments, tracking multiple sites, teams, and resources across locations is a major challenge. Therefore, to manage and share location-based projects, and moreover to help construction managers track distributed sites, project mapping now provides an all-in-one solution. With MAPOG, even a simple Excel sheet can quickly transform into an interactive map; as … Read more

Interactive Maps for Better Engagement

Why Businesses Are Switching to Interactive Maps for Better Engagement

Businesses today are moving beyond static visuals and lengthy reports — they’re using interactive maps for better engagement to turn raw data into visual stories. From real estate firms displaying project portfolios to tourism companies mapping destinations, and logistics brands tracking operations, interactive mapping platforms like MAPOG are helping businesses communicate more effectively and engage … Read more

Easy Mapping Tools

Easy Mapping Tools Are Revolutionizing Real Estate Project Planning

Creating detailed maps for real estate projects or buildings once required technical GIS knowledge or expensive software. For developers, planners, easy mapping tools for real estate projects often meant relying on specialists just to visualize property layouts or land parcels. However, the rise of easy, no-code mapping tools has completely changed that. MAPOG now make … Read more

Monitor & Maintain CCTV Installations with Interactive Maps

Monitor & Maintain CCTV Installations with Interactive Maps

Running a CCTV Installation Map helps businesses manage hundreds of camera sites, clients, and service requests efficiently. Traditionally, companies relied on Excel sheets, WhatsApp chats, or handwritten registers, which made tracking installations confusing. But managing installations, clients, and service records in scattered places quickly becomes confusing. That’s where an interactive map comes in — a … Read more

Change Map Icons & Sizes Based on Your Data Values

Often, when faced with a large set of data, it is very difficult to visualize it together. We need the help of data visualization tool in digital maps. Suppose you are a businessperson, who owns several retail chain stores across the city and need to see the performance of your stores in an effective manner. … Read more

Track Task Progress on a Map

Track Task Progress on a Map Dashboard (Completed vs Pending)

Tracking everyday projects on spreadsheets often turns messy, especially when tasks spread across different teams and locations. Instead of flipping through endless reports, a smarter way is to track task progress visually on a map dashboard. This approach gives you an instant view of what’s done and what’s pending while also keeping everything more organized. … Read more

Share an Interactive Map with Teammates (View or Edit Access)

Best Way to Share Interactive Maps Online with View and Edit Access

Today, readers and team members expect more than just static information when exploring content or managing data online. Whether it’s tracking locations, updating details, or monitoring progress, interactive maps make collaboration simple and engaging. With MAPOG, you can easily share an Interactive Map with teammates, assigning view or edit access to ensure the right people … Read more