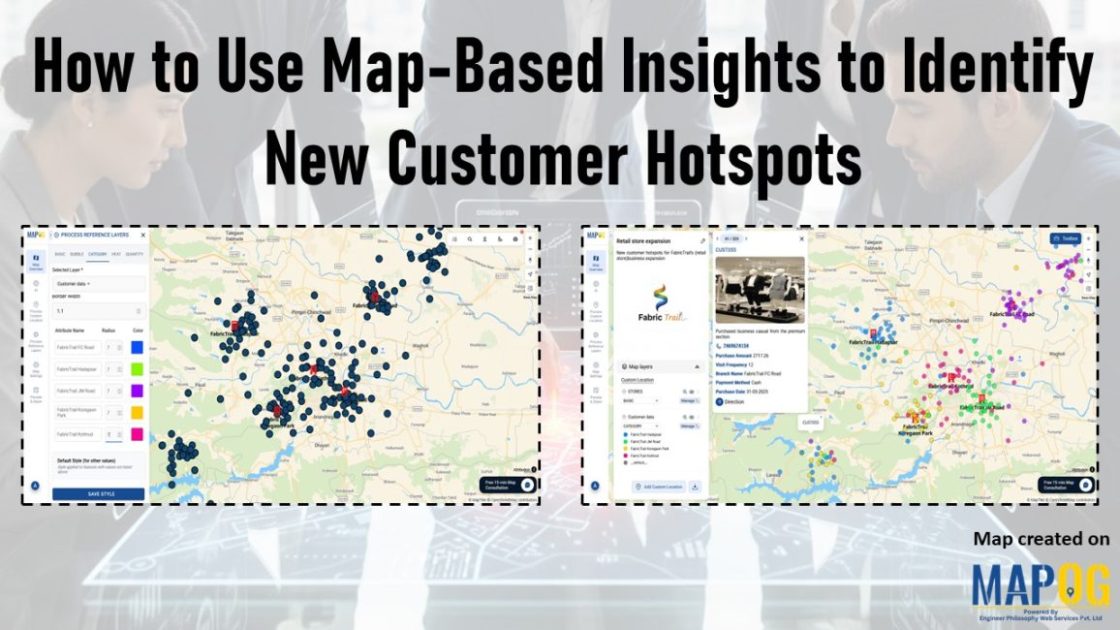
The Travel Map: Effortless Route Planning & Navigation with GIS | Best Travel Tech
Discover The Travel Map: simplifying travel with reliable navigation. MAPOG’s accolades highlight its transformative impact on seamless exploration worldwide.
In today’s fast-paced world, businesses need tools that help them make data-driven decisions. Isochrone maps, which visualize areas accessible within a certain time or distance, can be a game-changer. They provide insights into customer reach, delivery zones, and more. This article explores how isochrone maps can benefit your business and use MAPOG to create meaningful … Read more
In forest management, the utilization of Geographic Information System technologies is paramount for enhancing resource management and conservation efforts. Leveraging MAPOG Map Analysis, we embark on a journey to explore the utilization of grids for better decision-making. By integrating forest data onto the map and employing spatial analysis techniques, such as clipping and grid creation, … Read more
What is Merge Polygon tool? The Merge Polygon tool is a functionality that enables the combination or consolidation of adjacent or overlapping polygons into a single, cohesive polygonal feature. This tool is essential for spatial data processing and analysis, allowing users to simplify complex datasets, resolve geometric inconsistencies, and streamline data representation. This article delves … Read more
In ‘Forest Management Using Split Polygon Tool,’ we employ MAPOG Map Analysis to divide forested regions into equal parts, optimizing resource allocation and conservation efforts for sustainable forest management. Key Concepts MAPOG is an outstanding tool for creating interactive and innovative maps. We can employ this tool to divide forested regions into equal parts, optimizing … Read more
In data visualization, heat maps emerge as powerful tools for conveying information in an intuitive and visually engaging manner. Through the use of color gradients, heat maps offer valuable insights into population distribution, trends, and patterns. In this use case, we explore heat maps as a tool for mapping population data from a CSV file … Read more
Enhance map customization with clip or crop layers functionality. Tailor geographic data precisely for focused analysis and visualization.
Forest Cover Maps a fundamental tool within GIS, serves as a potent visualization method. It utilizes colors to represent the density or intensity of data across a geographic area, offering valuable insights into various phenomena. Key Concept to Creating Forest Cover Maps: Using Heat Map Style Heat maps are super helpful when we want to … Read more
With the advancements in today’s digital world, GIS data is a necessary element for any professional or enthusiast in urban planning, environmental monitoring, or simply the creation of a visual story. The integration of GIS data with an online map is, thus, an indispensable skill. In the following pages, we shall describe how to incorporate … Read more
In recent years, the importance of disease surveillance has been underscored by various global health challenges, including pandemics and emerging infectious diseases. Disease surveillance plays a pivotal role in public health management, enabling the timely detection, monitoring, and control of infectious diseases. MAPOG is a powerful tool for health authorities to augment traditional surveillance methods. … Read more