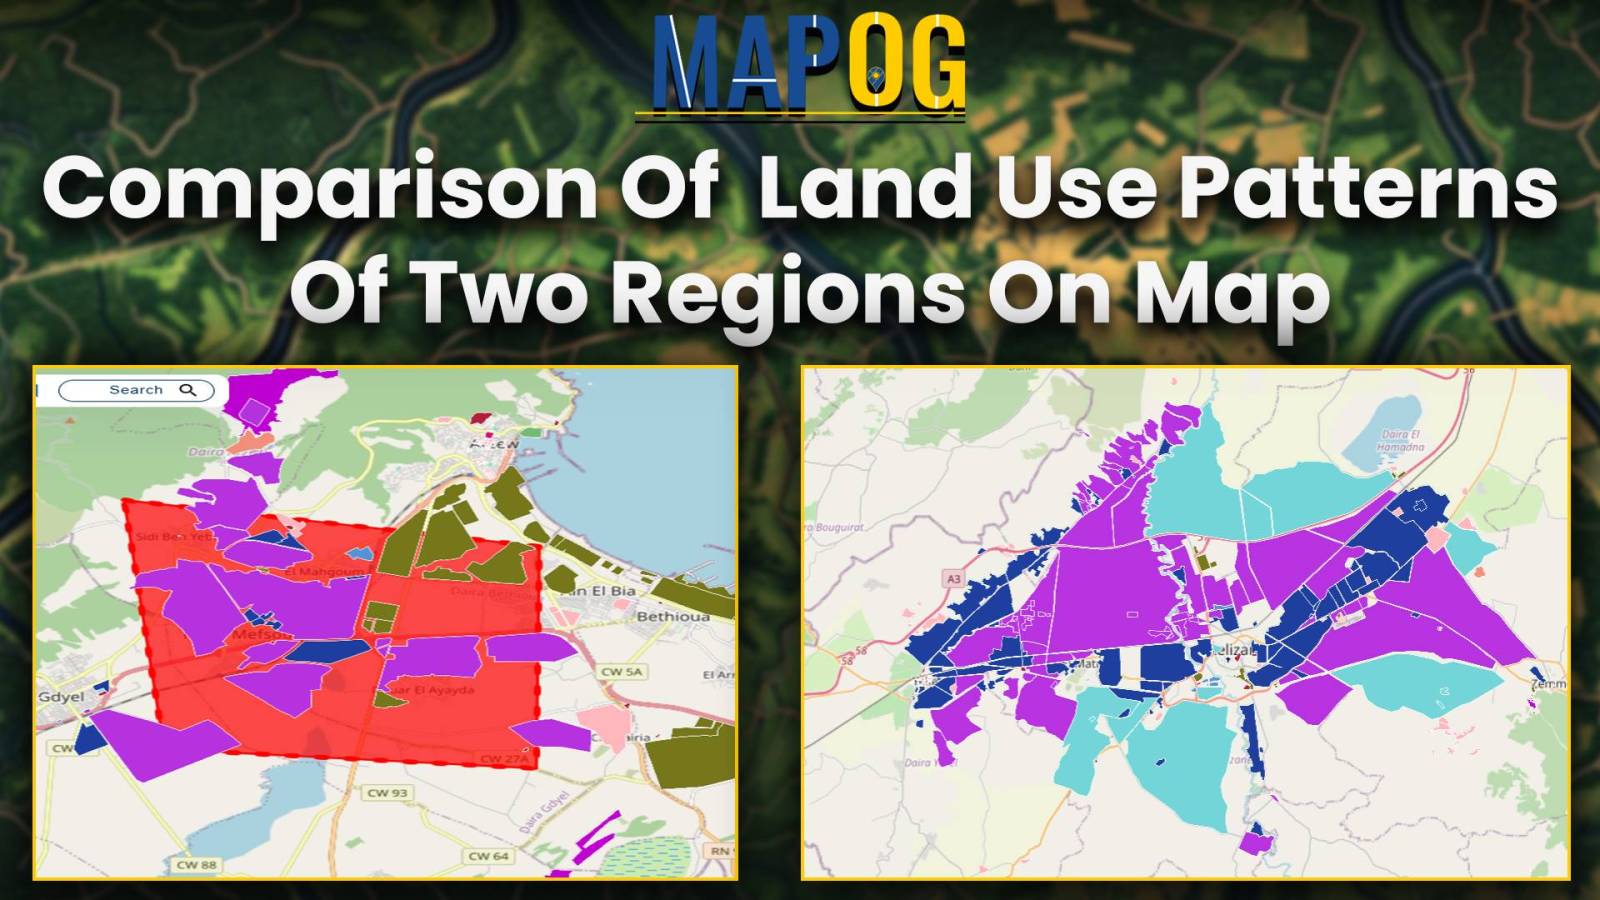
Create map: Comparison of Land Use Patterns of Two Regions for Urban Planning
leveraging MAPOG’s category style options and clip tool to provide a comprehensive comparison of land use characteristics between two regions.
leveraging MAPOG’s category style options and clip tool to provide a comprehensive comparison of land use characteristics between two regions.

Utilize MAPOG to create map, then seamlessly embed it into your website using an embedded map tool, which enhances user experience.
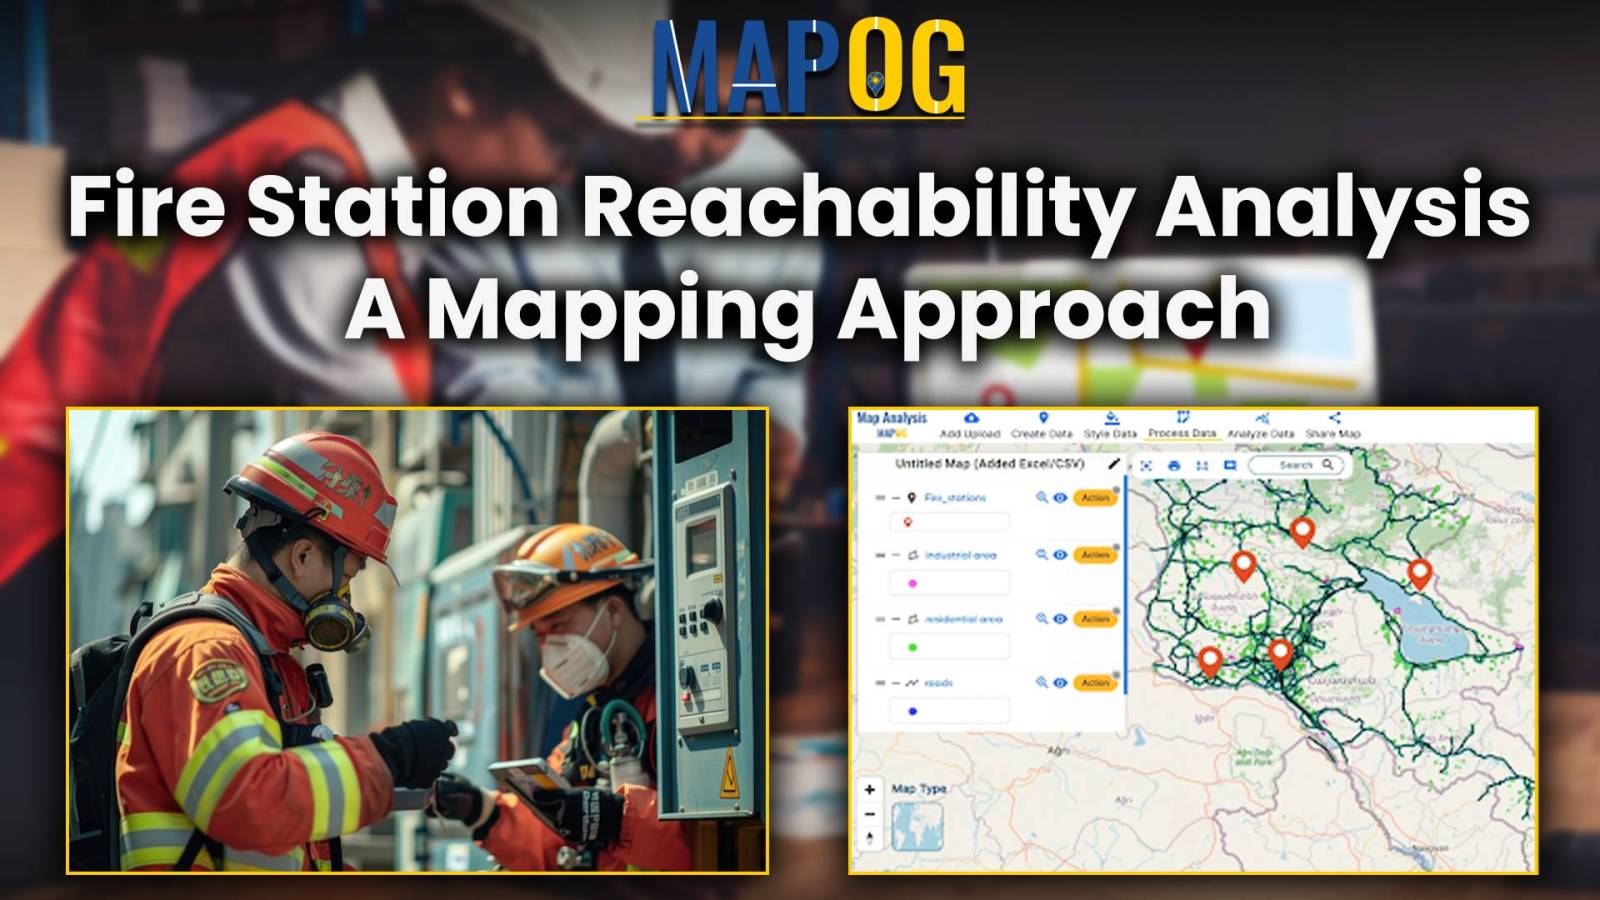
In emergency management, the strategic placement of fire stations plays a critical role in ensuring the safety and well-being of communities. Rapid response times can mean the difference between containment and devastation during a fire emergency. MAPOG offers powerful tools for evaluating potential fire station locations by analysing accessibility to road and travel time to … Read more
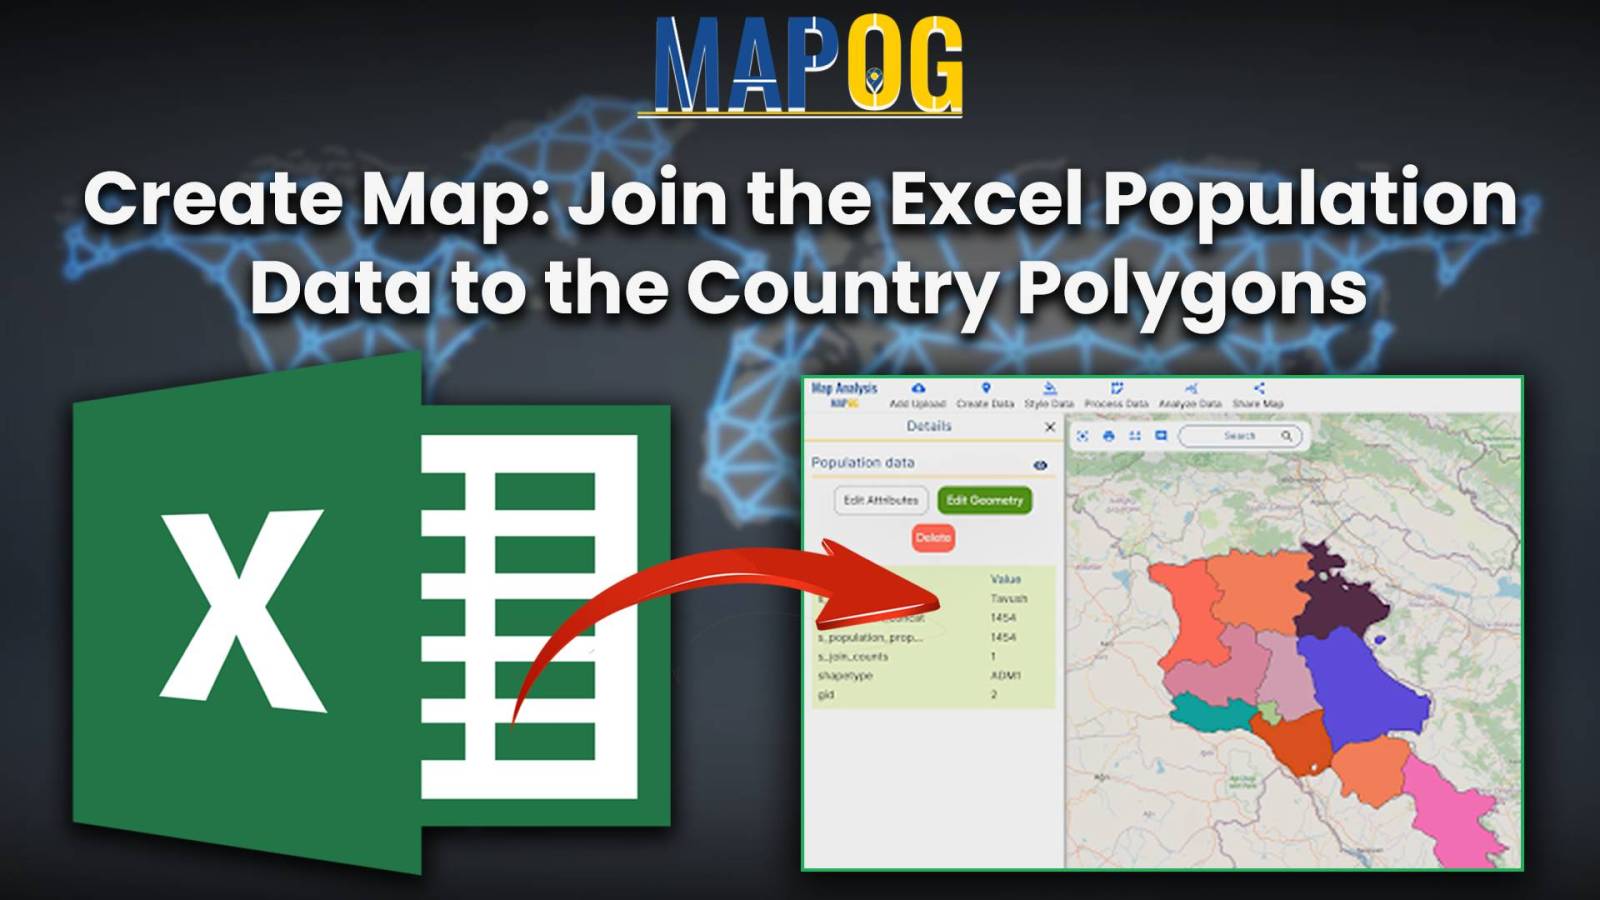
In the present scenario of data-driven decision-making, understanding population demographics is paramount across various domains. One tool that stands out in this regard is the Excel attribute tool of MAPOG GIS Platform. This tool enables users to seamlessly integrate Excel population data with spatial data, providing valuable insights into demographic trends. The importance of this … Read more
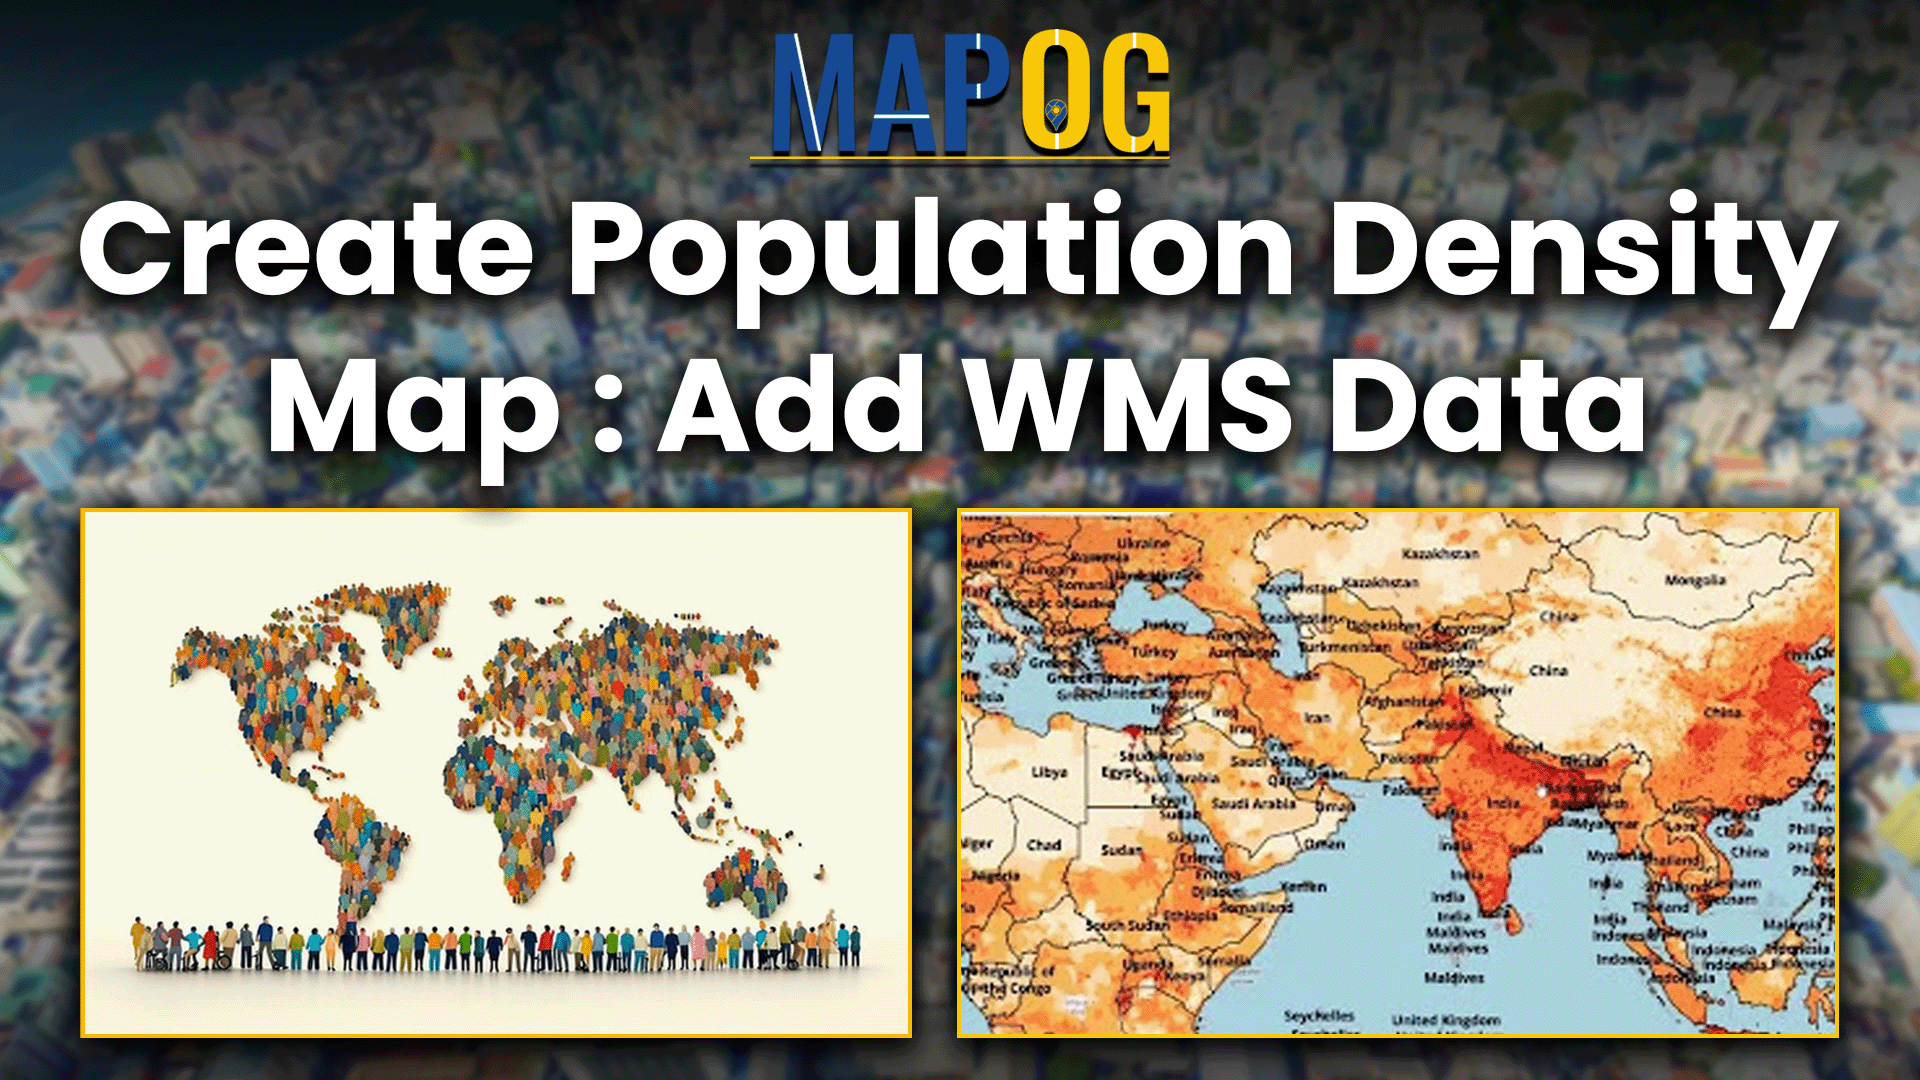
WMS Data: Harness the power of Web Map Services for comprehensive spatial data analysis and visualization with MAPOG.
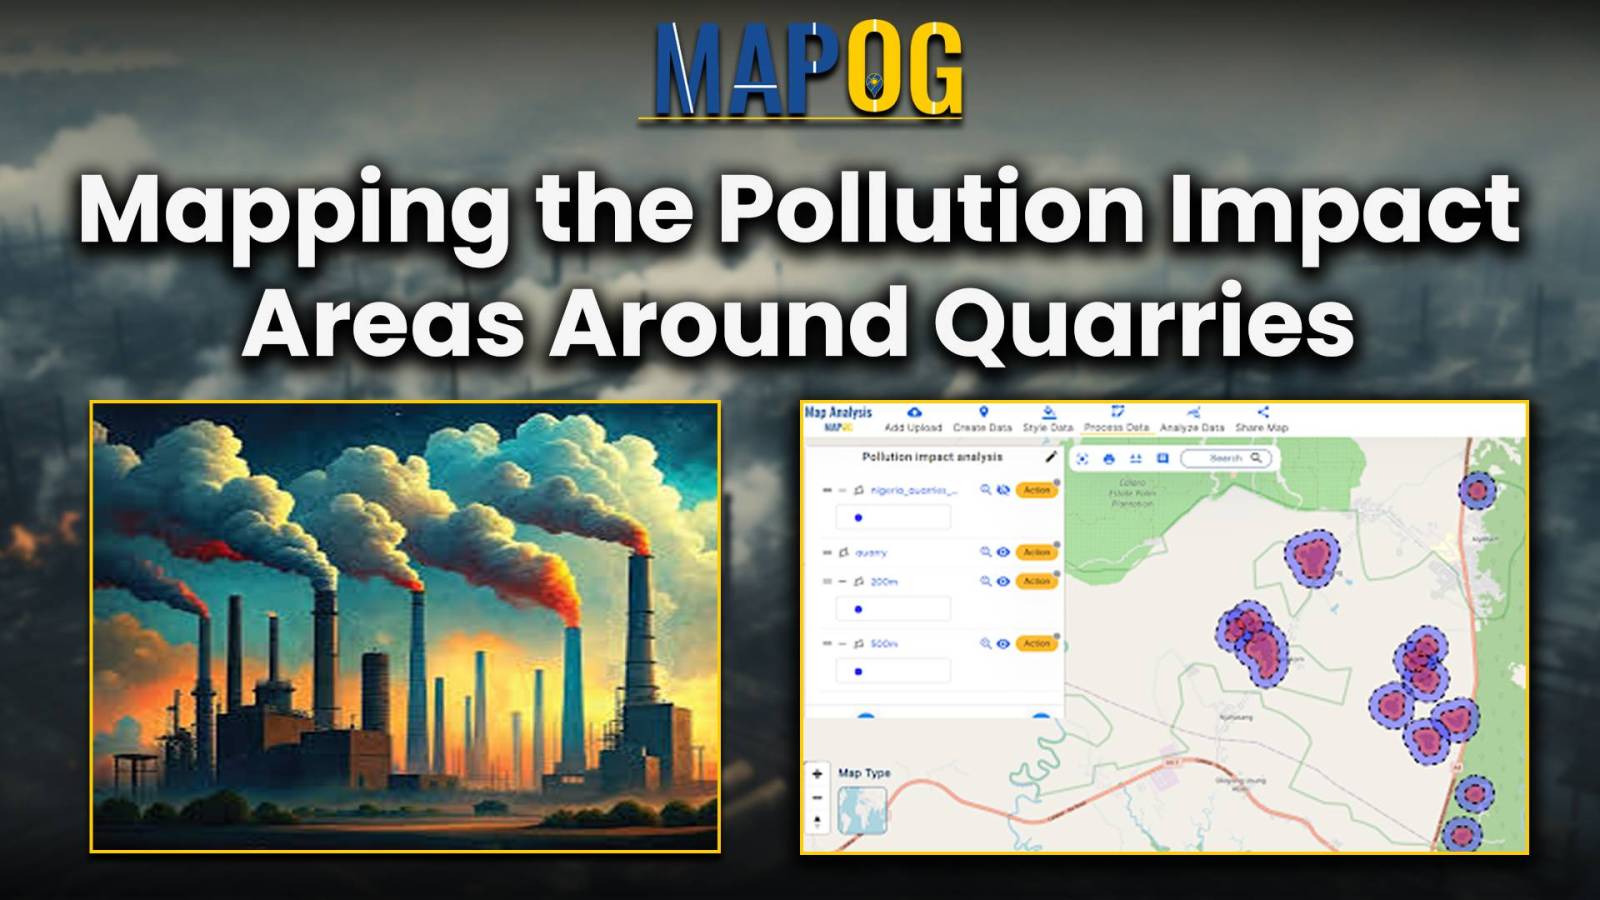
Pollution sites consistently pose threat to human welfare, primarily by directly causing numerous health issues and by contaminating vital natural resources. In many regions the presence of quarries exacerbates this threat. For monitoring pollution impact analysis around quarries, the initial step is to identify the areas affected by quarries. And then assess the extent of … Read more
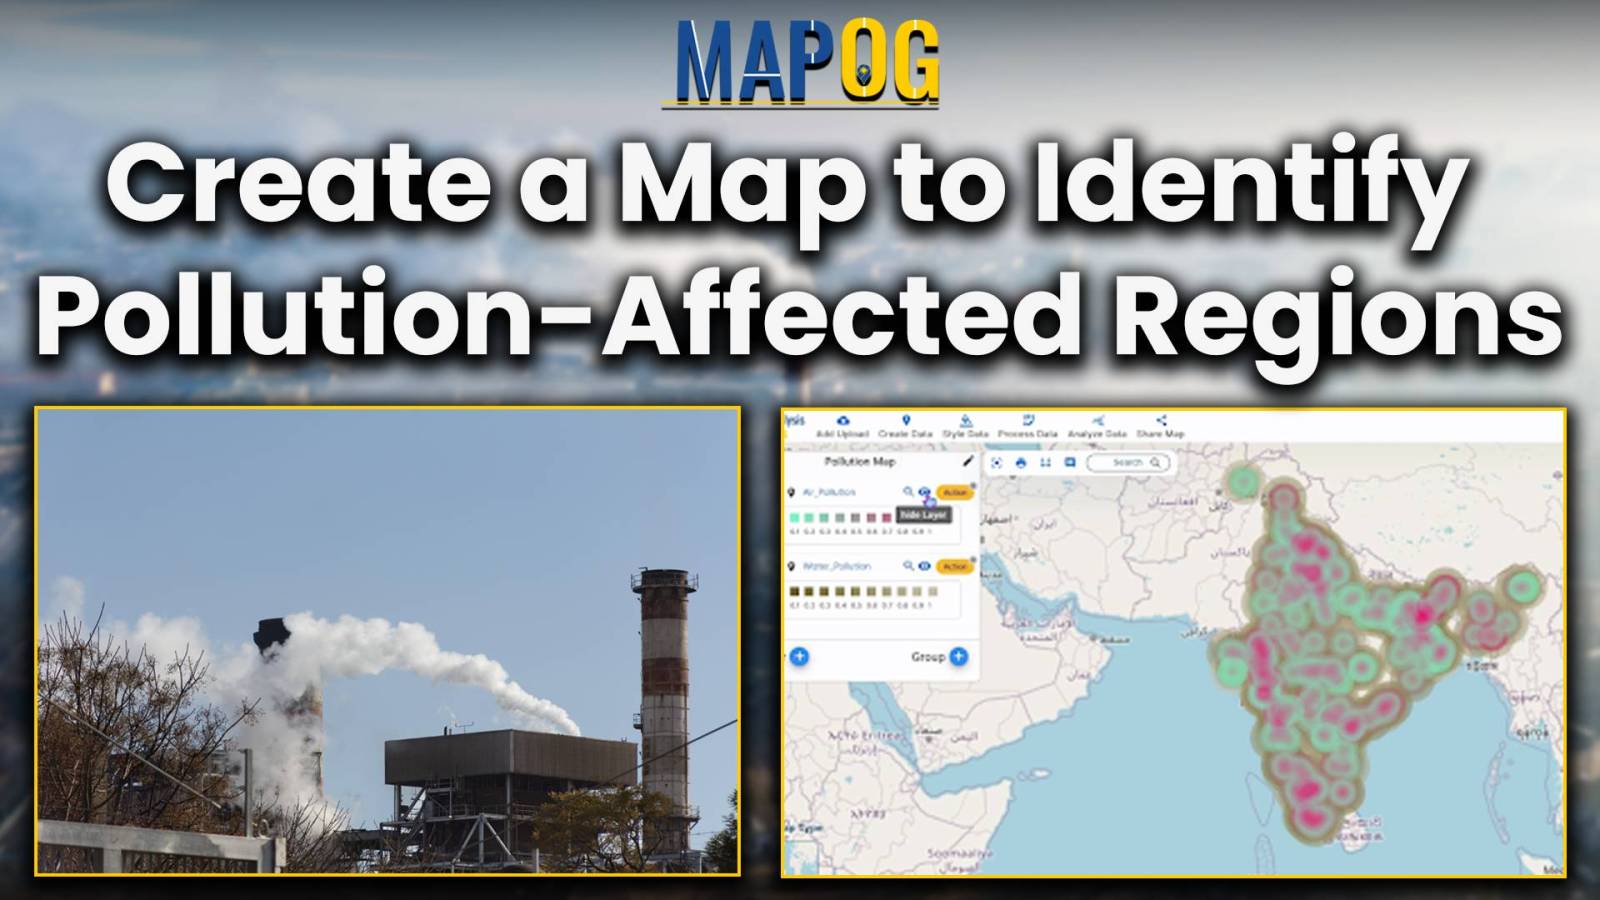
Focusing on the task of identifying pollution affected regions, MAPOG’s Map Analysis helps recognize areas of environmental concern. As pollution remains a pressing issue, the article explores how this tool not only identifies problems but also facilitates informed mitigation measures. Join us on this exploration into the world of advanced mapping for a greener future. … Read more
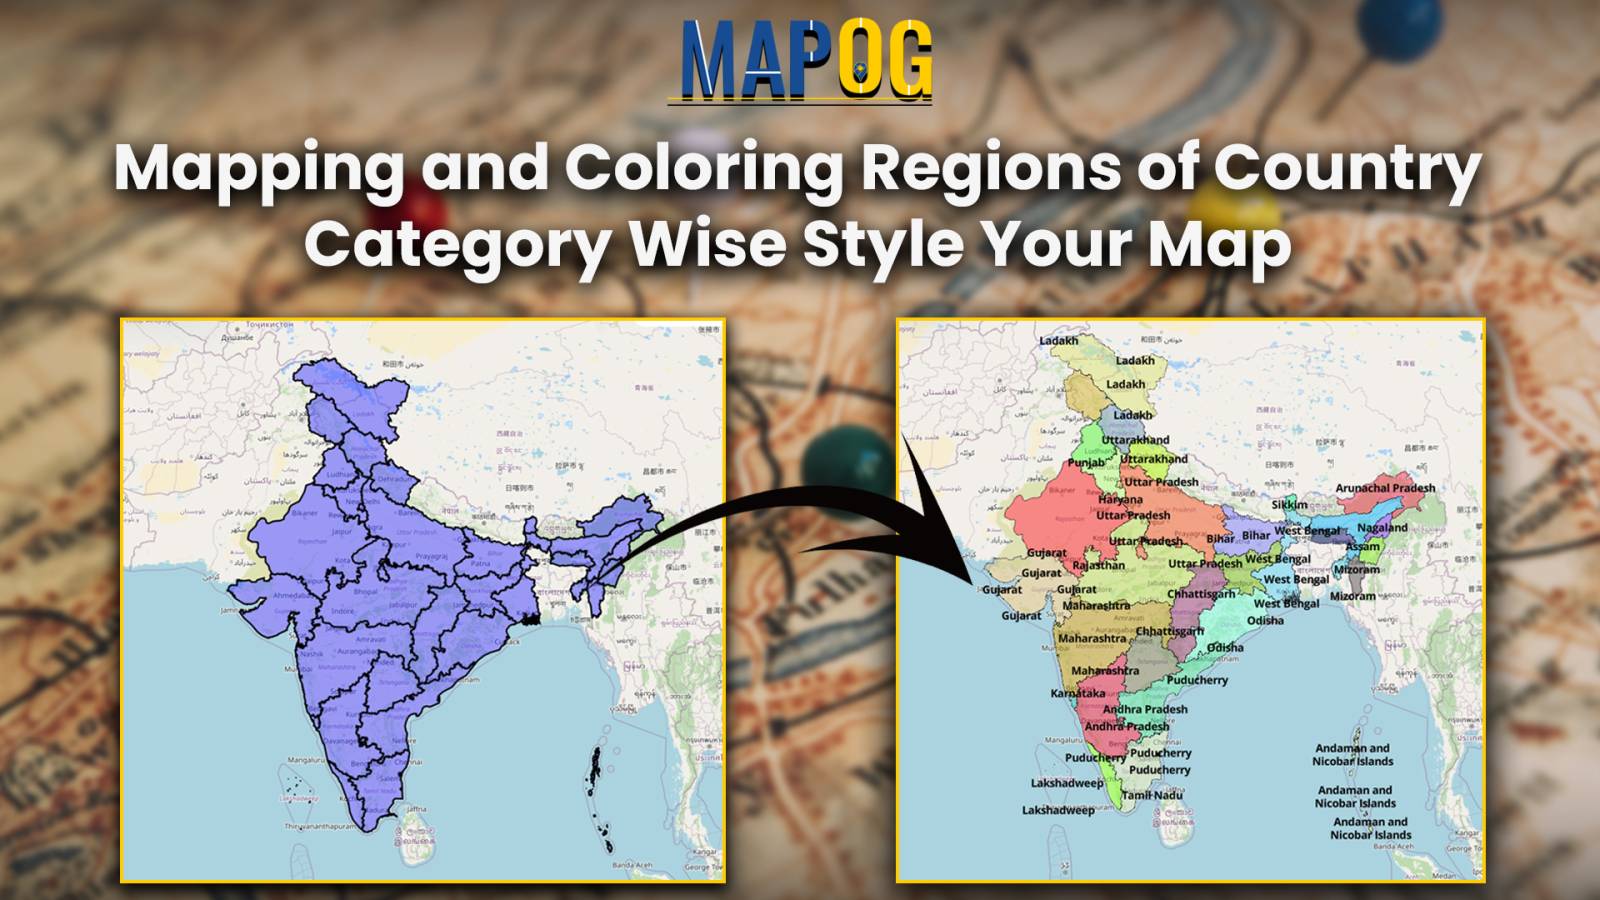
In the realm of geographic information systems (GIS), effective color mapping plays a pivotal role in conveying complex data with clarity. One such tool that significantly enhances the color mapping process is the category styling option in MAPOG. This feature allows users to assign distinct colors to different categories, facilitating better understanding and interpretation of … Read more
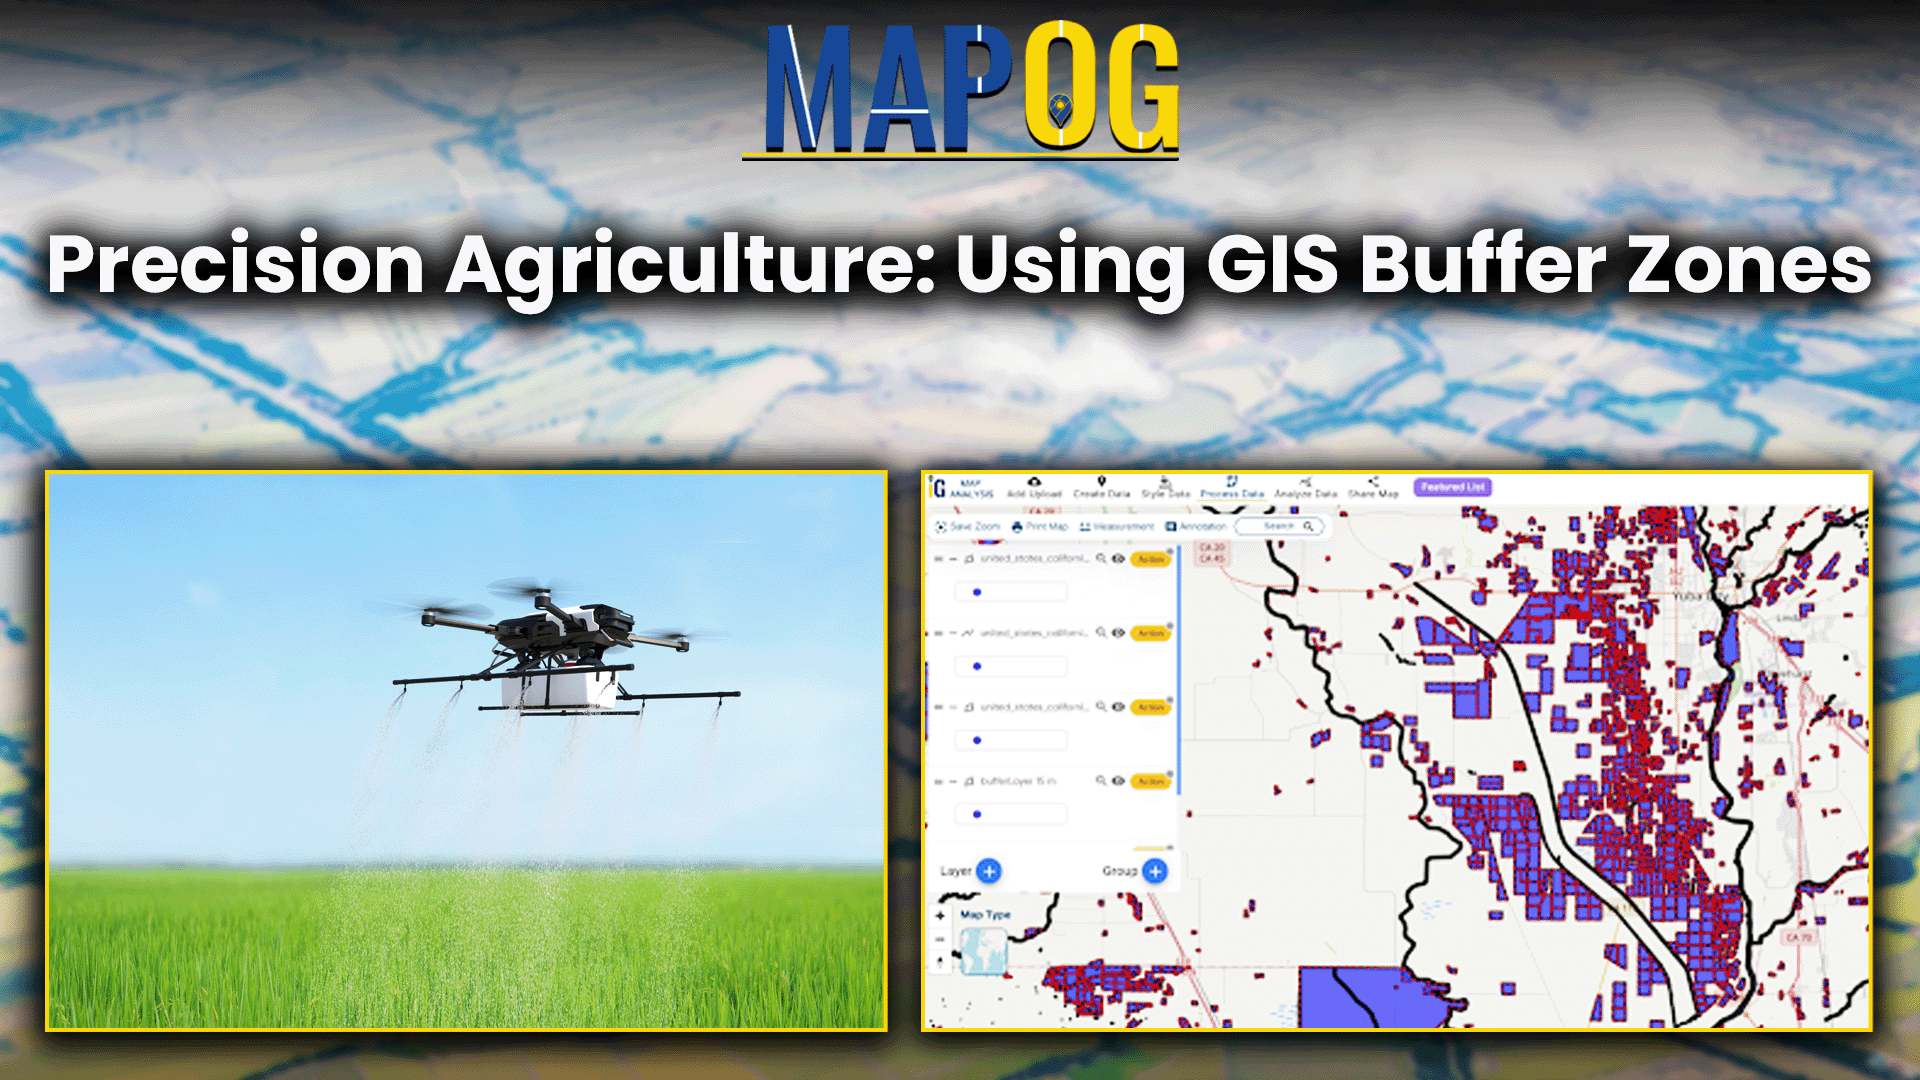
In the world of farming, we’re on a mission to do things in a smarter and more eco-friendly way. We’re diving into how we can be super careful about using fertilizers near water, and we’ve got a helpful tool called MAPOG Map Analysis to guide us. This tool uses GIS in Precision Agriculture and create … Read more
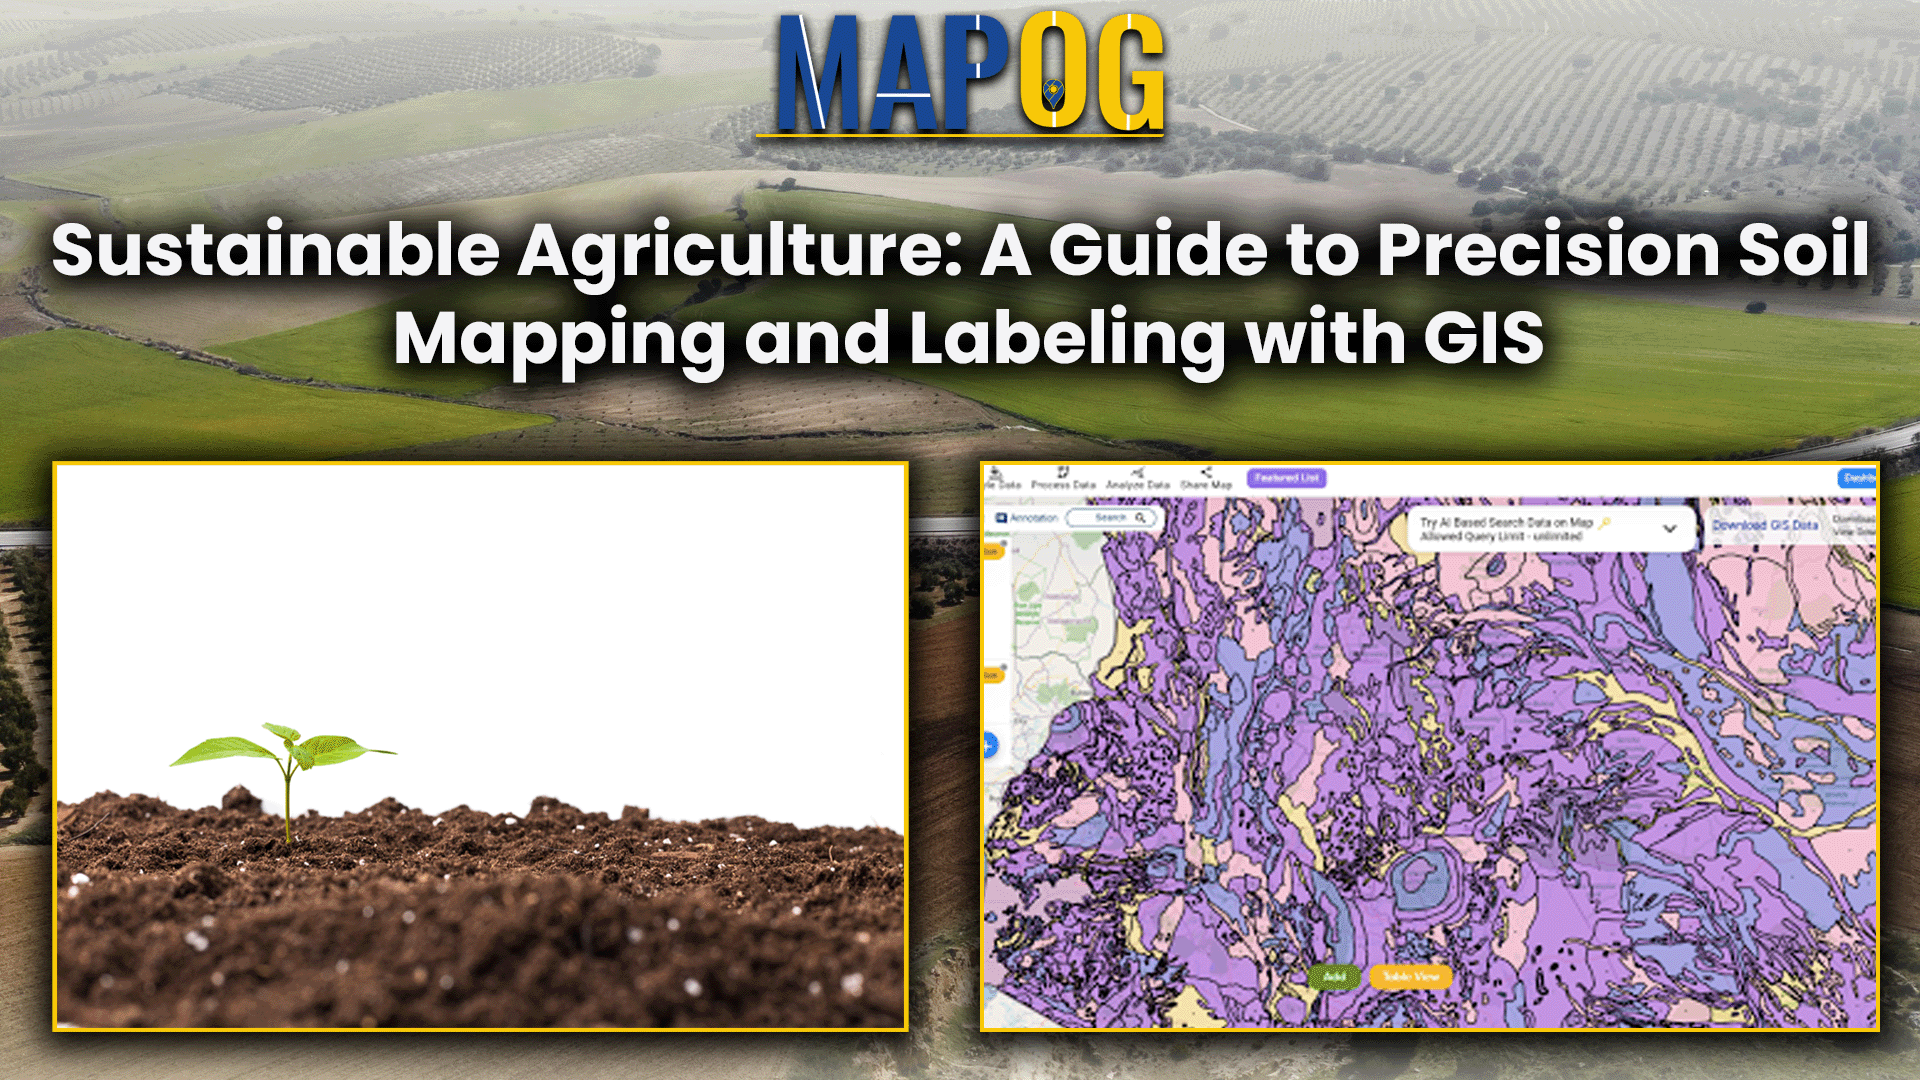
In the frontier of precision agriculture, MAPOG’s Map Analysis tool utilizes cutting-edge technologies to reshape farming practices. Delve into the intricate world beneath the surface, meticulously mapping diverse soil resources using the powerful capabilities of MAPOG. Let the precision of MAPOG guide you through a landscape where informed decision-making harmonizes seamlessly with sustainable farming practices. … Read more