Focusing on the task of identifying pollution affected regions, MAPOG’s Map Analysis helps recognize areas of environmental concern. As pollution remains a pressing issue, the article explores how this tool not only identifies problems but also facilitates informed mitigation measures. Join us on this exploration into the world of advanced mapping for a greener future.
In the following step-by-step guide, we will explore how to use MAPOG’s tools, starting from adding essential data to visually identifying regions with high pollution values. Let’s embark on an insightful journey for informed decision-making.
Key Concept
At the forefront of environmental management, MAPOG emerges as a formidable tool by integrating geospatial analysis and Heat Map functionality. This combination empowers decision-makers with precise insights into regions contending with heightened pollution levels. The core concept revolves around optimizing resource allocation, refining decision-making processes, and enabling a targeted strategy for pollution mitigation. MAPOG’s distinctive strength lies in its capacity to combine diverse pollution datasets, offering a comprehensive understanding of the environmental landscape. This facilitates the identification of regions significantly impacted by pollution. This makes MAPOG a strategic asset in environmental planning and management. Ultimately, decision-makers are armed with the knowledge to make well-informed choices, driving effective pollution control and mitigation initiatives.
How to Create a Map for Identifying Pollution-Affected Regions
Follow the below steps to identify pollution affected regions
Step 1: Add Data
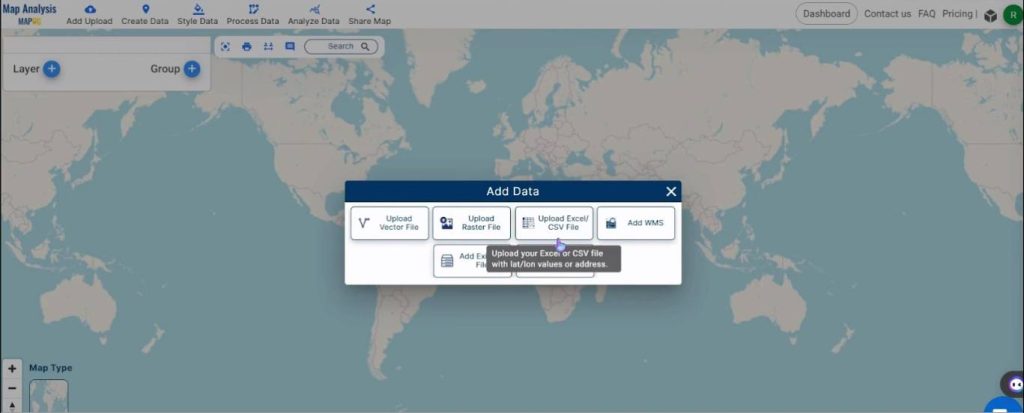
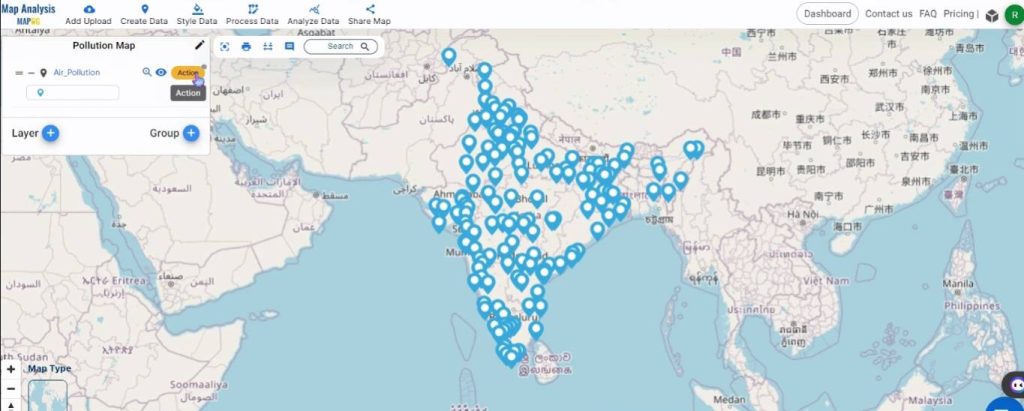
Open Map Analysis interface. Then click on the “Add Upload” button in the upper left corner. A dialogue box will open. Click on “Upload Excel/CSV File” to upload the data.
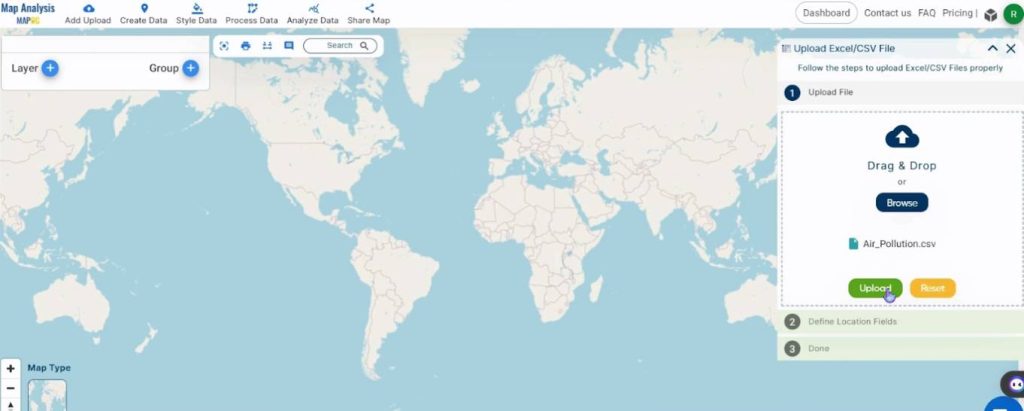
Click on Browse to search for your CSV and then click on Upload.
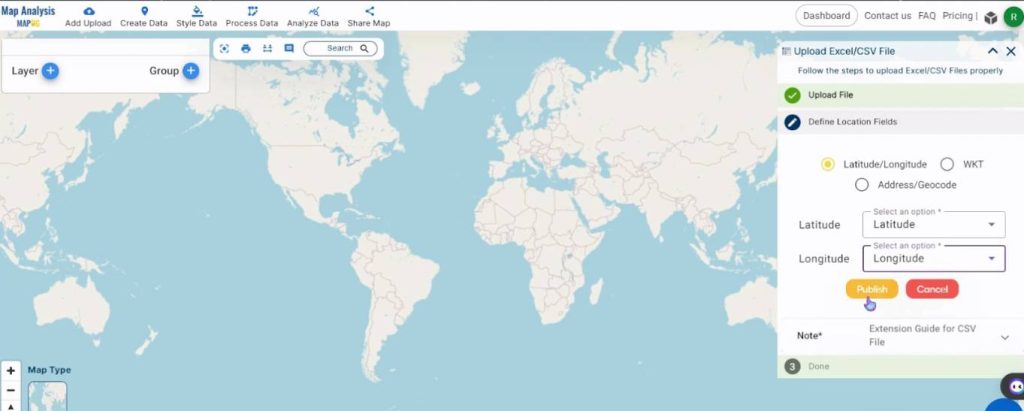
Assign the longitude and latitude to the columns in the CSV containing the respective values.
Step 2: Rename the Map
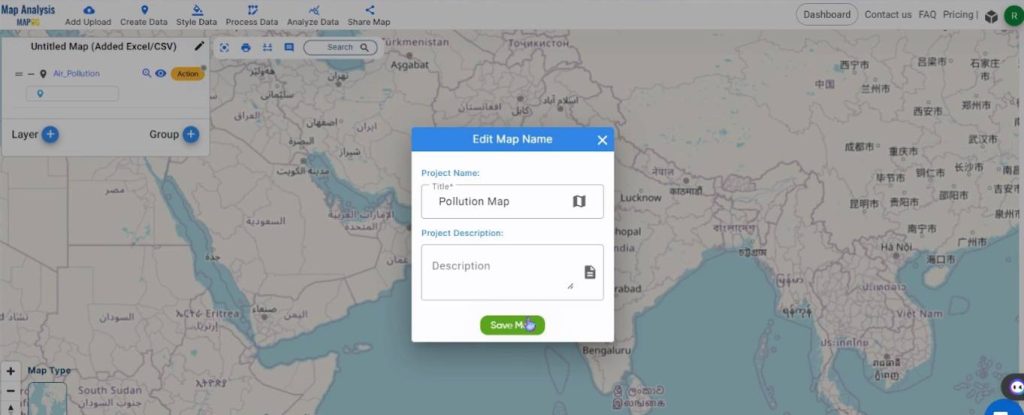
Click on the Pencil icon and rename the map to a suitable name such as, Pollution Map. Then, click on Save Map.
Step 3: Create Heat Maps
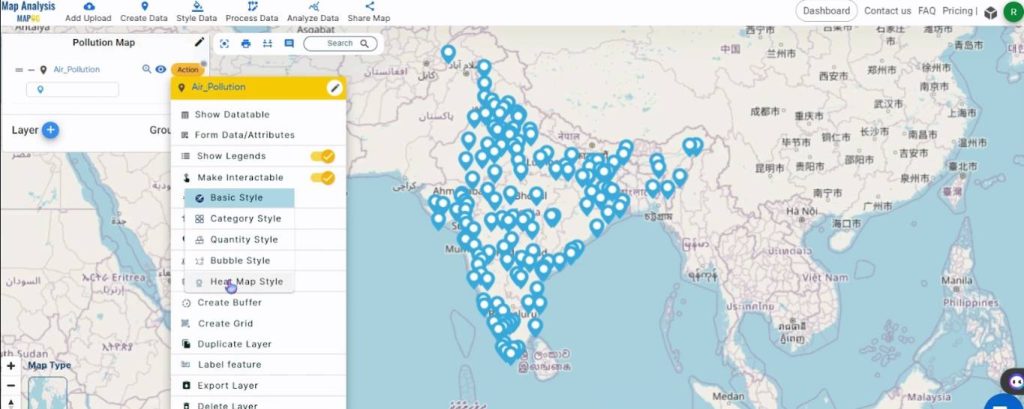
To change the visual representation of the layer, first click on the Action button.
Then, select Heat Map Style from the Edit Style option.
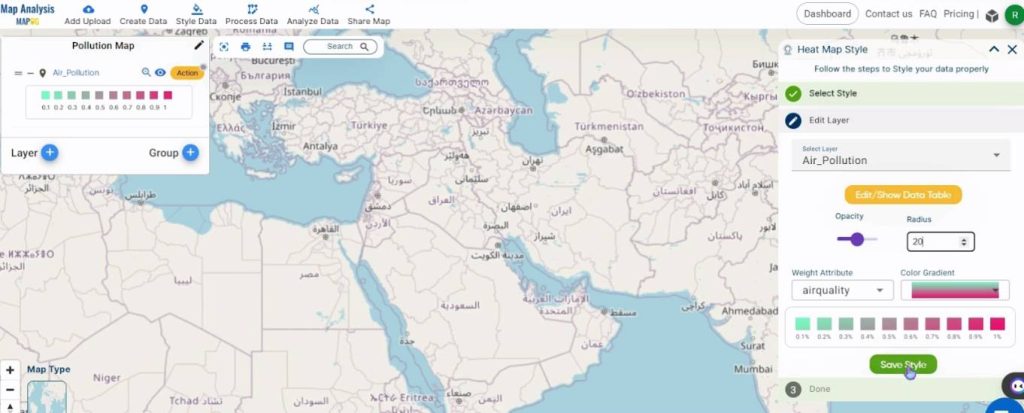
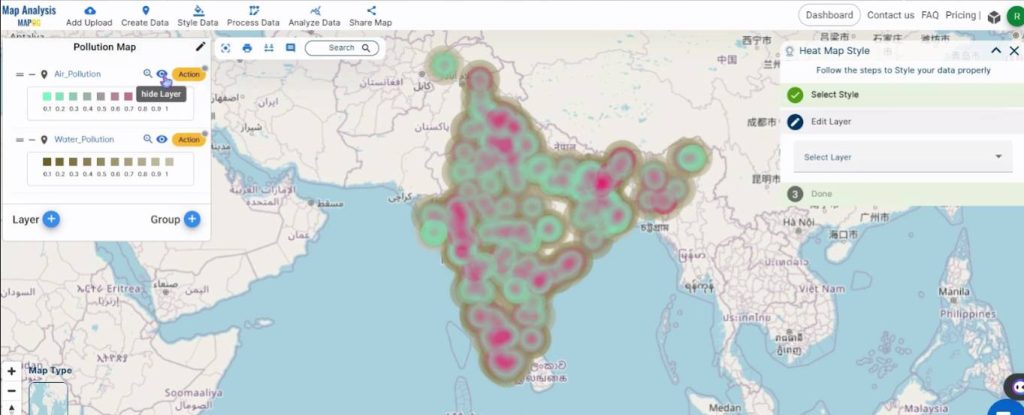
Assign the radius value as 20 and define the Weight Attribute parameter as the pollution value. Then, choose a suitable color gradient from the drop-down list.
The same procedure as above will be repeated for the Water Pollution CSV.
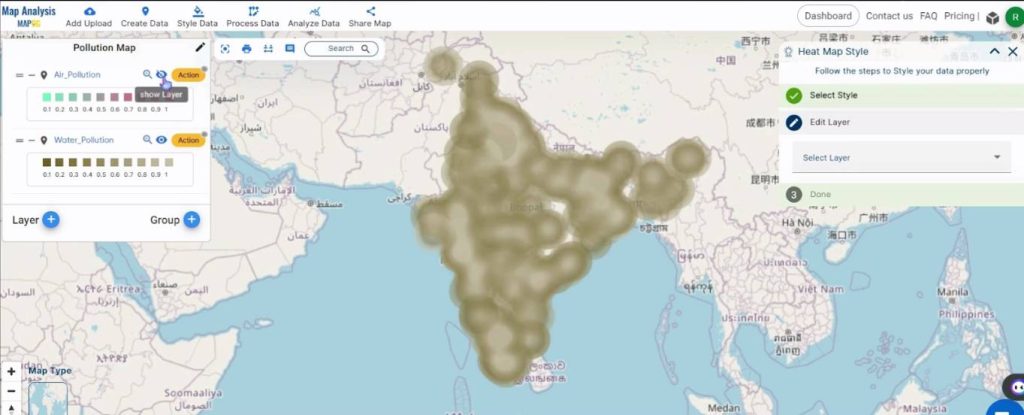
This is the final map.
Major Findings – Create a Map to Identify Pollution Affected Regions
The key findings derived from employing MAPOG for pollution heat mapping are as follows:
- Identification of Pollution Hotspots: MAPOG’s heat maps highlight regions with elevated pollution levels. This allows the clear identification of pollution hotspots. The visual representation aids decision-makers in pinpointing areas requiring immediate attention for pollution control measures.
- Spatial Distribution Analysis: The tool facilitates a detailed spatial distribution analysis of pollution across diverse regions. This analysis unveils distinct patterns, emphasizing the concentration of pollution in specific areas. Understanding the spatial distribution is critical for strategic environmental planning.
- City-Specific Pollution Trends: MAPOG’s heat maps reveal city-specific pollution trends, showcasing areas with consistently high pollution levels. This insight is invaluable for urban planners and policymakers in implementing targeted pollution control initiatives tailored to the unique challenges of each city.
- Integration of Varied Pollution Data: MAPOG seamlessly integrates diverse pollution datasets, covering air, water, and noise pollution. This comprehensive data integration ensures a holistic understanding of the environmental landscape thereby enabling decision-makers to address multiple pollution factors concurrently.
- Strategic Mitigation Planning: The heat maps contribute to the formulation of strategic pollution mitigation plans by highlighting regions significantly impacted by pollution. This allows decision-makers to allocate resources efficiently and implement tailored measures to combat environmental challenges effectively.
Domain and Industry
The beneficiaries of pollution mapping using MAPOG include:
- Environmental Agencies: Government and environmental agencies benefit from the identification of pollution hotspots, allowing them to implement targeted pollution control measures and formulate effective environmental policies.
- Public Health Sector: Insights derived from pollution heat maps assist the public health sector in anticipating and addressing health risks associated with pollution, leading to improved public health outcomes.
- Urban Planners: Urban planners can use pollution mapping to inform city development strategies, ensuring that future urban growth is sustainable and environmentally conscious.
- Researchers and Academia: The data generated by MAPOG’s pollution mapping provides valuable information for researchers and academia studying environmental trends, pollution patterns, and their impacts on ecosystems.
- Technology and GIS Solutions Providers: Companies specializing in GIS and mapping solutions benefit by offering advanced pollution mapping capabilities to their clients, enhancing the value of their services.
- Renewable Energy Sector: The renewable energy sector can identify pollution-affected regions for potential clean energy projects, contributing to sustainable development and a reduced environmental footprint.
- Communities and Residents: Residents in pollution-affected areas benefit from the identification of pollution sources, leading to targeted mitigation efforts and potential improvements in air, water, and noise quality.
- Industries Committed to Sustainability: Businesses with a commitment to sustainability can utilize pollution mapping insights to assess and minimize their environmental impact, aligning their operations with eco-friendly practices.
Conclusion
In conclusion, the application of MAPOG in pollution mapping emerges as a transformative tool and provides invaluable insights into environmental dynamics. The precision offered by MAPOG in identifying pollution hotspots and spatial distribution patterns equips decision-makers across various sectors to implement targeted and effective pollution control measures. The beneficiaries, ranging from government agencies and public health sectors to urban planners and communities, stand to gain from the nuanced understanding of pollution-affected regions. The combination of technology, GIS solutions, and environmental data contributes to a collective effort toward sustainable development and improved quality of life. As we navigate the complex landscape of environmental challenges, MAPOG stands as a strategic ally, empowering stakeholders to make informed decisions and foster a healthier, more sustainable future.
Other Articles
- Protecting Wetlands: Guide to Create GIS Map for Nature
- GIS Analysis in Urban Planning: Reshaping Transportation Future Insights of state/city
- Fast Emergency Response: Using GIS and Isochrone Maps for 10-Minute Ambulance Arrival
- Mapping Tiger Attack Hotspots – Create an Online Map and Share
- Make Routes for Military Aerial Planning- Through Bearing angle and Distance calculation – Online Route Compass
- Mapping Healthcare Efficiency: GIS Buffer Analysis of Hospital Locations
- Add WMS- Two step online view of WMS layer on a map
- Plot ATM locations on a map and embed on your website
- Map habitat locations of endangered animals & keep track of their living