In a rapidly evolving urban landscape, the ability to compare land use data from different regions is crucial for informed decision-making in urban planning. Fortunately, with the advent of Geographic Information Systems (GIS) like MAPOG, such comparisons have become not only possible but also remarkably efficient. MAPOG offers powerful tools like the category style option and clip tool, which play pivotal roles in facilitating this comparative analysis. Explore the application of MAPOG in wetland mapping-Protecting Wetlands: Guide to Create GIS Map for Nature.
Key Concept for Comparison of Land Use Patterns
This project revolves around leveraging MAPOG‘s category style options and clip tool to provide a comprehensive comparison of land use characteristics between two regions. By employing category style options to represent different land use categories with unique colors and utilizing the clip tool to isolate study areas, our research aims to uncover nuanced insights into the land use dynamics of these regions.
For more information on fast emergency response, check out our article – Fast Emergency Response: Using GIS and Isochrone Maps for 10-Minute Ambulance Arrival
Steps for Comparison of Land Use Patterns
Step 1 Upload the data
Navigating to the MAPOG map analysis tool, add the GIS data for our needs.
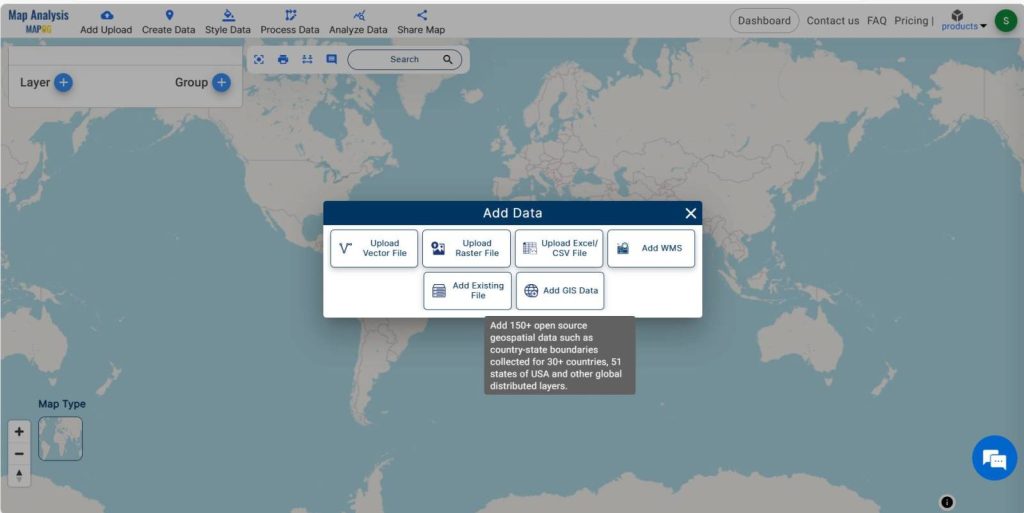
Transitioning to the MAPOG map analysis tool, we add the GIS data for our needs. MAPOG offers a wide range of data. Herein, the land use polygon data in an area are added. You may opt to manually select or utilize the AI search option for data addition.
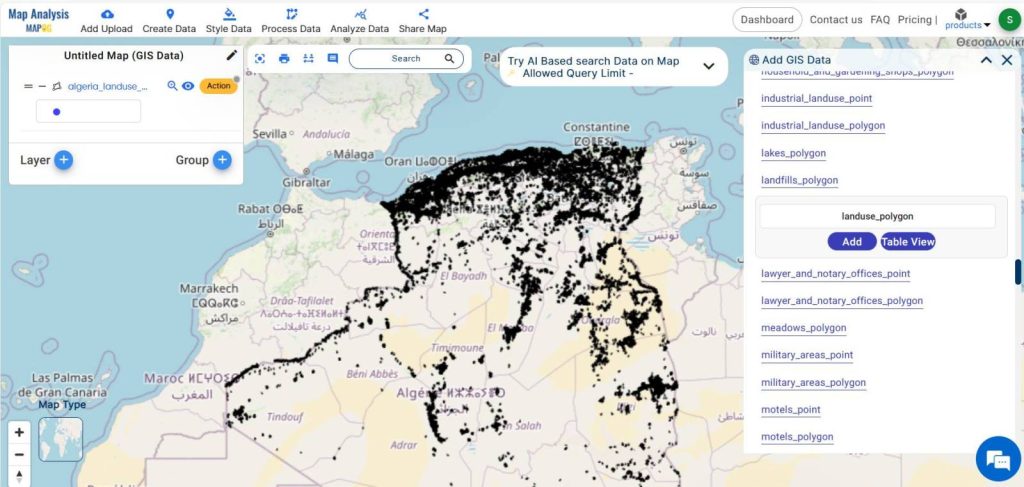
Selecting the data and adding them to the layer, the data in this area becomes visible on the screen.
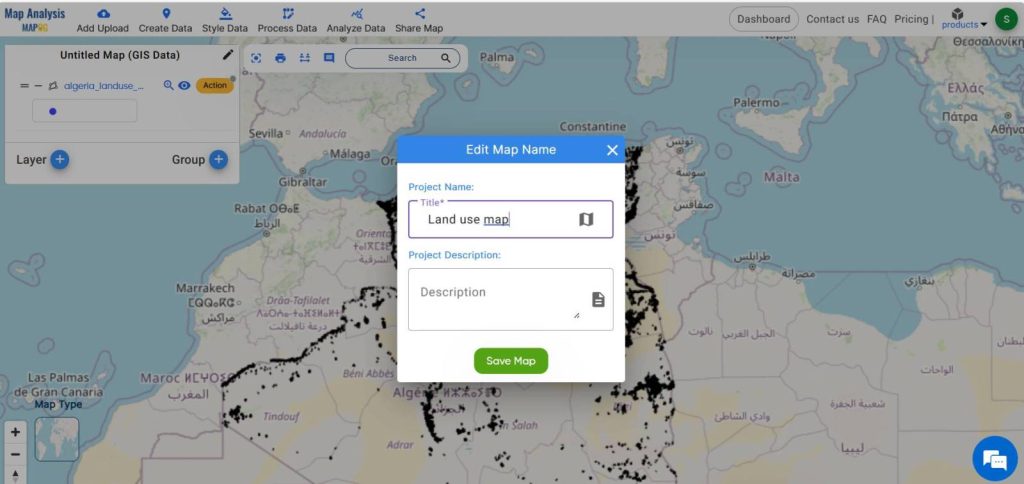
Step 2 Project Title
Give the project a title instead of leaving it untitled. Additionally, describe your project in the description box.
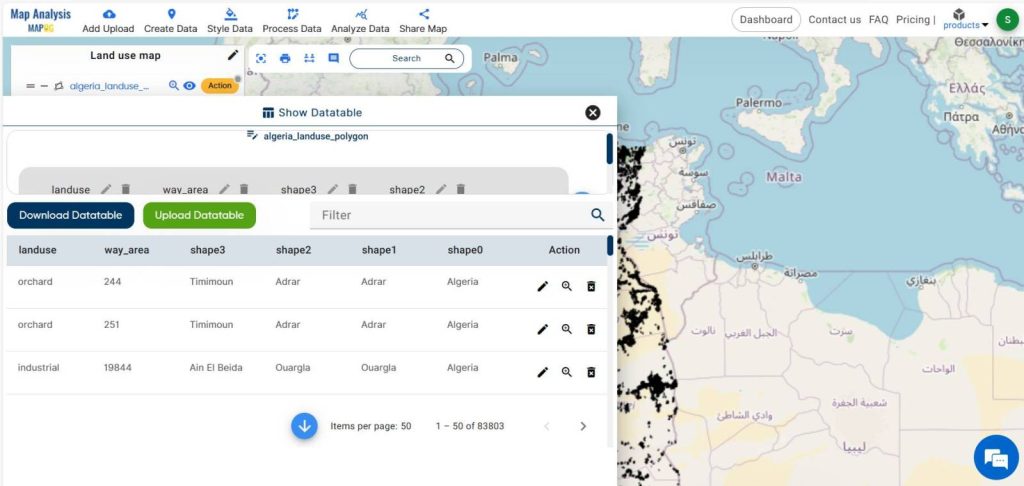
For more details about this data, move on to the action button of the associated data layer and click on the show datatable option.
Step 3-Styling
Using various colors, categorize land use patterns based on different categories.
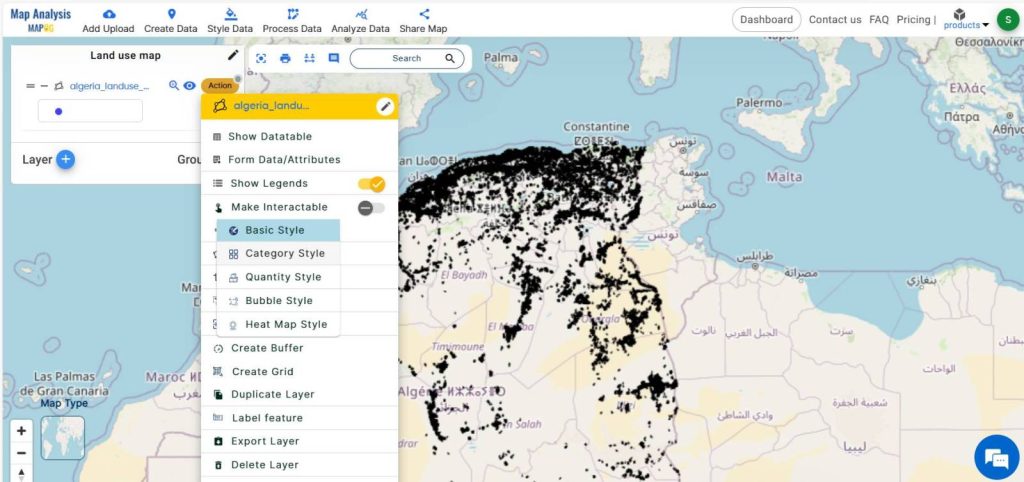
Proceed to the action button linked with the data layer and opt for the category style option.
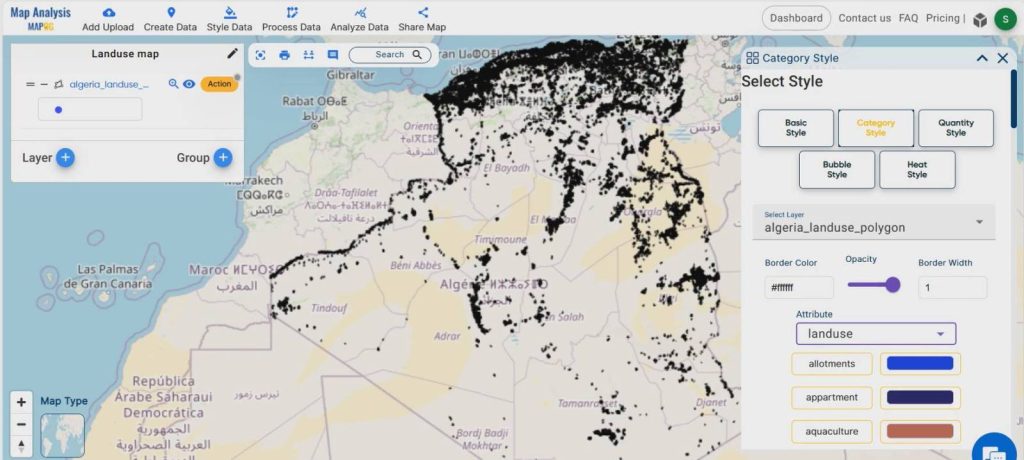
Select the attribute “land use” and choose suitable colors.
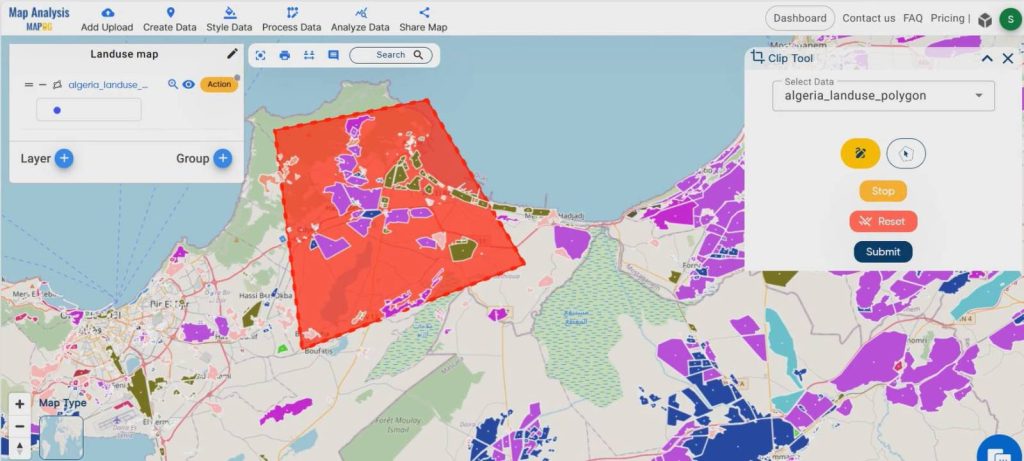
Step 4- Clip tool
To select a particular area of study, begin by accessing the process data menu and opting for the clip tool.
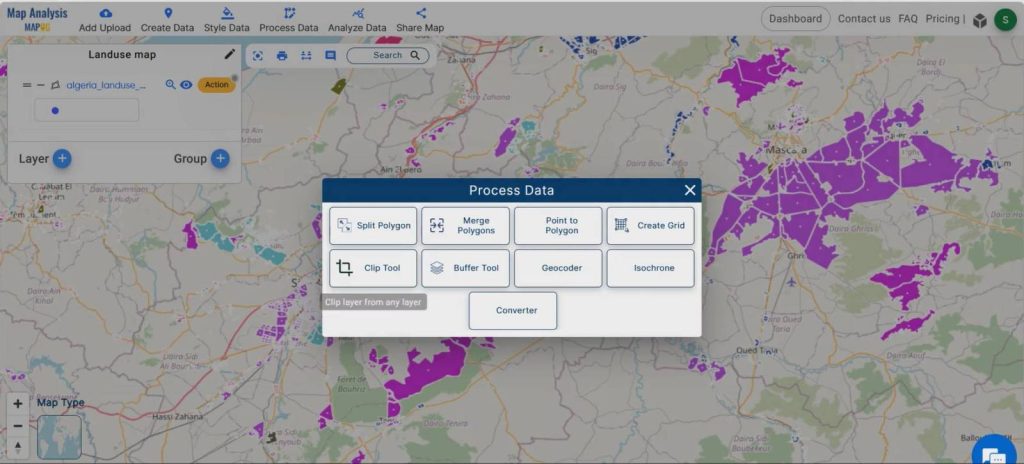
Proceed by selecting the layer you wish to clip and submitting the data. Additionally, choose another region to compare the land use.
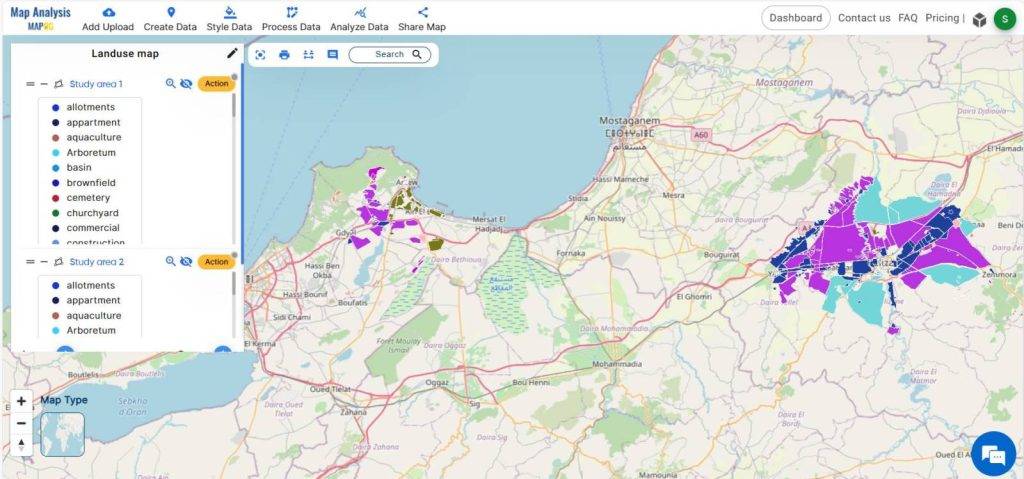
Subsequently, compare the two clipped regions utilizing the type of land use and other details provided in the data table.
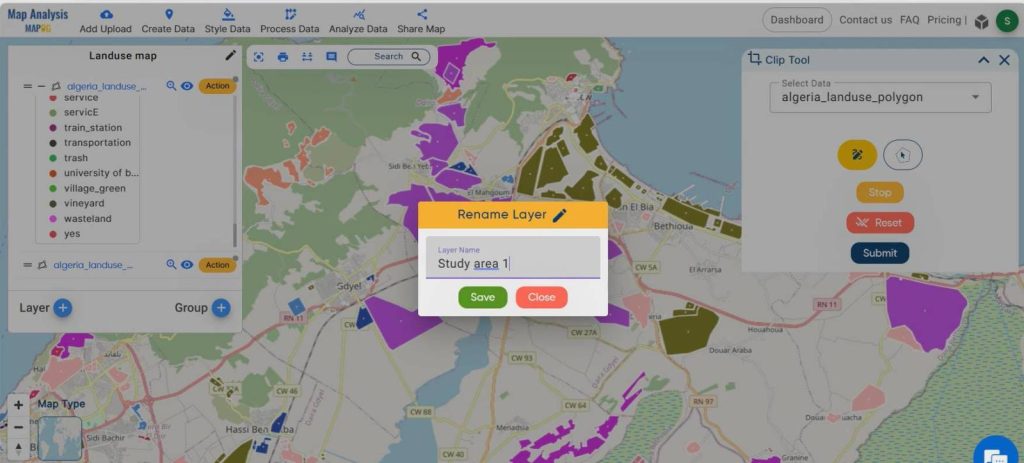
Step 5- Rename layer
Rename the clipped data layer as “Study area 1” and “Study area 2” for better understanding. For that, click on the action button associated with the clipped data layers and edit the layer name.
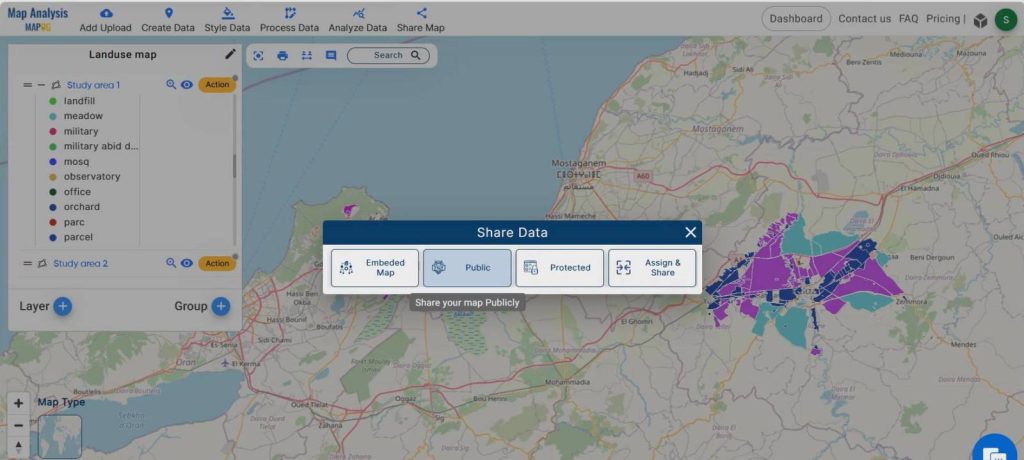
Step 6 -Share the Map
Share this map to public using share data menu.
Major Findings
- Enhanced Understanding
- Comparative Analysis
- Efficient Data Processing

Domain and Industry
This study holds significant implications for the domain of urban planning, where informed decision-making relies heavily on accurate data analysis. By utilizing MAPOG‘s capabilities, urban planners can gain valuable insights into land use dynamics, thereby facilitating more effective urban development strategies.
Conclusion
In conclusion, MAPOG provides a versatile platform for visualizing and analyzing raster data, offering valuable insights across various domains and industries. Its user-friendly interface and robust features enable efficient data exploration and decision-making processes. With applications ranging from environmental science to urban planning and beyond, MAPOG empowers users to unlock the full potential of spatial data analysis. Explore the diverse use cases and innovative possibilities offered by MAPOG to drive impactful solutions and advancements in your field. For further inquiries or assistance, reach out to us at support@mapog.com and embark on a journey of spatial exploration and discovery.
Are you interested in Habitat Mapping? Check this article-Map habitat locations of endangered animals & keep track of their living
GIS Data Links-Land use data