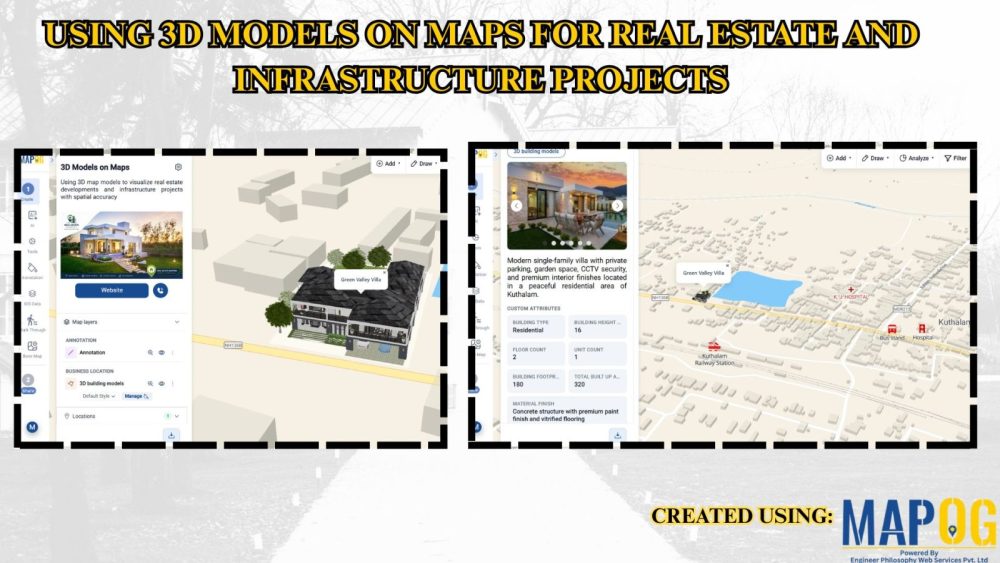
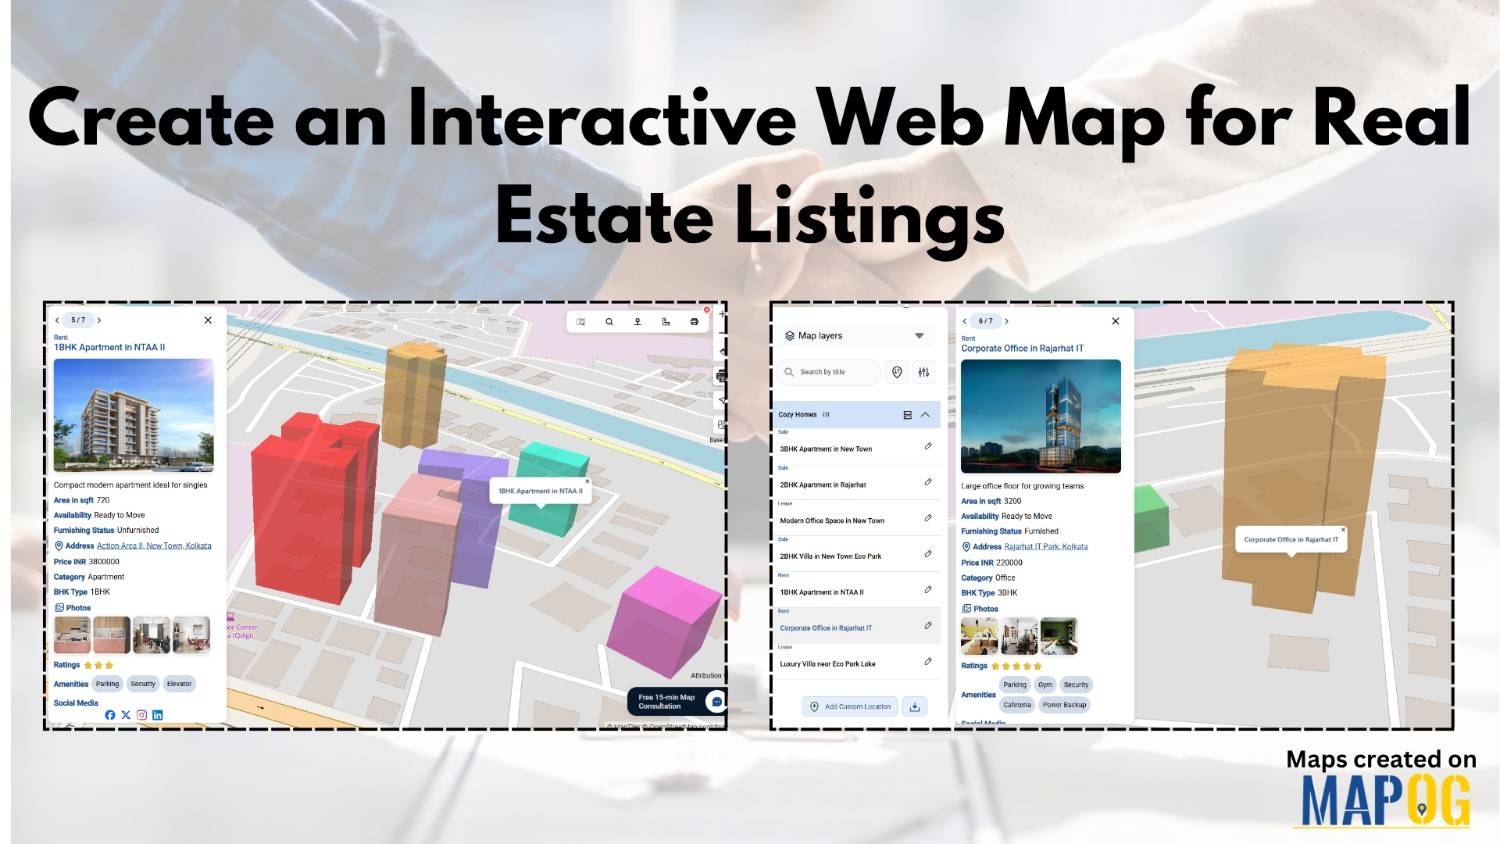
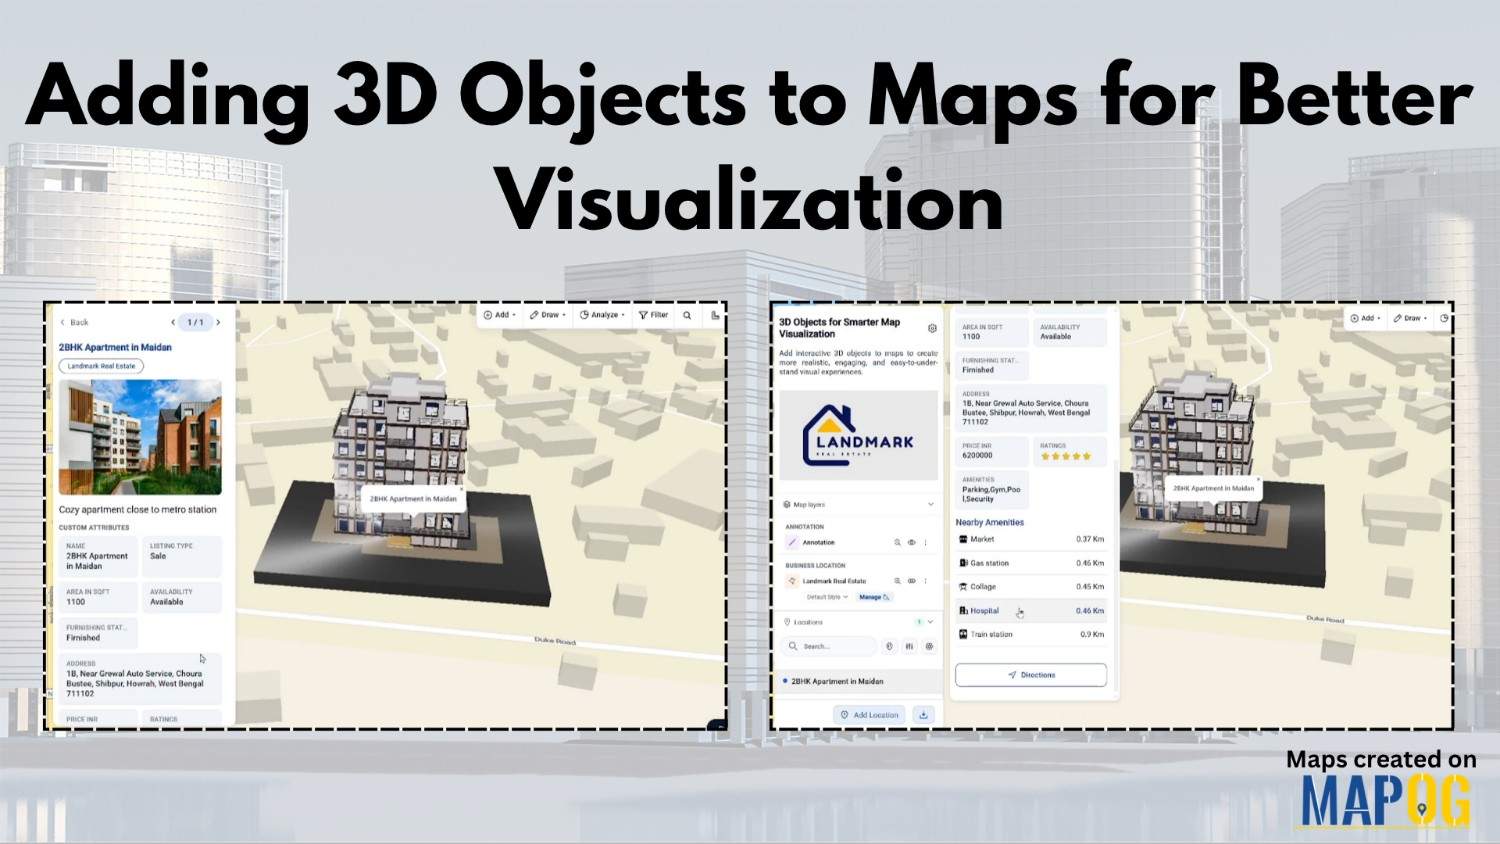
#mapog

Identify High-Density Customer Areas

How to Identify High-Density Customer Areas Using Interactive Maps

In every business, understanding where your customers truly come from can completely transform your growth strategy. Moreover, when you Identify High-Density Customer Areas, it becomes easier to plan expansion, target marketing efforts, and optimize logistics efficiently. For instance, imagine having a store in one area where only 20% of your customers are local, yet 80% … Read more

Add Call-to-Actions to Your Interactive Maps

Add Call-to-Actions to Your Interactive Maps

In today’s digital era, engagement drives attention—and interactive maps are no exception. While visualizing data or locations is powerful on its own, Add Call-to-Actions to Your Interactive Maps takes your maps to the next level. CTAs guide viewers toward meaningful interactions—whether it’s exploring a listing, booking a visit, learning more about a location, or contacting … Read more

analyze customer distribution

How to Analyze Customer Distribution Using Map Layers

In today’s competitive market, businesses thrive when they analyze customer distribution effectively. Therefore, understanding where your customers come from, how frequently they purchase, and how their spending patterns vary across regions becomes crucial. Moreover, this insight helps you make smarter sales and marketing decisions. Fortunately, interactive mapping with MAPOG simplifies this process even further, allowing … Read more

Switch Between Map Styles

Switch Between Map Styles to View Customer Trends, Hotspots & Spending Patterns

Transform raw data into interactive visuals showing customer locations, spending, and trends. Furthermore, Switch Between Map Styles reveals interactive map insights like top buyers, regional demand, and performance gaps, enabling faster, data-driven decisions without coding. Key Concept: Switch Between Map Styles However, by smoothly Switch map styles, you can easily explore one dataset from multiple … Read more

Create an Interactive Map with Photos & Details at Each Location

Attaching images & details to any kind of map provide a value that people could easily relate to themselves. For example, instead of scrolling through long property listings or dealing with brochures, MAPOG provides a platform to create interactive maps that makes it simple to display available real estate rooms, buildings, or commercial spaces on … Read more

How to Map Your Customers Using Interactive Layers

Map Your Customers with Interactive Layers: Visualize Buying Patterns, Performance & Growth in Minutes

Map your customers with interactive layers turns plain data into clear business insights. In fact, this approach visualizes buying patterns, engagement, and regional performance. Moreover, it helps identify loyal customers, new prospects, and high-value areas instantly. Key Concept: Map Your Customers Interactive customer mapping merges sales, location, and engagement data into one dynamic platform using … Read more

How to Use a Mapping Platform to Plan Travel Itineraries

How to Use a Mapping Platform to Plan Travel Itineraries

Planning trips becomes easier and more engaging through interactive travel itinerary mapping. In fact, mapping platforms transform travel ideas into clear, visual routes that anyone can follow. Moreover, these tools integrate destinations, routes, and data layers, allowing travelers to Plan Travel Itineraries efficiently and explore confidently. Key Concept: Plan Travel Itineraries Interactive mapping unites all … Read more

Dynamic Map

What Is a Dynamic Map and How to Create One Online

In today’s fast-paced, connected world, dynamic maps have become essential tools for navigating both everyday life and complex journeys. Unlike traditional static maps, dynamic maps are interactive and responsive i.e. they allow users to zoom, pan, click for details, and customize views with layers or markers. From urban planning to planning efficient routes, these digital … Read more

Showing map view of customer locations with popups, created after uploading excel data of customer list

How to Upload Your Customer List (CSV or Excel) and Plot It on a Map

When you upload your customer list in Excel or CSV format, you’re storing useful details like names, addresses, and service records, but the data stays flat. That’s because spreadsheets don’t show you where customers are clustered, which areas are under served, or how your field teams move across zones. As a result, it’s hard to … Read more

Cover page displaying interactive map presentation ready

How to Create Interactive Maps That Make Your Presentations Stand Out

To create interactive maps that make presentations stand out often runs into a familiar problem: spatial data gets flattened by static visuals. Bullet points can’t show movement. Charts miss relationships. And maps, when passive, lose their power to engage.This disconnect is especially clear when presenting franchise networks, logistics zones, or planning overlays. Without interactivity, audiences … Read more