In this article, we delve into the critical intersection of geographic data and financial accessibility. Leveraging the powerful capabilities of MAPOG Map Analysis, we explore how spatial join analysis unveils invaluable insights into the distribution of ATM points within district boundaries.
Join us as we navigate through the process of optimizing ATM placement to enhance accessibility and promote financial inclusion.
KEY CONCEPTS
Our goal is to create a map of ATM points within a district boundary and merge the datasets of ATM points with the district boundary to optimize accessibility and identify service gaps.
The Spatial Join tool helps us carry out the joining process smoothly.
This map can be used for further decision-making like Create Map, and Analyze: Optimizing Bank Branch Locations and the use of Datatables as in Online GIS Data Map Viewers and Table Visualizations
Steps for Creating Map of ATM Points within District Boundaries
Below are the steps to follow to create the map
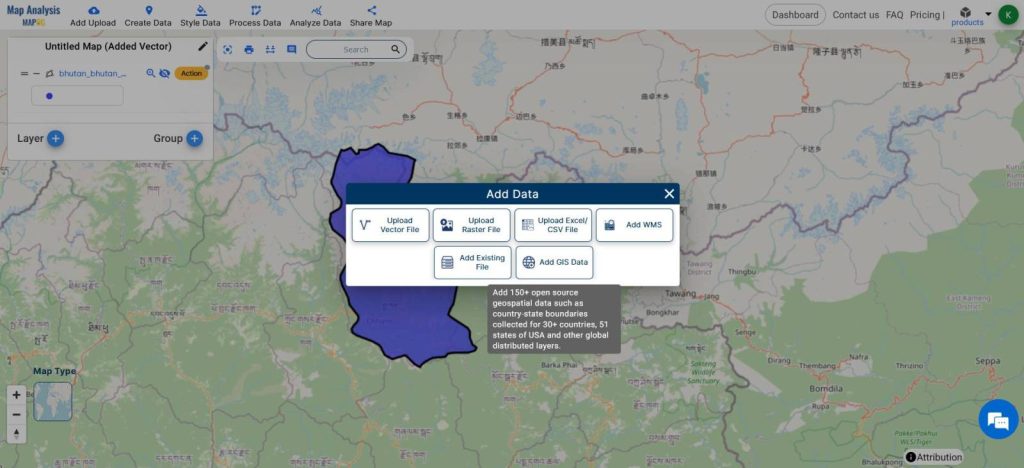
- Open Map Analysis
- From Add Upload, Add Vector Data
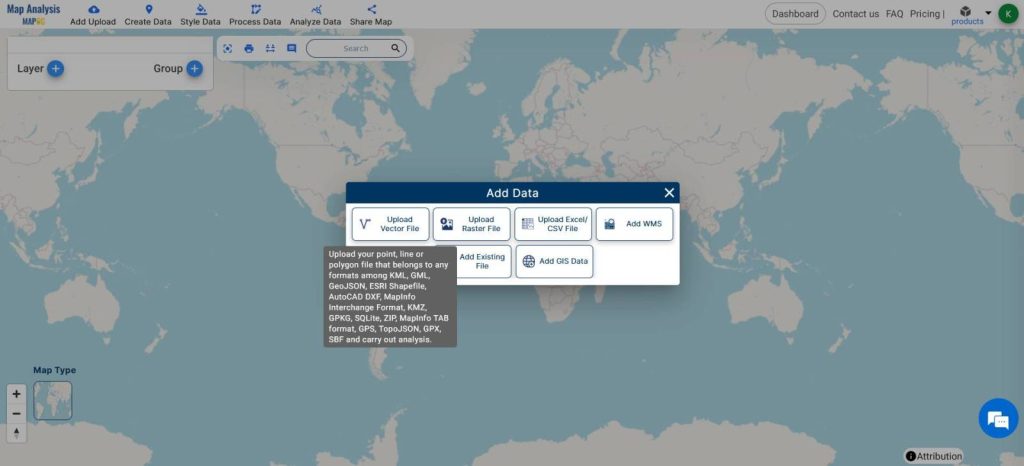
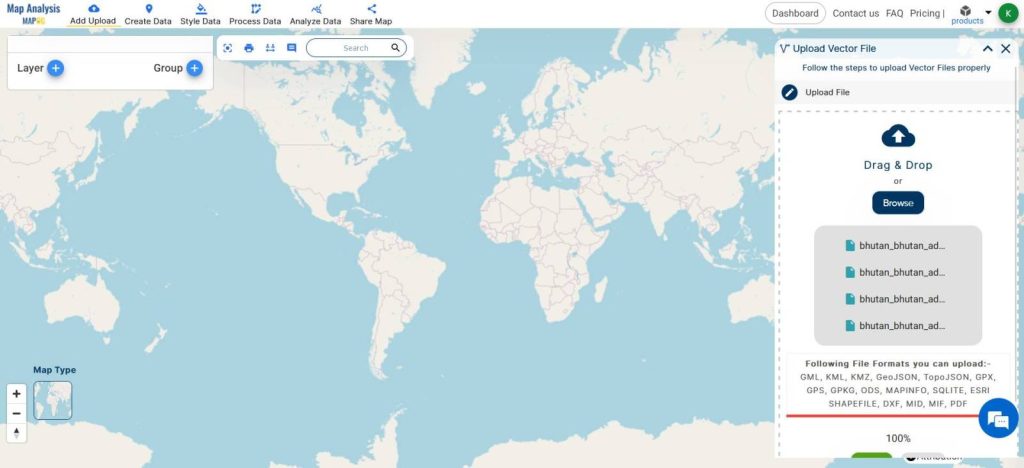
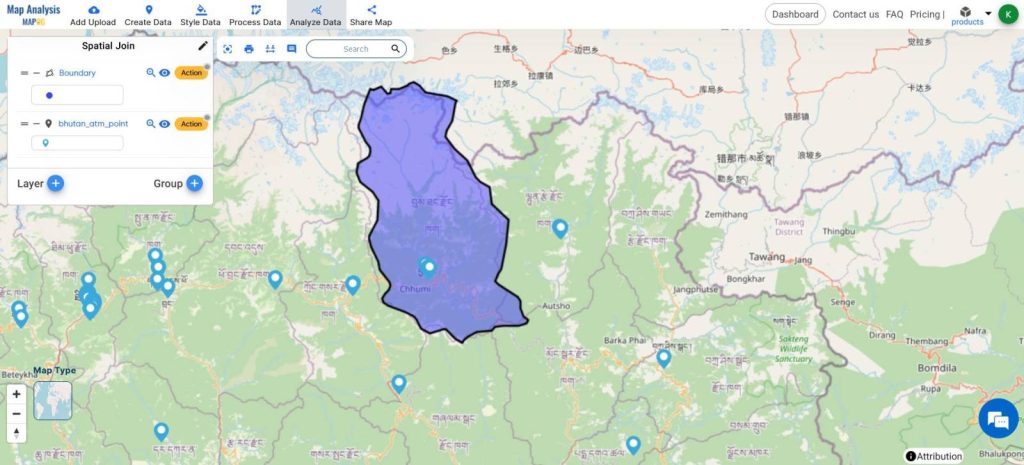
- Add GIS data of the ATM points
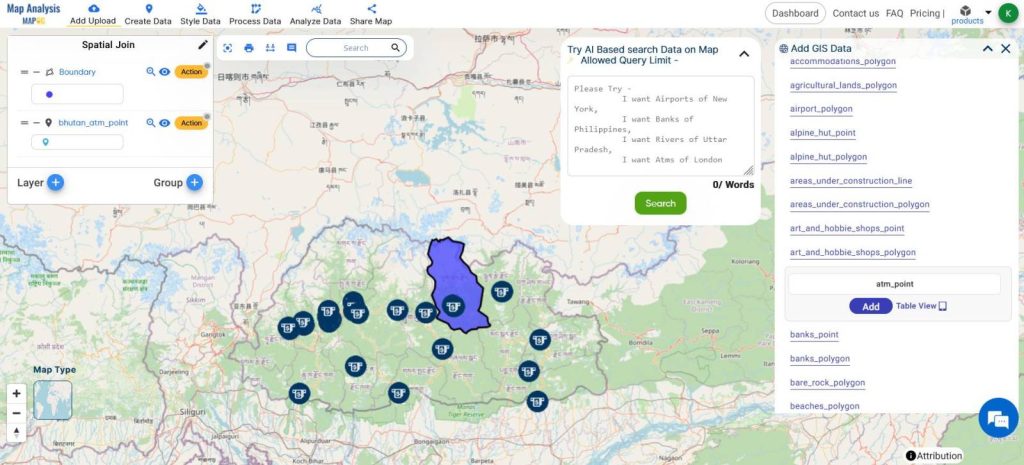
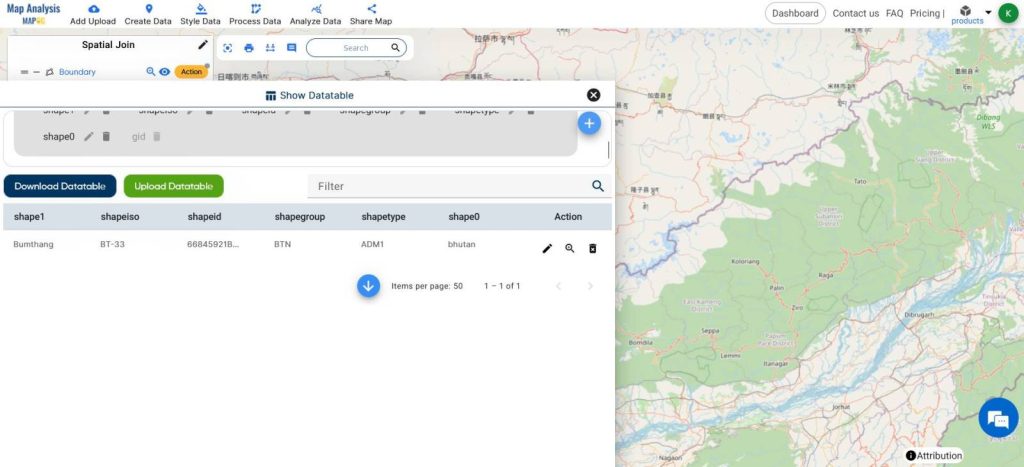
These are the Datatables of individual layers with specific attributes. Now We can join them using the Spatial Join Function.
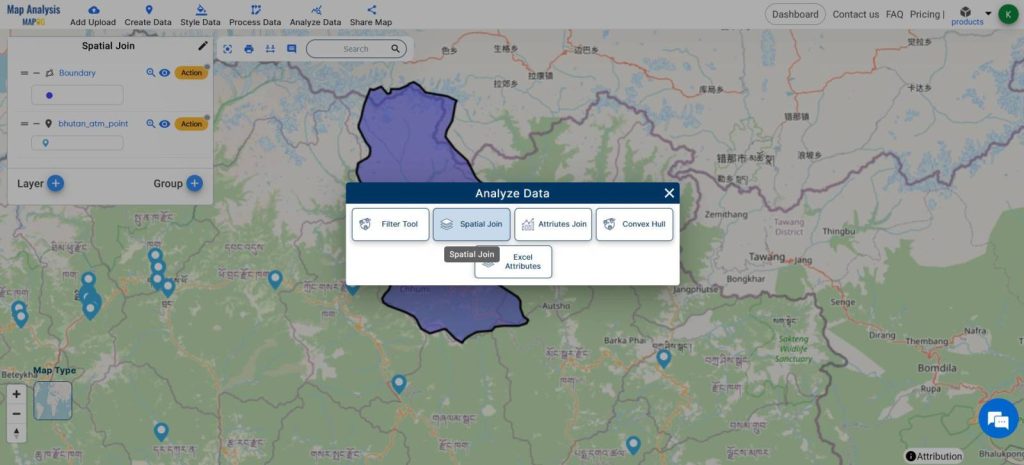
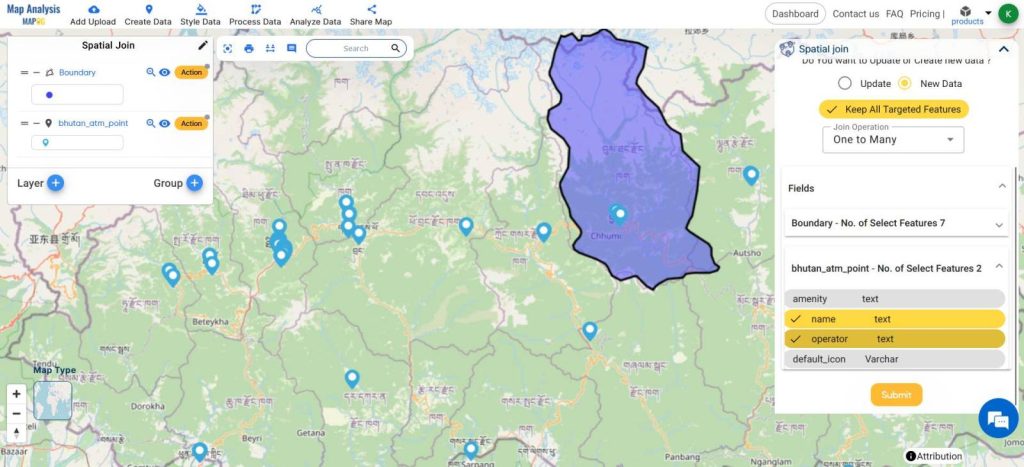
- From Analyze Data, select Spatial Join
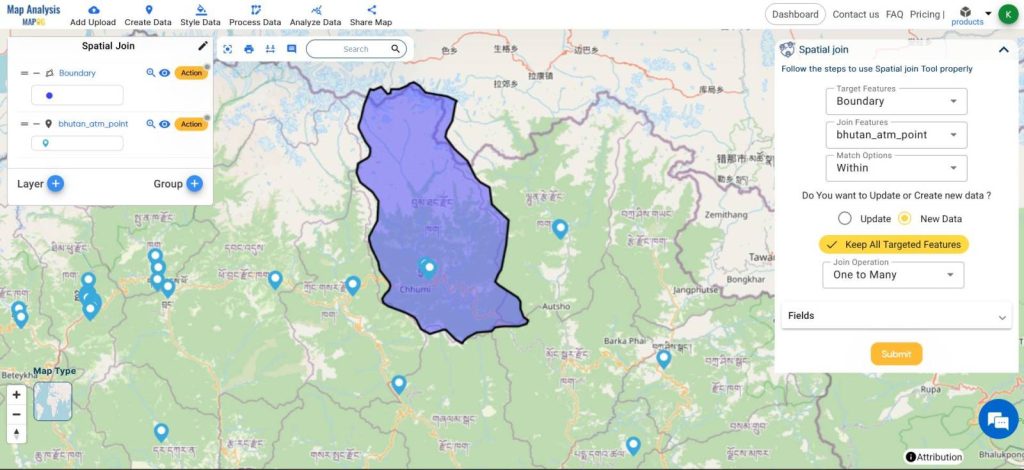
- Set the Boundary layer as the target feature
- ATM layer as the join feature
- Select WITHIN as the match option
- Click on New data
- Click Keep all targeted features
- Join operation one-to-many
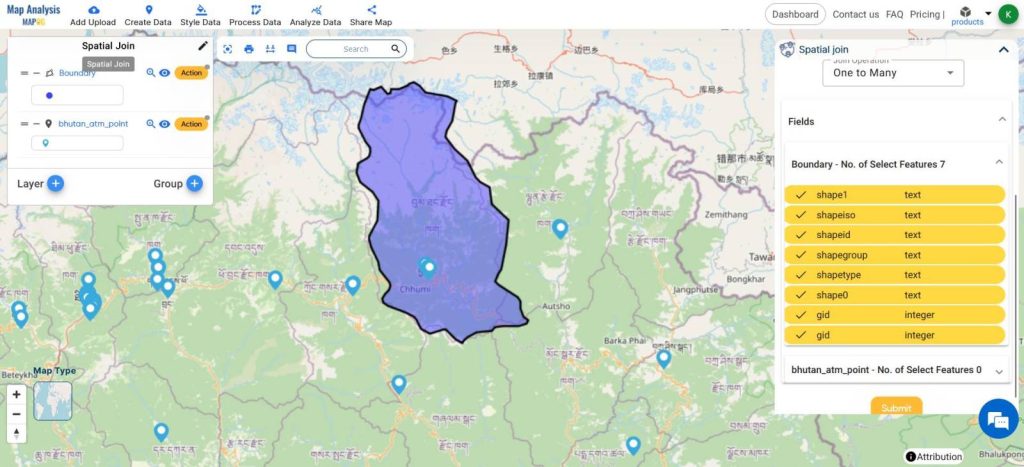
- Select the fields you want to join
- Click Submit
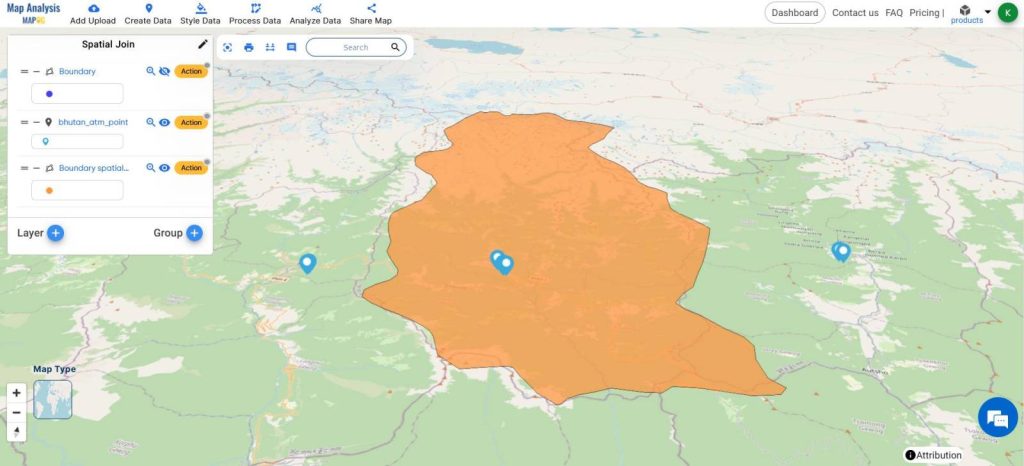
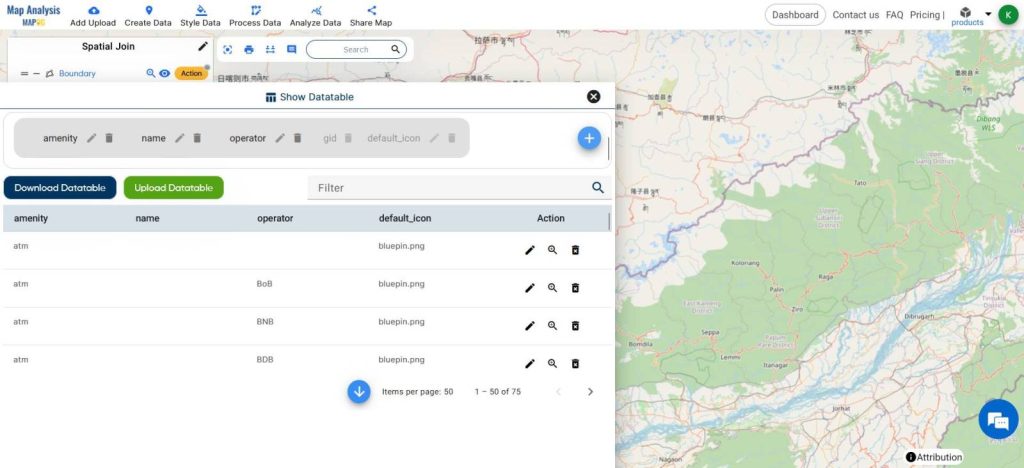
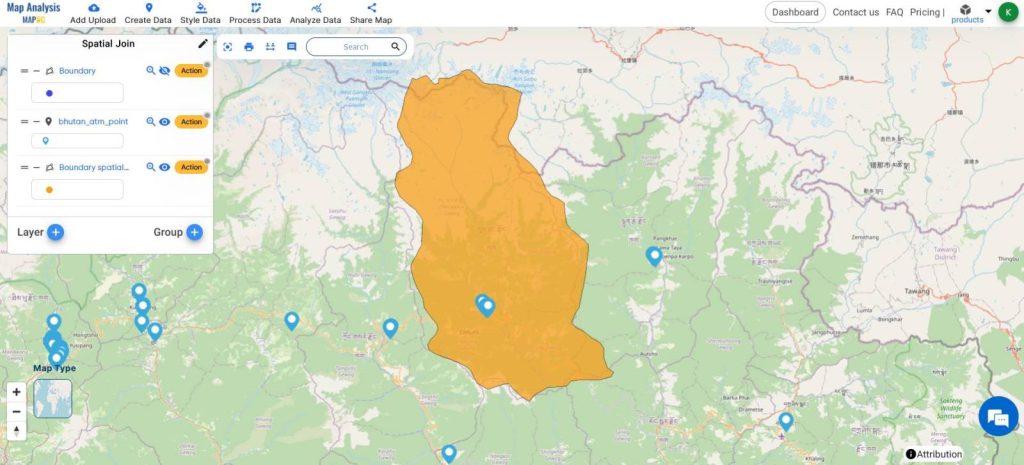
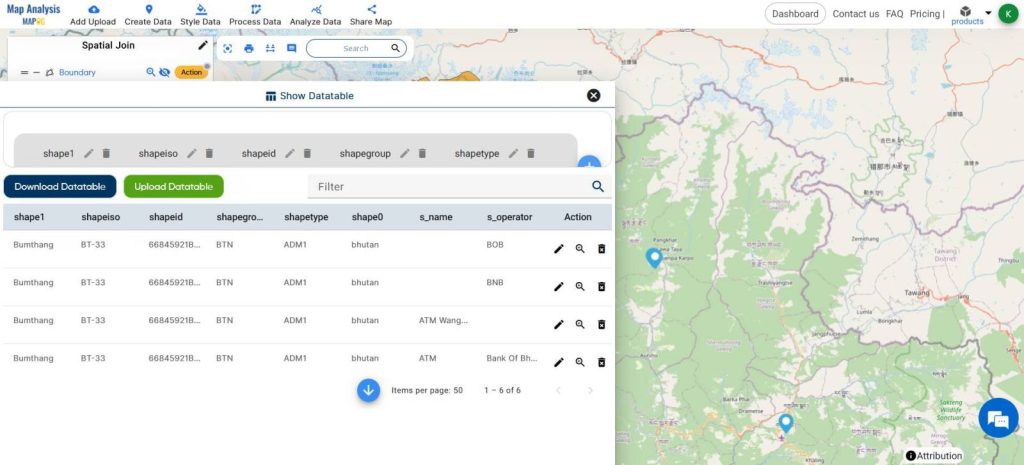
A new exact copy polygon will be created with the merged data table.
View that from Layer Action, show the data table
This is the Final Map

The advantage of conducting this analysis lies in its ability to pinpoint spatial patterns and disparities in ATM distribution within districts.
By understanding these patterns, policymakers and financial institutions can make informed decisions to optimize ATM placement, enhance accessibility, and promote financial inclusion effectively.
MAJOR FINDINGS
- Disparities in ATM Distribution: Spatial join analysis revealed significant disparities in ATM distribution across district boundaries, with certain areas with a higher concentration of ATMs compared to others.
- Optimal Placement Opportunities: MAPOG Map Analysis identified specific zones within districts where ATM accessibility was limited, presenting opportunities for financial institutions to strategically place ATMs and improve coverage in underserved areas.
- Policy Implications: These findings underscore the importance of evidence-based policymaking in promoting financial inclusion, with recommendations for policymakers to collaborate with financial institutions.
And leverage geospatial analysis tools like MAPOG to ensure equitable access to banking services for all residents within district boundaries.
BENEFICIAL DOMAIN: Financial Inclusion and Urban Development
- Financial Inclusion: By identifying areas with limited ATM accessibility within district boundaries, financial institutions can strategically allocate resources to improve coverage, thereby promoting financial inclusion and ensuring that all residents have convenient access to banking services.
- Urban Planning: This analysis provides valuable insights for urban planners and policymakers to optimize the placement of ATMs within districts.
These insights can inform decisions regarding zoning regulations, transportation planning, and community development initiatives to enhance the livability and accessibility of urban areas.
For any inquiries or support needs, feel free to contact us at support@mapog.com.
CONCLUSION
This analysis, powered by MAPOG Map Analysis, sheds light on critical aspects of ATM accessibility within district boundaries. By leveraging the effectiveness of spatial join techniques, we’ve uncovered valuable insights that can inform targeted interventions for promoting financial inclusion and optimizing urban infrastructure.
Moving forward, it’s clear that the combination of geospatial analysis tools like MAPOG and spatial join methods will continue to play a crucial role in shaping equitable and accessible communities.
GIS DATA USED
VIEW OUR PREVIOUS BLOGS
Create map online | Mapping Education Institute Places | Category Style based on type
Mapping and Coloring Regions of Country – Category Wise Style Your Map
Creating Quantity Style Map: Styling Natural Wealth