MAP STORY

Interactive Maps for Better Engagement

Why Businesses Are Switching to Interactive Maps for Better Engagement

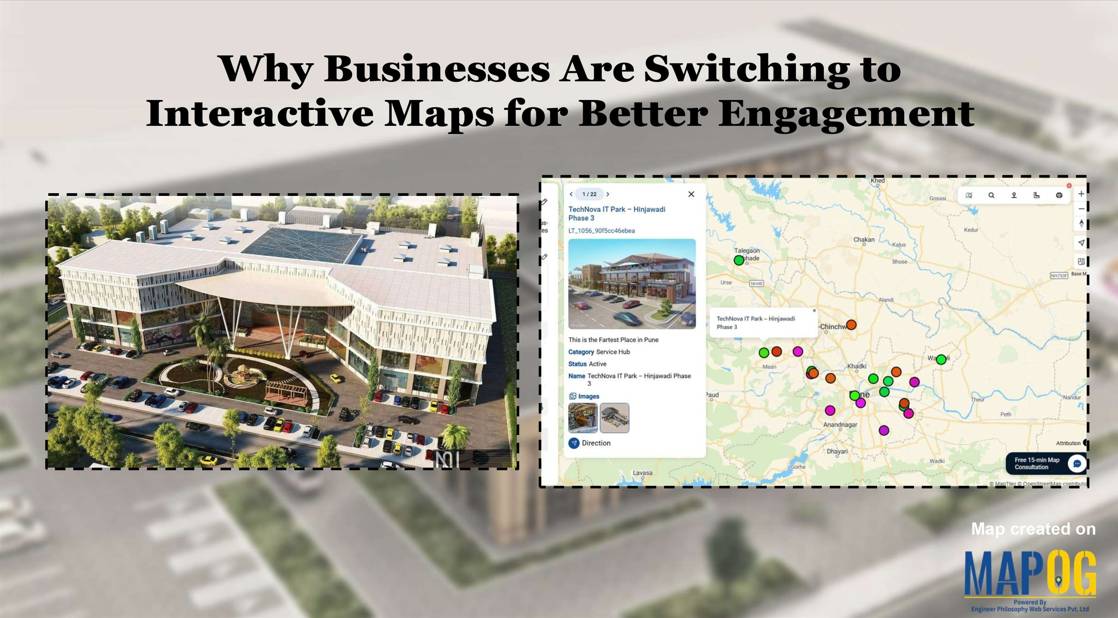
Businesses today are moving beyond static visuals and lengthy reports — they’re using interactive maps for better engagement to turn raw data into visual stories. From real estate firms displaying project portfolios to tourism companies mapping destinations, and logistics brands tracking operations, interactive mapping platforms like MAPOG are helping businesses communicate more effectively and engage … Read more

Attach Files Links & Images

Attach Files, Links & Images to Map Pins – History Map

Attach files, links, and images to map pins is what transforms a simple map into an interactive storytelling tool. Instead of limiting a pin to just coordinates and a title, you can enrich it with supporting documents, external references, or photographs with MAPOG. This makes maps not only visually engaging but also more useful—whether for … Read more

Uploading shapefiles

How to Import Shapefiles into an Online Mapping Tool

Shapefiles are a popular format for storing geographic data, often used in GIS to define boundaries, and spatial attributes. However, How to Import Shapefiles into an Online Mapping Tool can be complex and difficult to interpret for non-technical audiences or in decision-making processes. Importing shapefiles into MAPOG  transforms static data into interactive, shareable maps that … Read more

How to Sort Map Locations by Distance from Your Current Location

In today’s fast-paced, location-driven world, knowing exactly where things are in relation to you is essential. Whether it’s finding the nearest hospital during an emergency, locating a petrol pump while traveling, or discovering nearby restaurants and stores, thus being able to sort map locations by distance from your current location can save significant time and … Read more

How to Add POIs to Property Maps to Make Listings More Attractive

In today’s competitive real estate market, presentation is everything. Buyers and investors don’t just want to see where a property is—they want to understand what surrounds it. Adding Points of Interest (POIs) such as schools, restaurants, parks, hospitals, and transit hubs transforms simple property maps into a powerful storytelling tool. It helps viewers visualize lifestyle, … Read more

How to Filter Your Map Points Easily Using Category Filters

In a world where maps have become increasingly interactive and data-rich, organizing your map points is no longer just a “nice-to-have” feature — it’s essential. Whether you’re building a travel guide, a real estate visualization, or even a business dashboard, learning how to Filter Your Map Points easily using category filters can, therefore, make your … Read more

5 Essential Features Every Interactive Map Should Have

Interactive maps for tourism planning transforms raw data into dynamic visuals, helping manage tourism efficiently. Additionally, the 5 essential features every interactive map should have are Real-World Updates, Custom Icons & Labels, Heatmaps, Pop-Ups and Collaboration. Key Concept: interactive maps for tourism planning Interactive maps highlight attractions, heritage sites, hotels, and amenities while integrating layers like … Read more

Draw 3D Building Models Online – Interactive Map Tutorial for Urban Planners & Developers

As cities evolve into smarter, data-driven ecosystems, interactive 3D building visualizations are transforming the way we explore and understand urban spaces, and learning how to draw 3D buildings has become an essential skill in this transformation. Whether used for dynamic urban planning, immersive real estate showcases, or engaging educational projects, 3D models turn ordinary maps … Read more

Control Who Can View or Edit Your Map (Public, Private, Team)

In a data-driven landscape, controlling access to your interactive maps is crucial for collaborative projects and client solutions. Unlike static images, interactive maps offer real-time information sharing. MAPOG  facilitates this by allowing users to view or edit your Map & provide permissions through its Preview & Share and add user features, ensuring secure and efficient … Read more

Color-Code Map Points by Category (Online, No-Code)

To begin with, Color-Code Map Points is a simple yet powerful way to transform raw data into clear, visual insights. Moreover, this approach enables governments, planners, and communities to classify projects, services, or assets into instantly understandable categories on a single interactive map. As a result, we can instantly track and visualize metro stations in … Read more