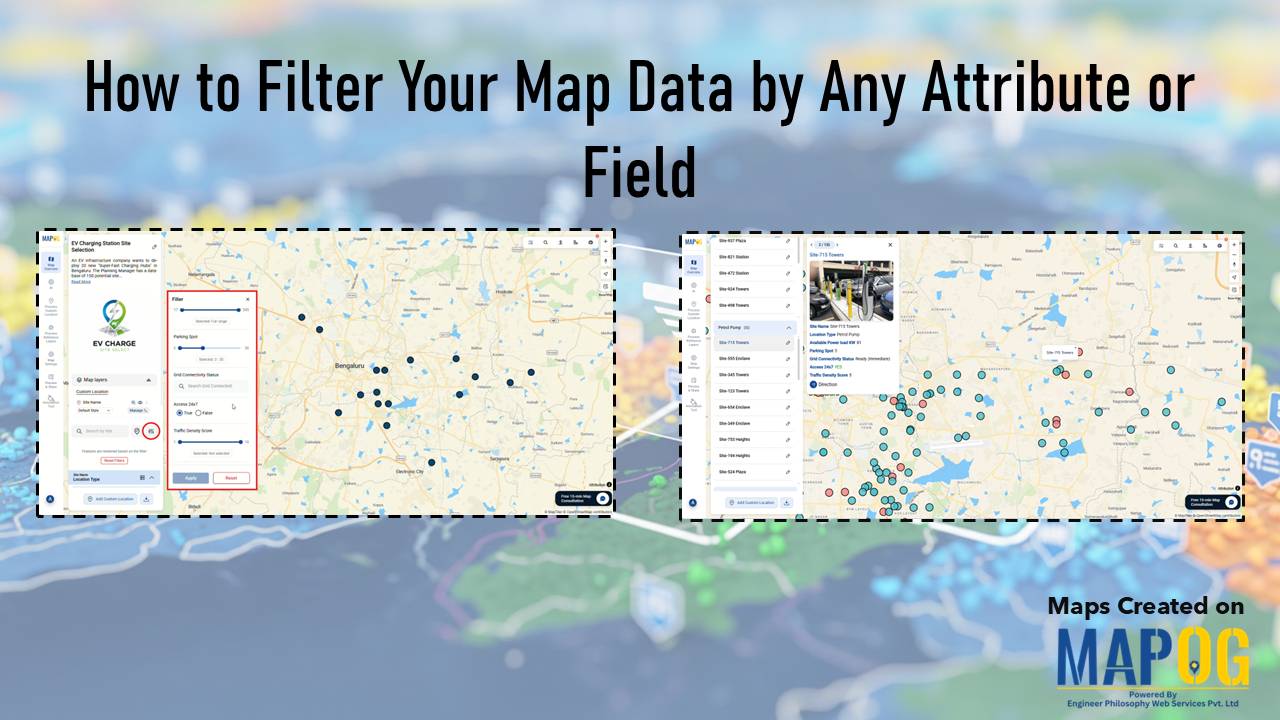
MAP STORY

analyze customer distribution

How to Analyze Customer Distribution Using Map Layers

In today’s competitive market, businesses thrive when they analyze customer distribution effectively. Therefore, understanding where your customers come from, how frequently they purchase, and how their spending patterns vary across regions becomes crucial. Moreover, this insight helps you make smarter sales and marketing decisions. Fortunately, interactive mapping with MAPOG simplifies this process even further, allowing … Read more

Interactive Maps vs Static Maps: Which One Helps Travelers More?

Interactive Maps vs Static Maps: Which One Helps Travelers More?

When you plan a journey, visuals make all the difference. Traditional paper or static digital maps can show directions, but they often fall short of engagement. That’s where interactive maps come in. In the debate between interactive maps vs static maps, interactive ones clearly offer more flexibility, storytelling potential, and real-time exploration. Using MAPOG, travelers … Read more

Create an Interactive Map with Photos & Details at Each Location

Attaching images & details to any kind of map provide a value that people could easily relate to themselves. For example, instead of scrolling through long property listings or dealing with brochures, MAPOG provides a platform to create interactive maps that makes it simple to display available real estate rooms, buildings, or commercial spaces on … Read more

How to Map Your Customers Using Interactive Layers

Map Your Customers with Interactive Layers: Visualize Buying Patterns, Performance & Growth in Minutes

Map your customers with interactive layers turns plain data into clear business insights. In fact, this approach visualizes buying patterns, engagement, and regional performance. Moreover, it helps identify loyal customers, new prospects, and high-value areas instantly. Key Concept: Map Your Customers Interactive customer mapping merges sales, location, and engagement data into one dynamic platform using … Read more

3 Easy Ways to Add Story Points and Narratives to Your Map

Adding story points and narratives to your map transforms it from a simple visual into an interactive story. Rather than displaying locations, you connect each point with details like descriptions, photos, etc. MAPOG, provides 3 easy ways to add story points making it easy and flexible; you can do it by uploading Excel or CSV … Read more

How to Create a Shareable Map Portfolio from Excel/CSV Data

Create a shareable map portfolio from Excel/CSV data to bring your projects to life in a visually compelling way. Although spreadsheets are excellent for storing detailed information, they often fall short in conveying the scale, diversity, and geographic reach of your work. While using MAPOG, you can transform that same data into an interactive map … Read more

How to Use a Mapping Platform to Plan Travel Itineraries

How to Use a Mapping Platform to Plan Travel Itineraries

Planning trips becomes easier and more engaging through interactive travel itinerary mapping. In fact, mapping platforms transform travel ideas into clear, visual routes that anyone can follow. Moreover, these tools integrate destinations, routes, and data layers, allowing travelers to Plan Travel Itineraries efficiently and explore confidently. Key Concept: Plan Travel Itineraries Interactive mapping unites all … Read more

Showing map view of customer locations with popups, created after uploading excel data of customer list

How to Upload Your Customer List (CSV or Excel) and Plot It on a Map

When you upload your customer list in Excel or CSV format, you’re storing useful details like names, addresses, and service records, but the data stays flat. That’s because spreadsheets don’t show you where customers are clustered, which areas are under served, or how your field teams move across zones. As a result, it’s hard to … Read more

final visuals of GeoJSON data on an interactive map

How To Visualize GeoJSON Data On Interactive Maps

Trying to visualize GeoJSON data can be challenging when moving from raw spatial data to an interactive map. Although GeoJSON is widely used to store geographic features and attributes, it lacks built-in styling and interactivity. This makes raw files difficult to interpret, especially for non-technical audiences. Moreover, converting GeoJSON into a usable map often requires … Read more

Cover image showing how to create 3D building maps online without coding.

How to Create 3D Building Maps Online Without Coding

To create 3D building maps online without coding once felt out of reach, especially for field teams or planners without access to costly software. Yet in disaster-prone or rapidly changing areas, visualizing buildings in 3D is often essential. It helps people assess risk, communicate clearly, and act faster. That’s where MAPOG comes in: a GIS … Read more