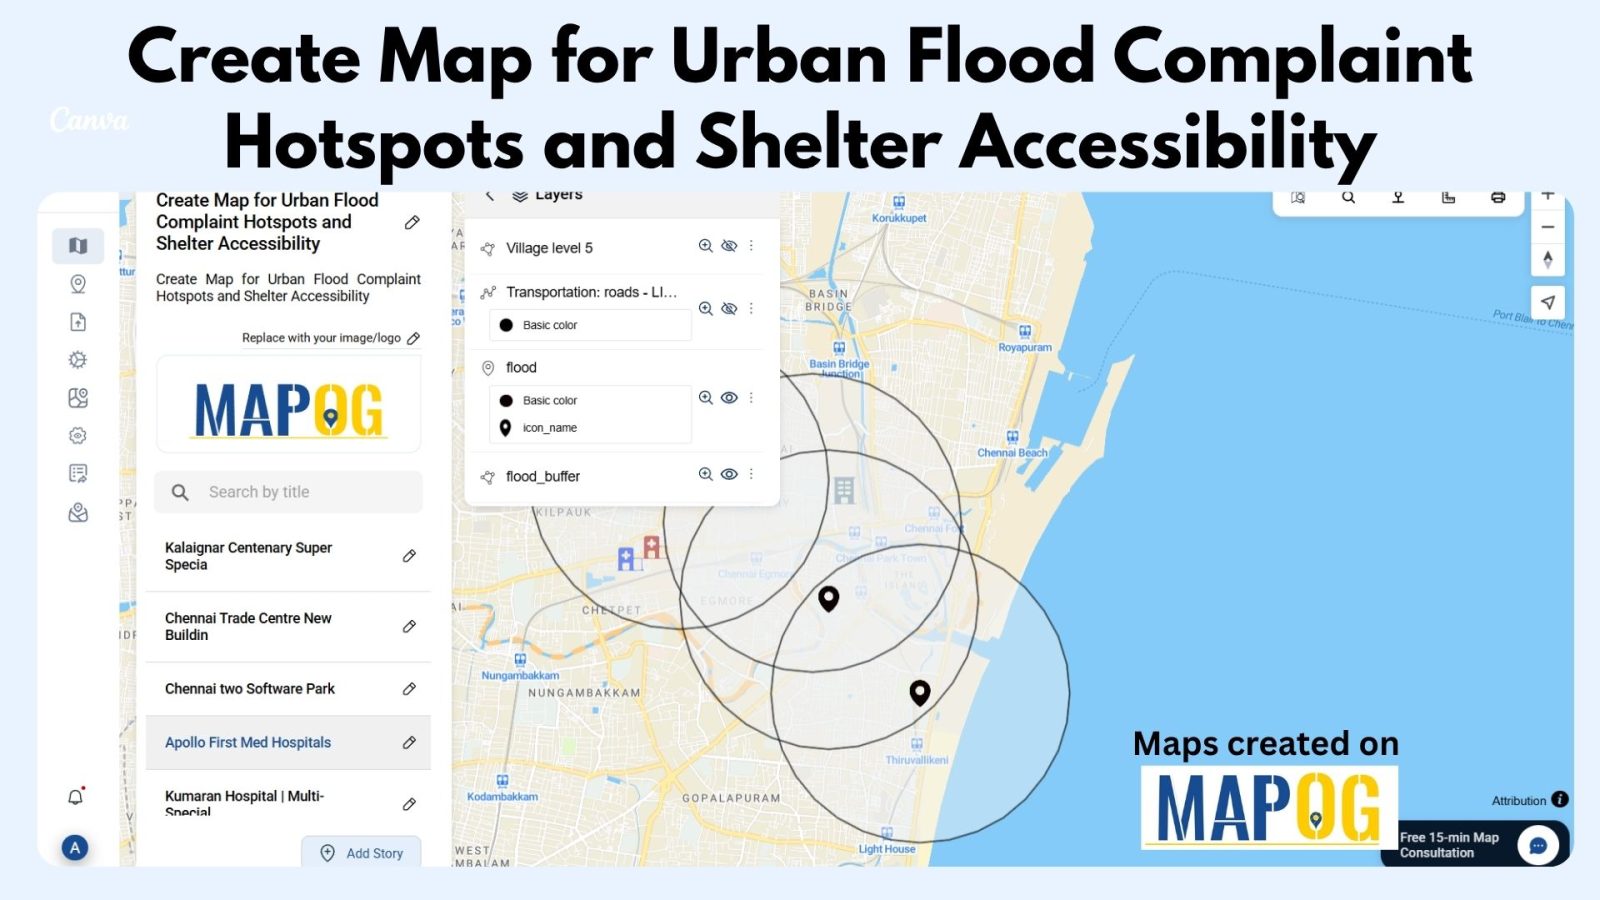
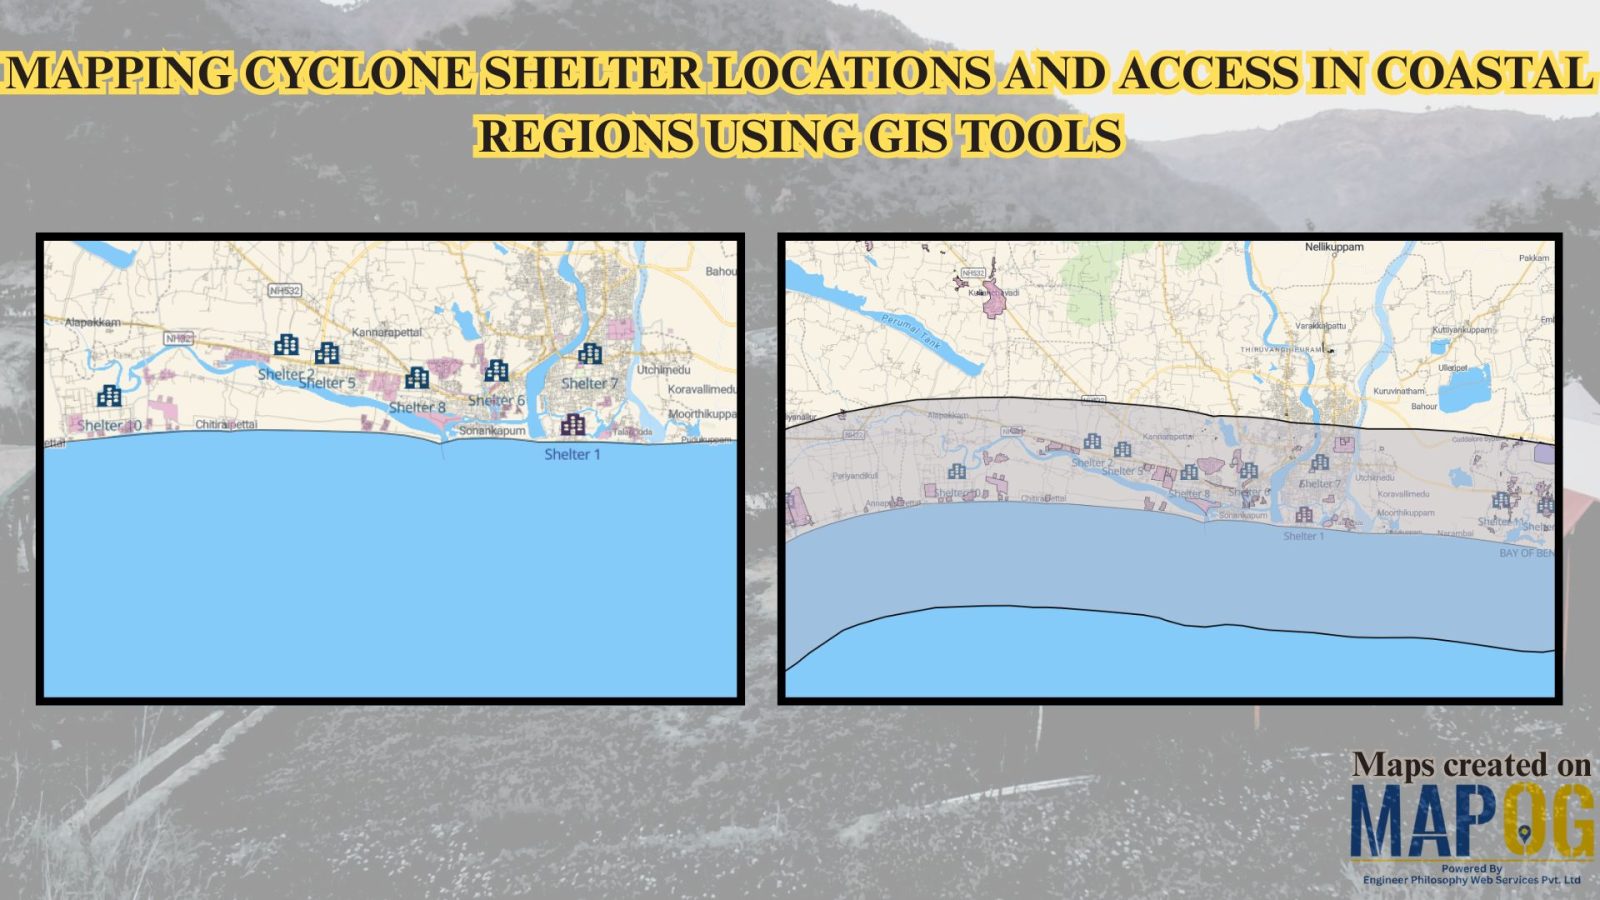
Education

Mapping Noise Pollution Levels in Cities Using Heat Maps and Buffer Tools

Mapping Noise Pollution Levels: Using Heat Maps and Buffer Tools

Noise pollution is an increasingly critical yet often overlooked environmental challenge. In urban areas, it stems primarily from traffic, construction, railways, and industrial activities. Fortunately, with the rise of Geographic Information Systems (GIS) especially tools like heat maps and buffer zones for Mapping Noise Pollution Levels. We can now visualize these invisible pollutants. As a … Read more

Create an Online Map to Visualize and Collaborate on the 7 Wonders of the World

Learn geography & history by creating an interactive map that highlights the 7 Wonders of the World.

Discover geography and history by creating an interactive map of the 7 Wonders of the World—ideal for students, educators, and explorers. These iconic sites highlight human creativity, engineering, and cultural identity, each reflecting the unique legacy of its civilization. Using Geographic Information Systems (GIS), you can combine geography, history, and travel planning into an engaging … Read more

How to Create a Travel Itinerary on a Map and Share It Online

How to Create a Travel Itinerary on a Map and Share It Online

If you’re planning your next big adventure, there’s one thing you shouldn’t skip—how to create a travel itinerary on a map and share it online. It not only helps you stay organized but also allows your friends or travel buddies to follow along in real-time. With intuitive platforms like MAPOG, it’s now easier than ever … Read more

Travel Route Planning Made Simple with Story Maps

Travel Route Planning Made Simple with Story Maps, Story maps are a creative way to integrate storytelling and geographic data, enabling users to see events, experiences, and manage plans on an interactive map combine narrative text, multimedia, and maps to produce a dynamic, captivating format that improves comprehension and sharing. Users can view events, experiences, … Read more

Population Density Map by Districts

How To Create Population Density Map by Districts

Visualizing population density map by districts helps uncover patterns in urban growth, resource distribution, and planning needs. Whether you’re working on development plans, healthcare access, or disaster preparedness, mapping this data by district brings clarity that raw tables cannot. Thanks to MAPOG, users can create, style, and share interactive maps easily—no advanced GIS degree needed. … Read more

Power Grid and Infrastructure mapping and planning using GIS

Power Grid and Infrastructure mapping and planning using GIS

Geographic Information Systems (GIS) are revolutionizing power grid mapping and infrastructure planning. By linking geospatial intelligence with electrical grid data, GIS enables utility companies and energy planners to visualize, assess, and optimize power distribution networks. Furthermore, it supports everything from the planning of substations and transmission lines to the ongoing monitoring of grid performance. As … Read more

Mapping Top National Parks: Preserving Nature

Mapping Top National Parks: Preserving Nature

Mapping Top National Parks play a vital role in conserving biodiversity and protecting natural landscapes while offering recreational opportunities that connect people with the environment. Additionally, these protected areas serve as sanctuaries for endangered species, geological wonders, and cultural heritage. From towering mountain ranges to vast desert expanses, national parks also support sustainable tourism, scientific … Read more

Cloud-Based Platform to Create and Share Map-Based Stories

Cloud Mapping Platform – Create & Share Map Stories Online

In today’s digital age, a cloud mapping platform transforms storytelling into an immersive, interactive experience. With MAPOG, you can create story maps on the cloud effortlessly—no GIS expertise needed. Whether you’re a student, planner, or traveler, our cloud-first approach brings your data to life through visual storytelling. Why Use a Cloud Mapping Platform Like MAPOG … Read more

Greatest Invention Across the World - A story Map

Greatest Inventions Across the World – A Story on the Map

Human history is full of brilliant inventions that changed how we live, communicate, travel, and think. In this Greatest Inventions on Map story, we explore where these breakthroughs happened and how they shaped the world. What if you could explore these game-changing innovations visually?With Story by MAPOG, we created an interactive map showcasing 10 groundbreaking … Read more

How GIS Helps in Monitoring Climate Change and Its Impact

How GIS is Transforming Climate Change Monitoring and Impact Analysis

GIS (Geographic Information Systems) plays a critical role in tracking, analyzing, and visualizing the climate change and its impact. By integrating satellite imagery, environmental sensors, and spatial data, GIS enables scientists, policymakers, and environmental organizations to understand complex climate patterns and their effects on ecosystems and human communities. It supports long-term monitoring, predictive modeling, and … Read more