Easy Map Creation

How to Plot Borewell Data

How to Plot Borewell Data on a Map All at Once Without Manual Entry

In water resource projects, visualizing borewell data is crucial for informed decision-making. Manual plotting, however, is tedious and error-prone. The ability to plot borewell data on a map simultaneously, without manual entry, makes the process faster and more reliable. MAPOG simplifies this through features like “Add by uploading CSV/Excel” and integrated task management. This then … Read more

5 Essential Features Every Interactive Map Should Have

Interactive maps for tourism planning transforms raw data into dynamic visuals, helping manage tourism efficiently. Additionally, the 5 essential features every interactive map should have are Real-World Updates, Custom Icons & Labels, Heatmaps, Pop-Ups and Collaboration. Key Concept: interactive maps for tourism planning Interactive maps highlight attractions, heritage sites, hotels, and amenities while integrating layers like … Read more

Color-Code Map Points by Category (Online, No-Code)

To begin with, Color-Code Map Points is a simple yet powerful way to transform raw data into clear, visual insights. Moreover, this approach enables governments, planners, and communities to classify projects, services, or assets into instantly understandable categories on a single interactive map. As a result, we can instantly track and visualize metro stations in … Read more

Convert Excel/CSV to an Interactive Map (Free, No-Code)

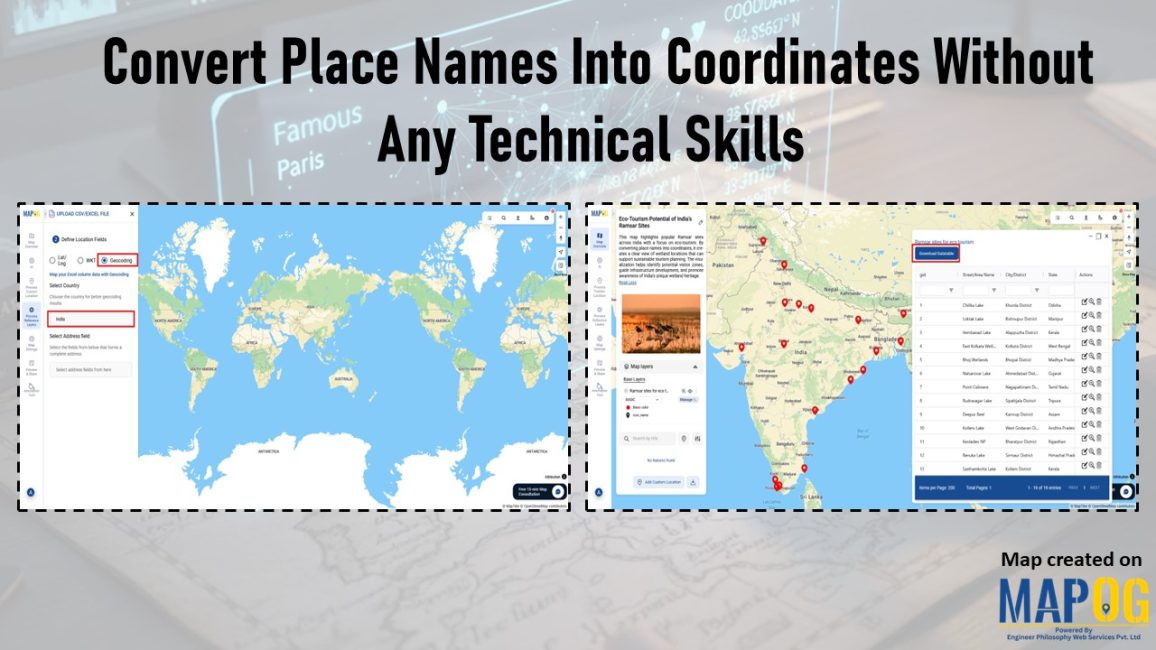
Converting Excel/CSV into an interactive map is a practical method for visualizing location-based information without programming skills. In other words, users upload spreadsheet data , such as addresses, coordinates, or place names into a mapping platform that displays it spatially. Therefore, no-code tools like MAPOG make this process accessible enabling users to geocode locations, categorize … Read more

Monitor & Maintain CCTV Installations with Interactive Maps

Monitor & Maintain CCTV Installations with Interactive Maps

Running a CCTV Installation Map helps businesses manage hundreds of camera sites, clients, and service requests efficiently. Traditionally, companies relied on Excel sheets, WhatsApp chats, or handwritten registers, which made tracking installations confusing. But managing installations, clients, and service records in scattered places quickly becomes confusing. That’s where an interactive map comes in — a … Read more

Change Map Icons & Sizes Based on Your Data Values

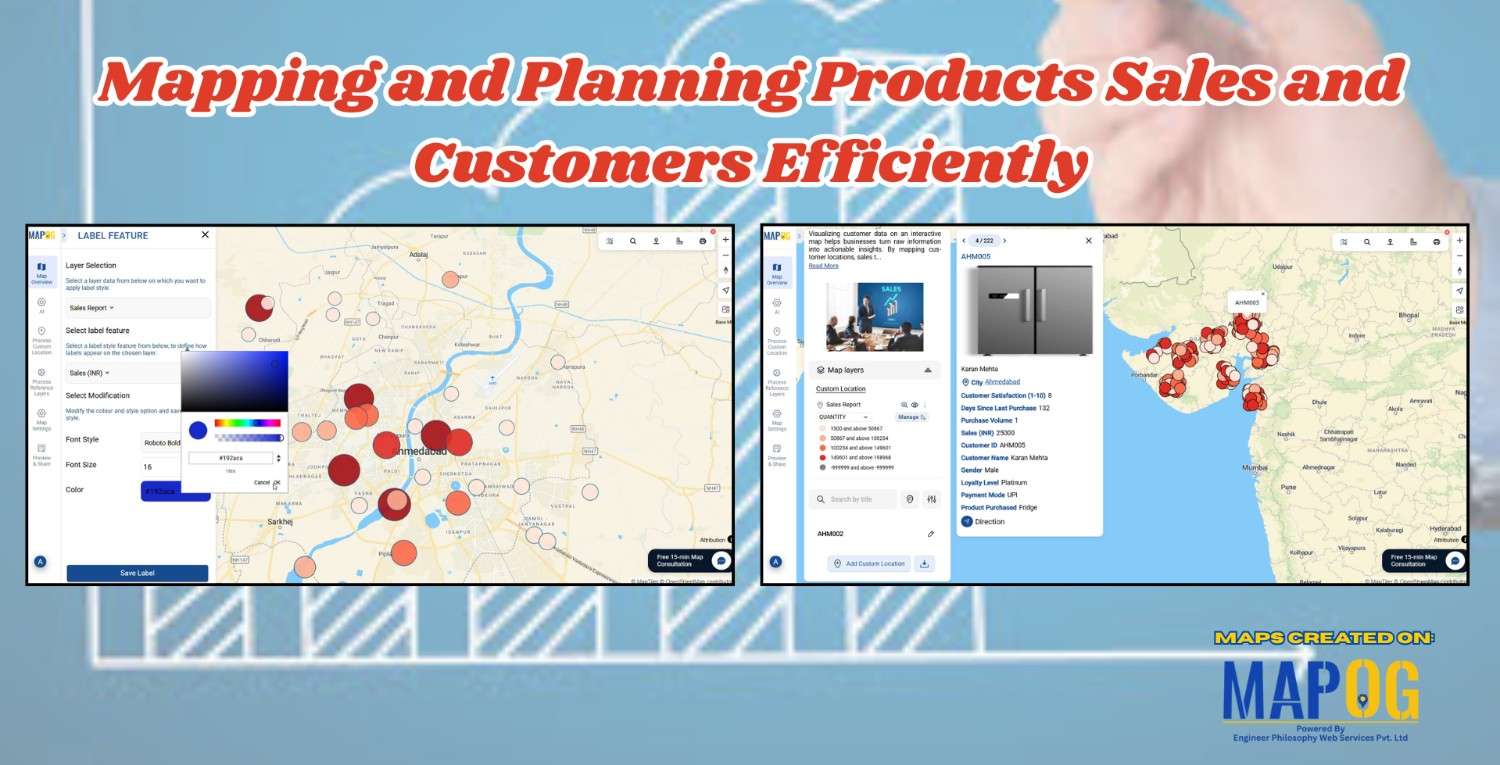
Often, when faced with a large set of data, it is very difficult to visualize it together. We need the help of data visualization tool in digital maps. Suppose you are a businessperson, who owns several retail chain stores across the city and need to see the performance of your stores in an effective manner. … Read more

Share an Interactive Map with Teammates (View or Edit Access)

Best Way to Share Interactive Maps Online with View and Edit Access

Today, readers and team members expect more than just static information when exploring content or managing data online. Whether it’s tracking locations, updating details, or monitoring progress, interactive maps make collaboration simple and engaging. With MAPOG, you can easily share an Interactive Map with teammates, assigning view or edit access to ensure the right people … Read more

How to Map Drainage Points & Stormwater Drains for Smarter Urban Maintenance

How to Map Drainage Points & Stormwater Drains for Smarter Urban Maintenance

To Map Drainage Points effectively is one of the most critical parts of urban infrastructure, since clogged or damaged drains often remain unnoticed until monsoons cause flooding. For example, during heavy rains, municipal teams in many cities spend hours locating hidden or encroached drains before cleaning begins—by then, water logging has already disrupted traffic and … Read more

Edit and Update Point Information After Uploading Data

Edit and Update Map Data for Fire Safety and Infrastructure Projects

When managing urban infrastructure projects, uploading data to a map is only the beginning. The real value emerges when teams can edit and update point information after uploading data seamlessly. For example, a fire safety company that installs alarms every month needs to keep its records accurate and current. While uploading installation data offers an … Read more

Draw & Style Property Boundary Polygons on a Map

Draw & Style Property Boundary Polygons on a Map

With the help of GIS, professionals Draw and Style Property Boundary Maps to visualise, manage, and analyze land ownership clearly and efficiently. Whether you are a city planner, a surveyor, a real estate professional, or simply someone trying to understand land parcels in your community, drawing and styling property boundary mapping with GIS includes polygons … Read more