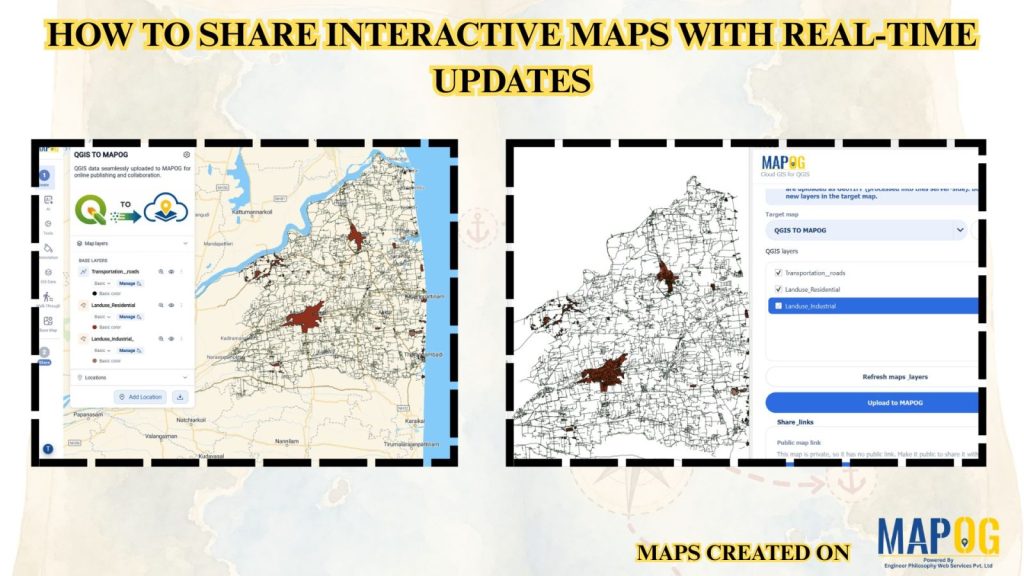
Urban planners and local authorities need accurate land use data to support zoning, infrastructure development, and sustainable city planning. MAPOG simplifies Urban Land Use Mapping by enabling users to create, update, and share interactive maps with real-time updates and Publish QGIS Maps Online, ensuring every stakeholder works with the latest spatial information from a single platform.
Key Concept:Publish QGIS Maps Online
Urban Land Use Mapping helps organizations visualize residential, commercial, industrial, agricultural, and recreational land use patterns. Real-time map updates enable teams to monitor land use changes and Publish QGIS Maps Online, collaborate efficiently, support planning decisions, and maintain accurate spatial data for sustainable urban development.
Methodology: Publish QGIS Maps Online
Create an interactive map, add urban land use layers, update spatial data, and share the map in real time for seamless collaboration.
1. Install and Log In to the MAPOG Plugin
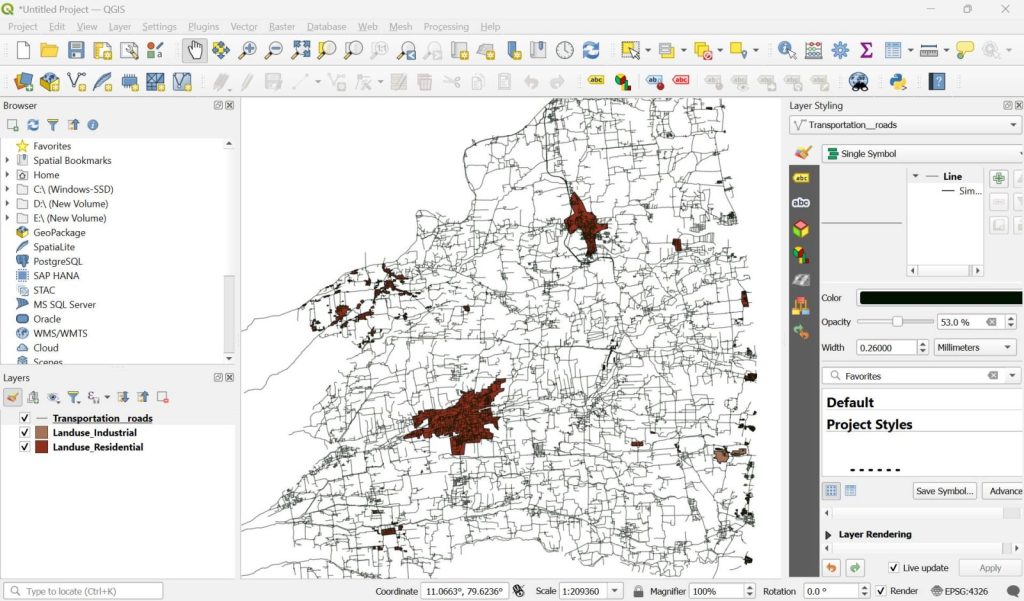
Initially, Open QGIS and create a new project to start editing. And upload all the data that had to be published in MAPOG.
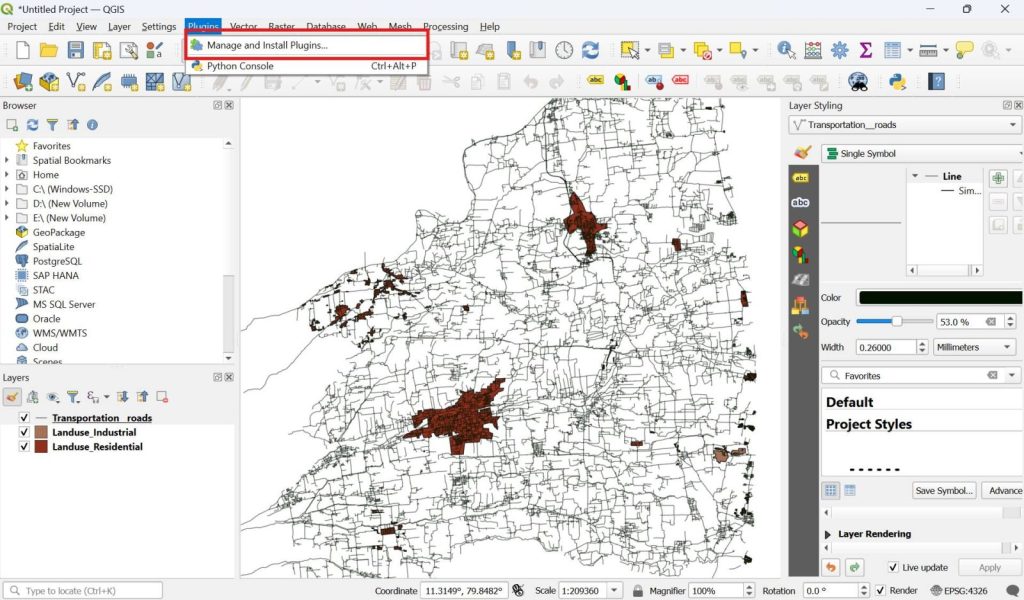
Then go to Plugins, select the Manage and Install Plugins.
Subsequently, In the All Plugins tab, search for MAPOG and install the plugin.
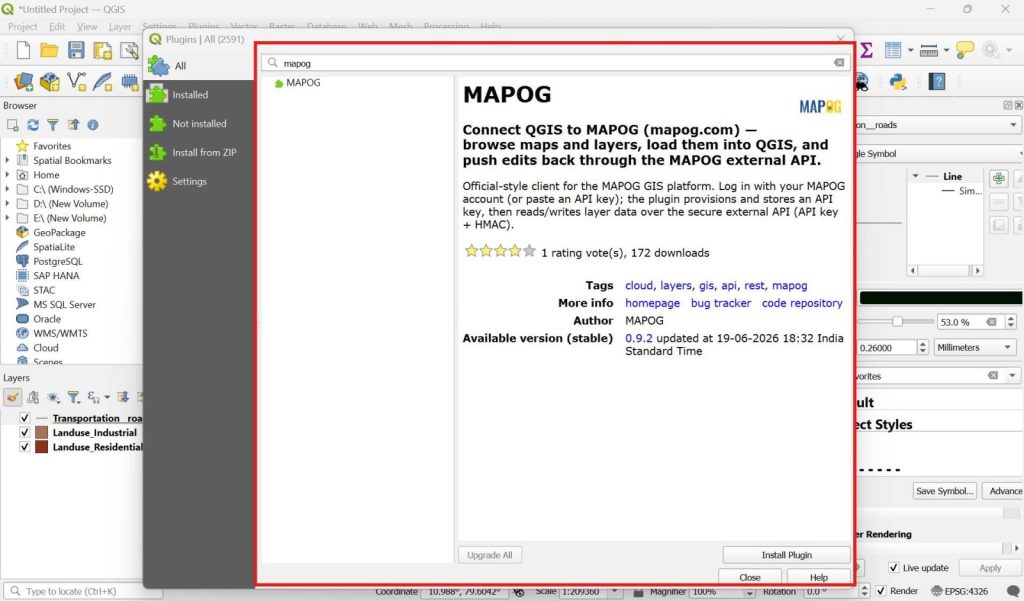
2. Install the MAPOG Plugin and Sign In
Meanwhile, In the All Plugins tab, search for the MAPOG Plugin and open it.
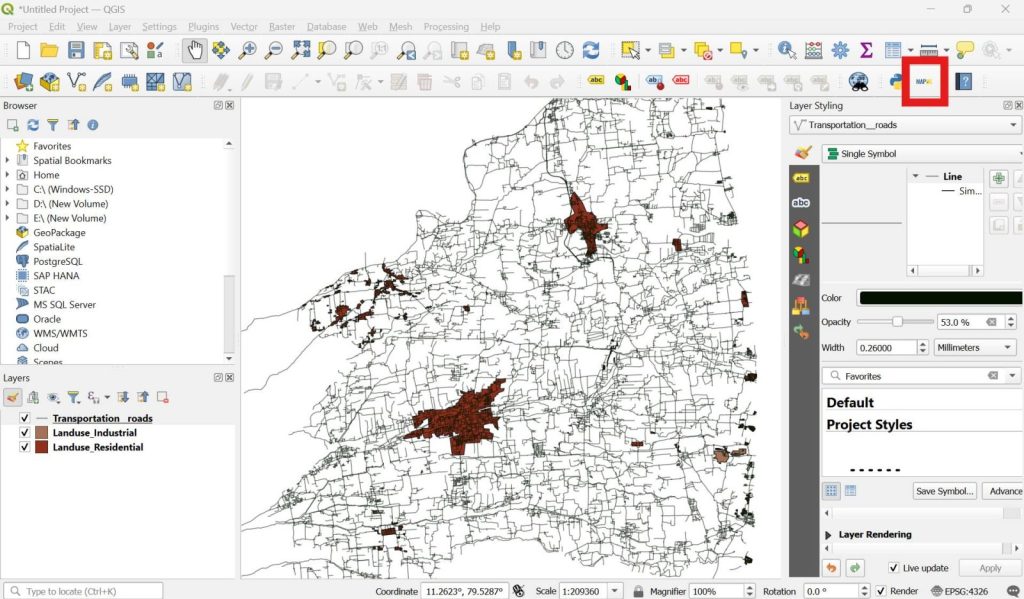
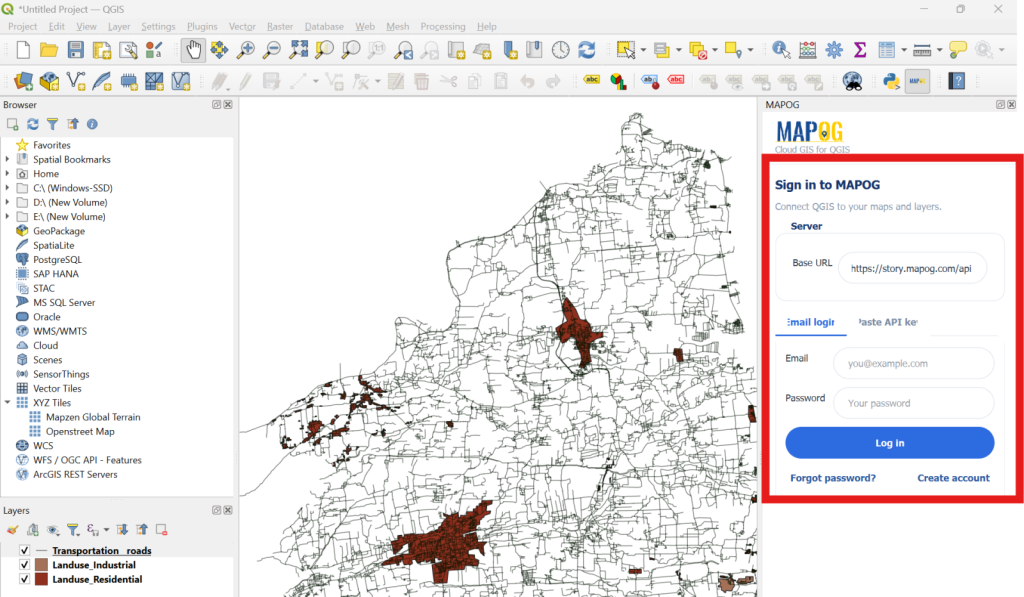
After installation, open the plugin and sign in with your MAPOG account credentials. Signing in connects QGIS to your online maps and enables seamless data synchronization.
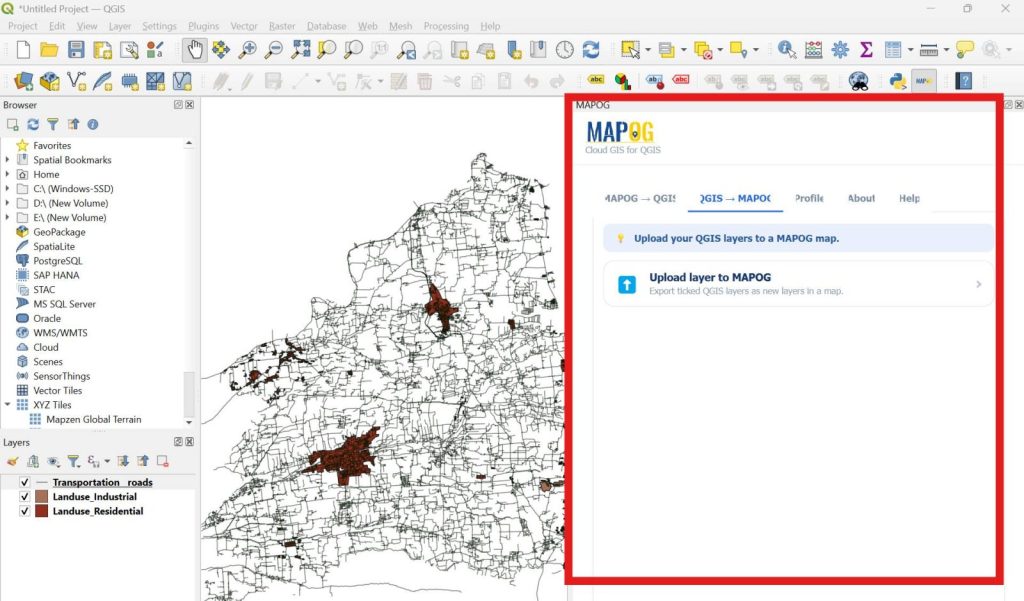
3. Upload QGIS Layers to MAPOG
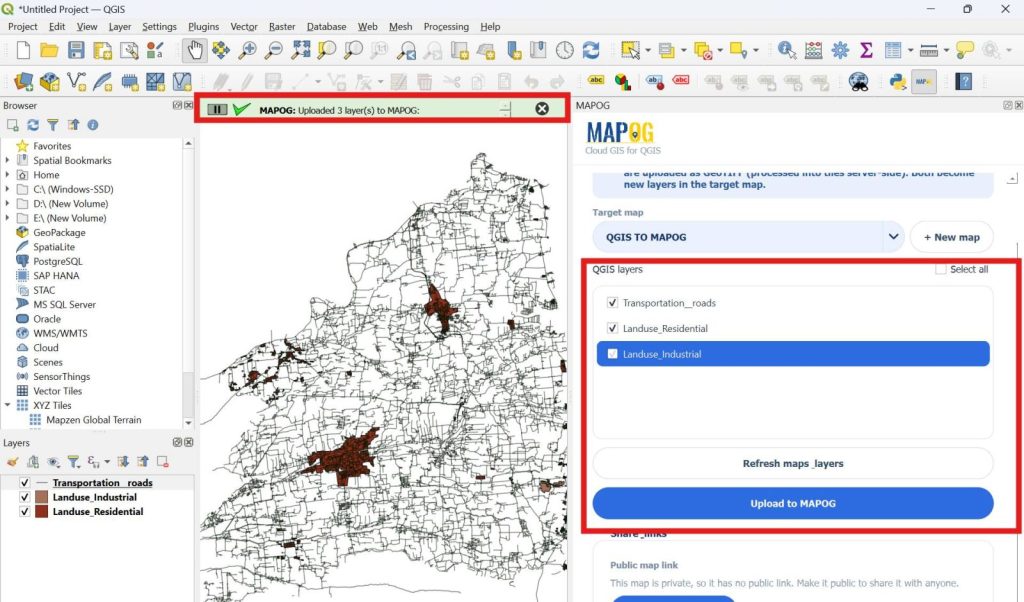
Once logged in, navigate to the QGIS to MAPOG section in the plugin. And select the Upload layer to MAPOG.
Finally, In the Upload layer to MAPOG’s target map create a +New map or select from the existing to upload data.
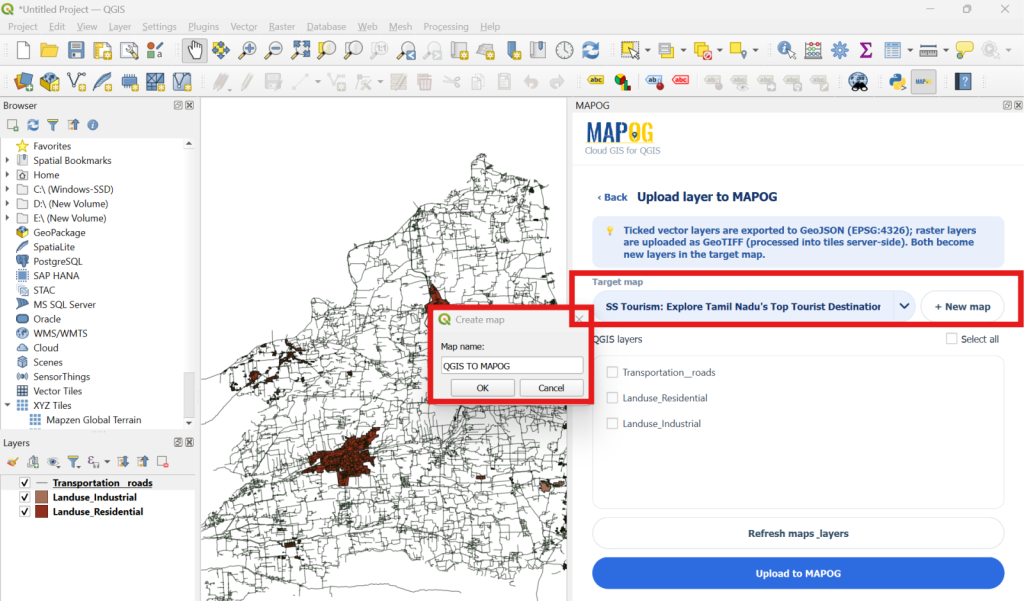
Ultimately, In QGIS Layers, select the layers you want to upload to MAPOG and click Upload to MAPOG to ensure all datasets are published correctly.
4. Share and Manage Map Access
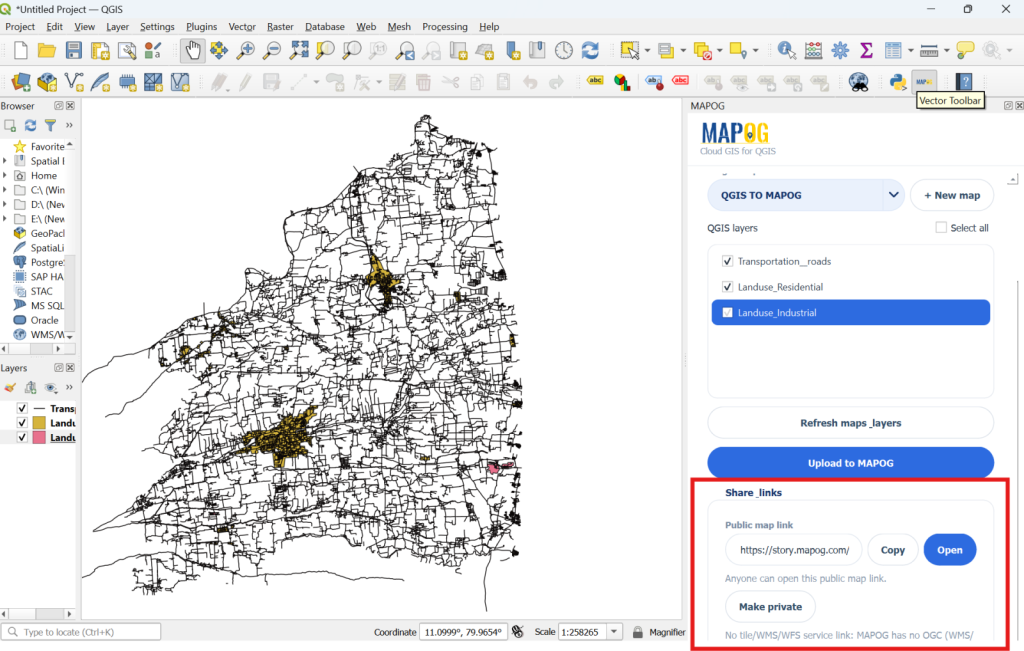
Thus, Open Share Links to manage map access. Click Make Public to generate a shareable link, then copy or open it for verification. If needed, click Make Private to restrict access.
5. Access Your Data in MAPOG
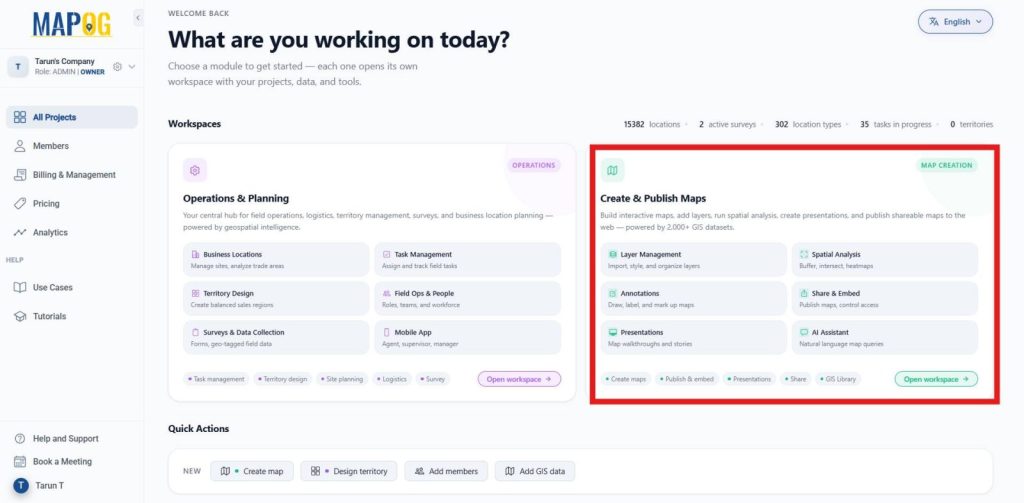
Consequently, Navigate to the MAPOG Dashboard and select Creating and Publish Map.
There, select the map you created.
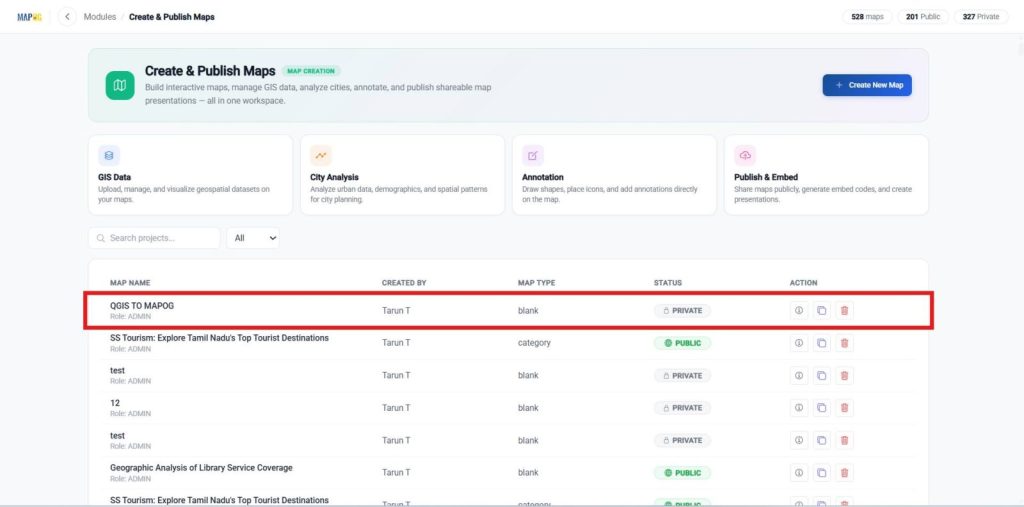
Therefore, Open MAPOG to view your uploaded map.
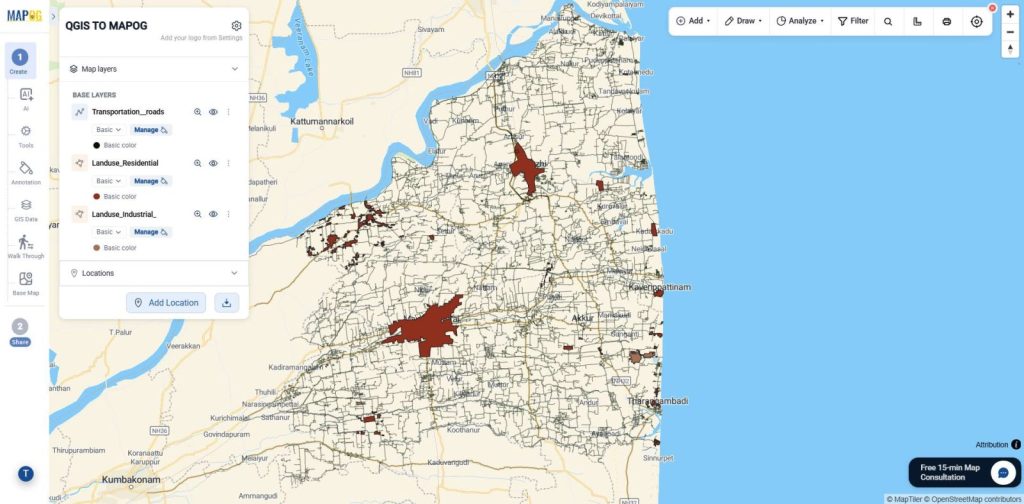
6. Customize Your Branding
Moreover, Open Map Settings. Click Replace to upload your company logo or project image and add description.
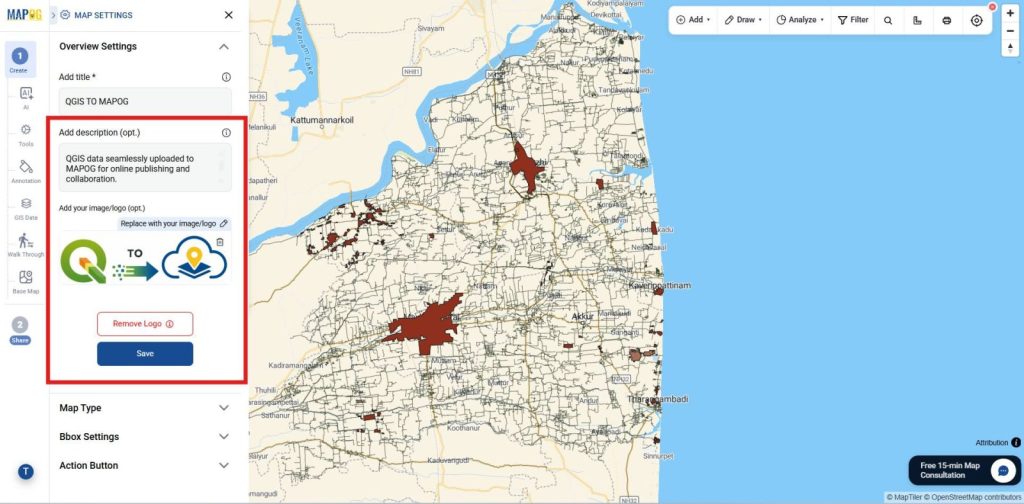
Nevertheless, Adjust the logo placement and save your branding.
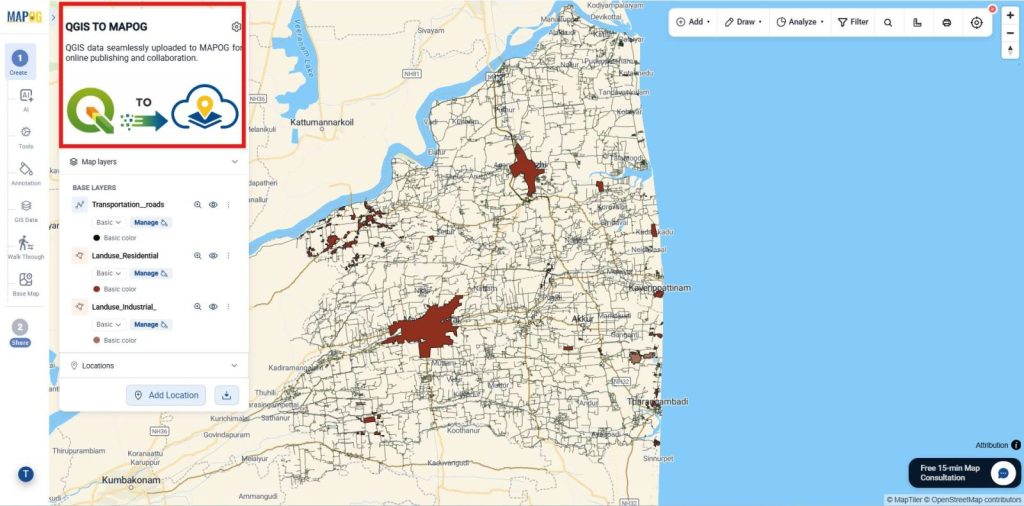
7. Configure and Publish Your Map
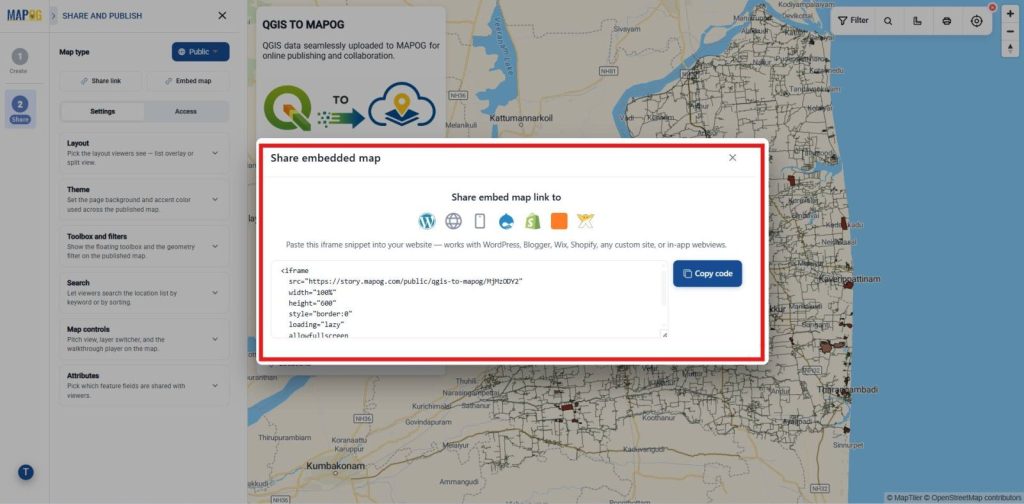
Click Preview & Share, select the Map Type (Public or Private), and configure the map settings such as layout, theme, search, and filters.
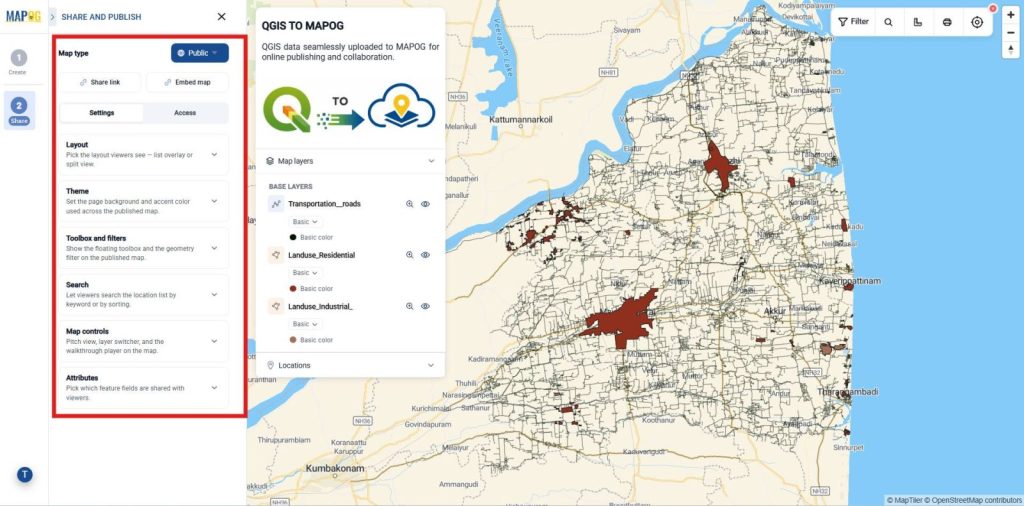
Although, Generate a Share Link or Embed Map to securely publish and distribute your interactive map.
8. Share and Collaborate
However, Invite users by email and assign Editor or Viewer permissions based on their access requirements.
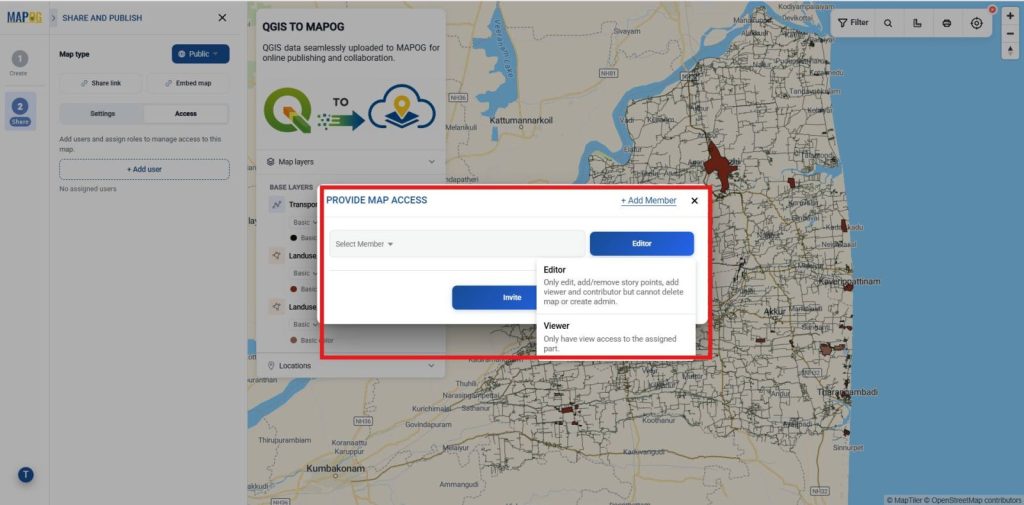
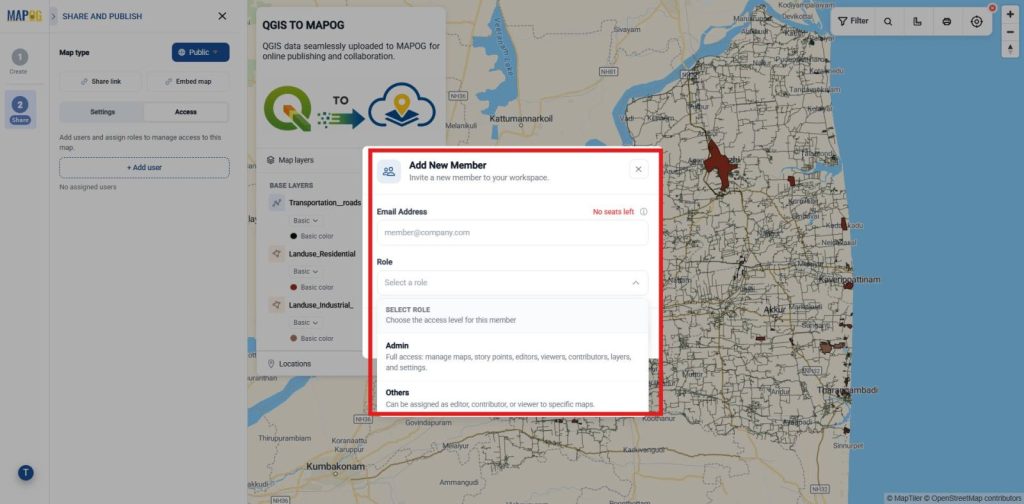
Use Add Users to invite members and assign roles such as Admin, Editor, or Viewer.Admins manage the map, Editors update content, and Viewers have read-only access. Changes sync instantly for all users
Industry Use Cases and Benefits
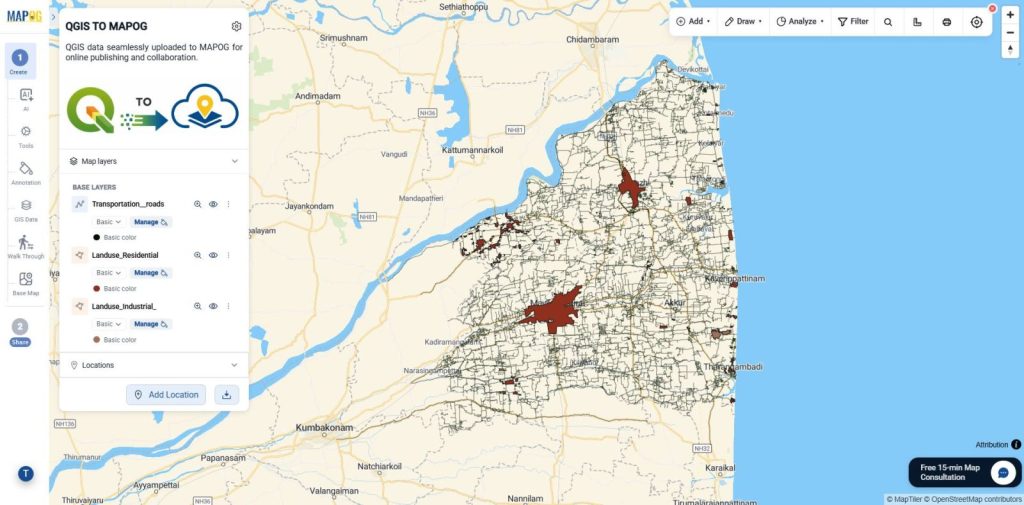
Also, Organizations across urban planning, utilities, transportation, construction, environmental management, local government, and GIS consulting use the MAPOG Plugin to publish QGIS maps online. It enables teams to share spatial data, collaborate in real time, and keep web maps updated from a single platform.
Conclusion
As a result, The MAPOG Plugin simplifies publishing QGIS maps online by connecting desktop GIS with interactive web maps. Users can upload layers, publish maps, manage access, and collaborate in real time, ensuring stakeholders always have access to the latest geographic information.