Interactive maps become more effective when users can annotate locations, mark routes, and visualize important geographic information. Similarly, the MAPOG Annotation Tool offers powerful drawing and markup features that support planning, collaboration, and location-based decision-making across industries.
Why Use MAPOG Annotation Tool in GIS Maps?
However, Annotations turn maps into interactive workspaces by enabling teams to mark locations, draw routes and boundaries, add notes and documentation, visualize operations, and improve collaboration for better planning and decision-making.
MAPOG Annotation Tool: How to create your map?
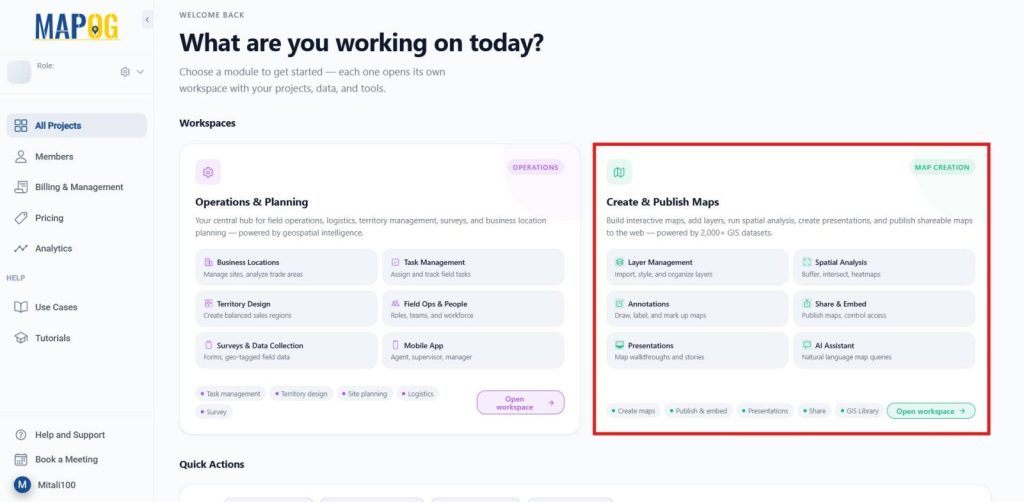
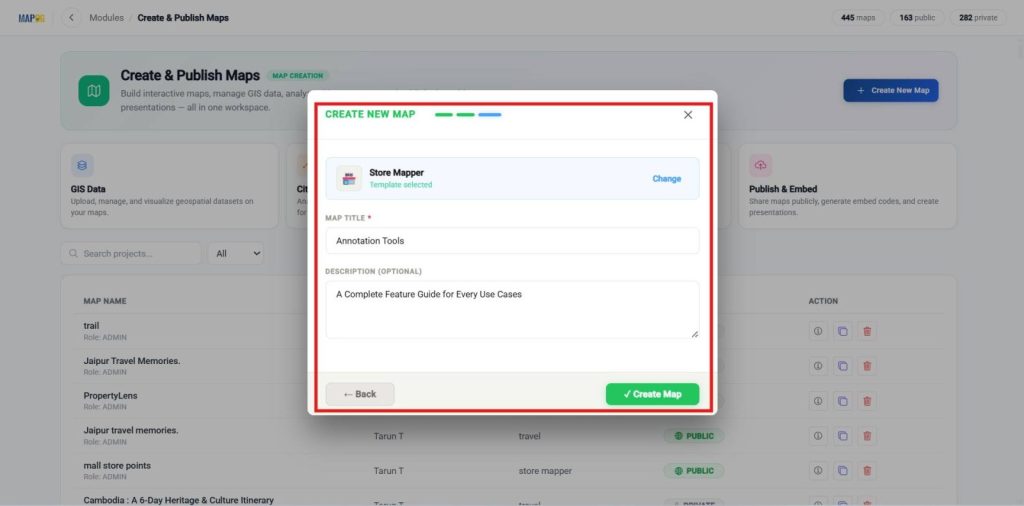
Therefore, Come to the MAPOG dashboard.
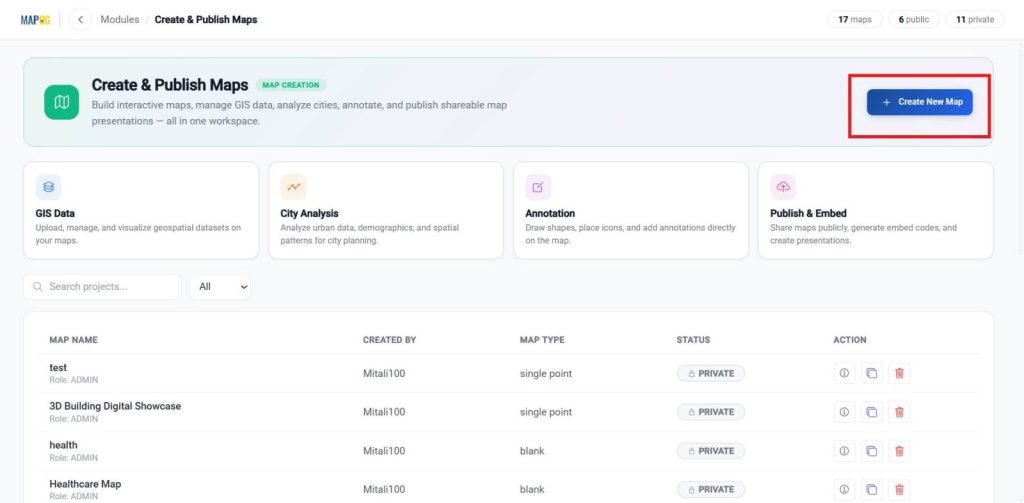
Moreover, In the Create and publish map Dashboard, choose Create New Map.
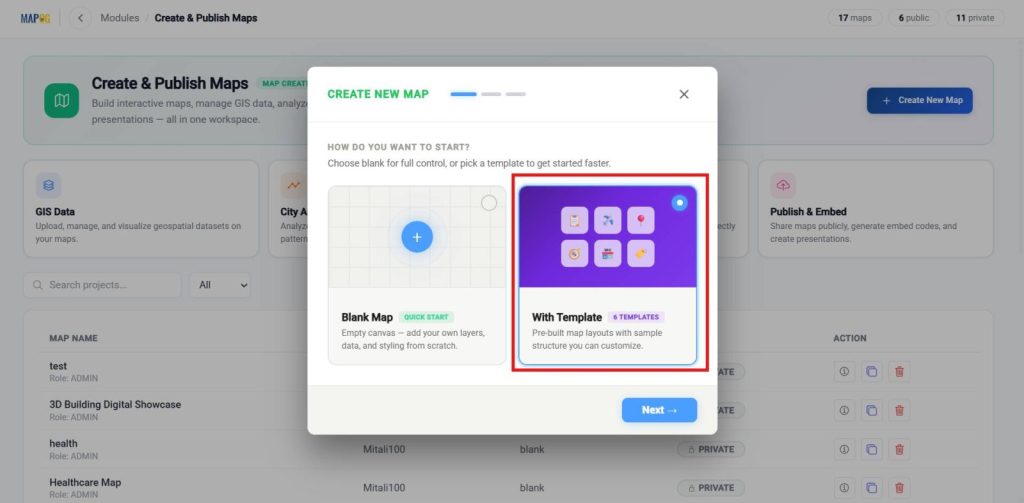
Furthermore, Choose a template, and proceed to the next step.
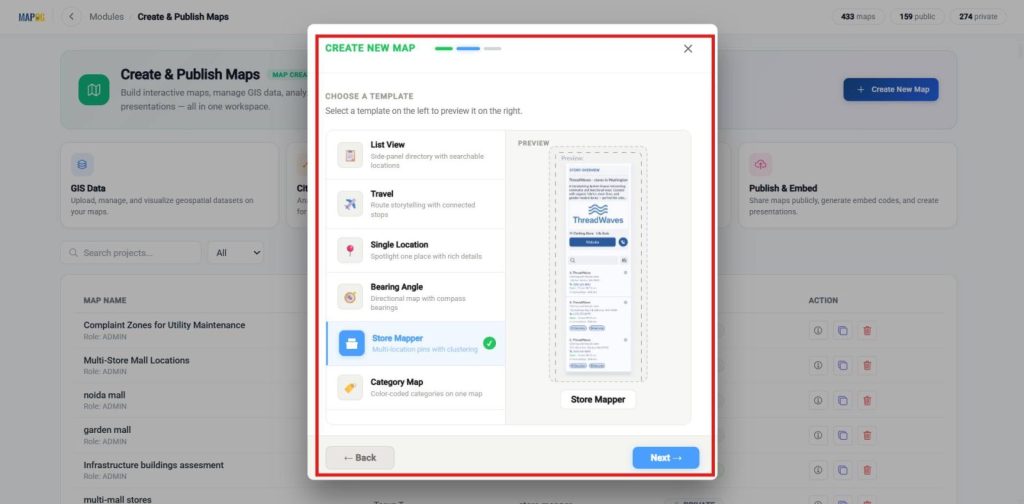
Select the template as the store Mapper, then proceed to the next step.
Enter a clear title and a brief description, then click Create to save your map.
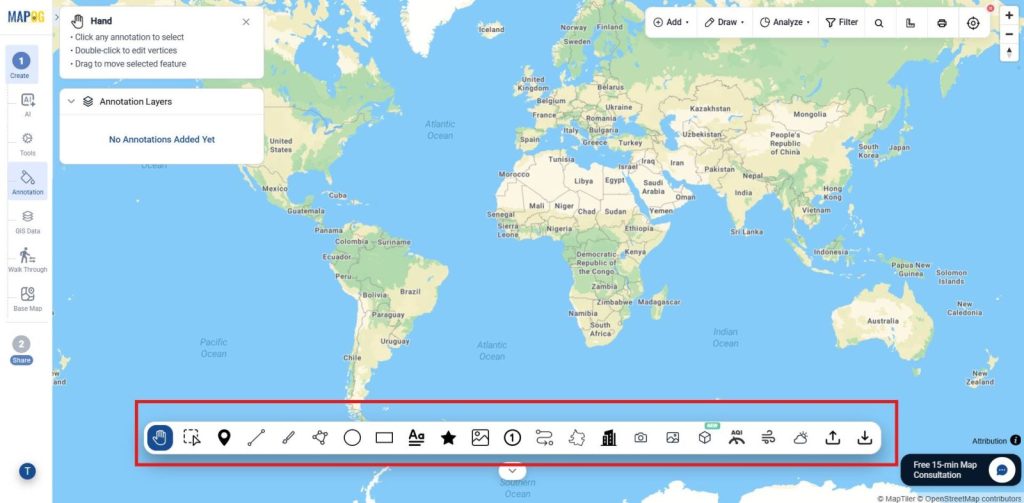
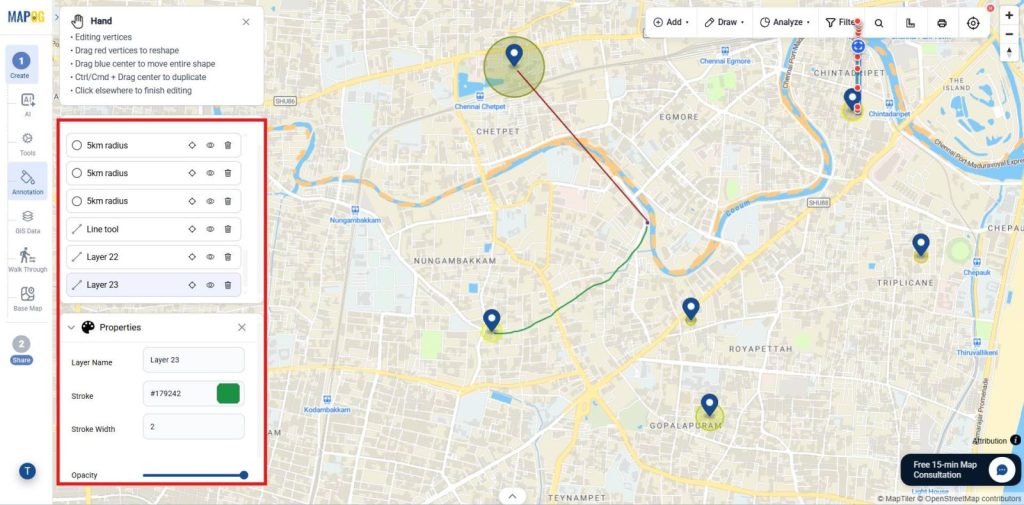
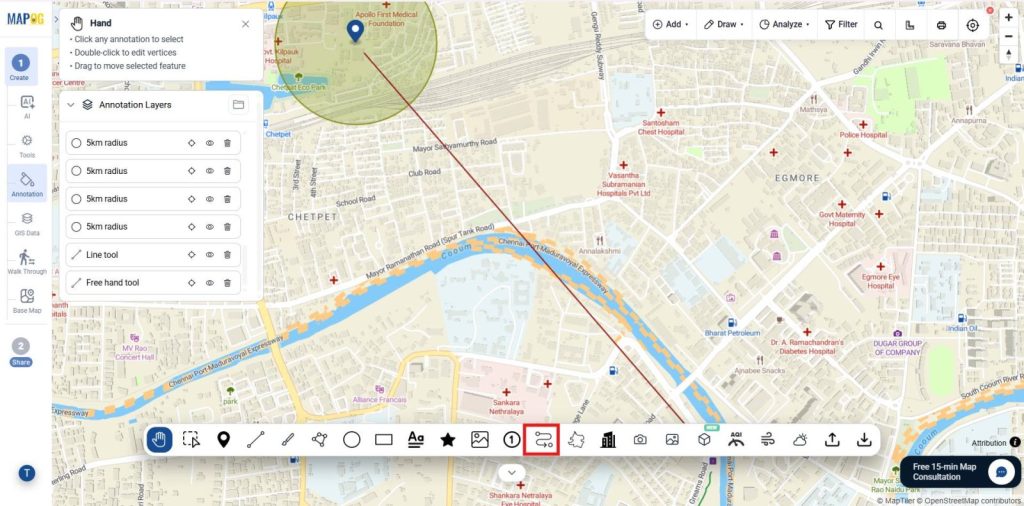
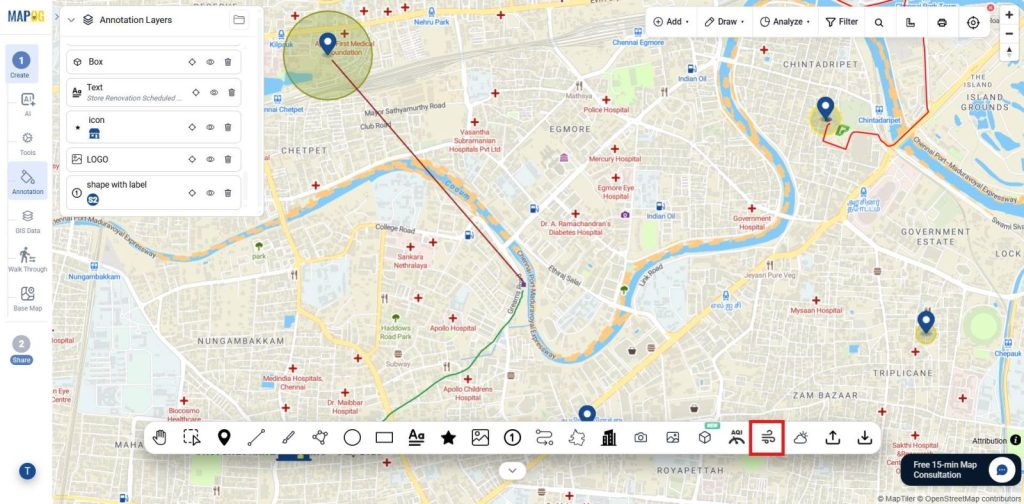
Annotation tools
Additionally, Once the map is created, select go to the annotation in the tools bar.
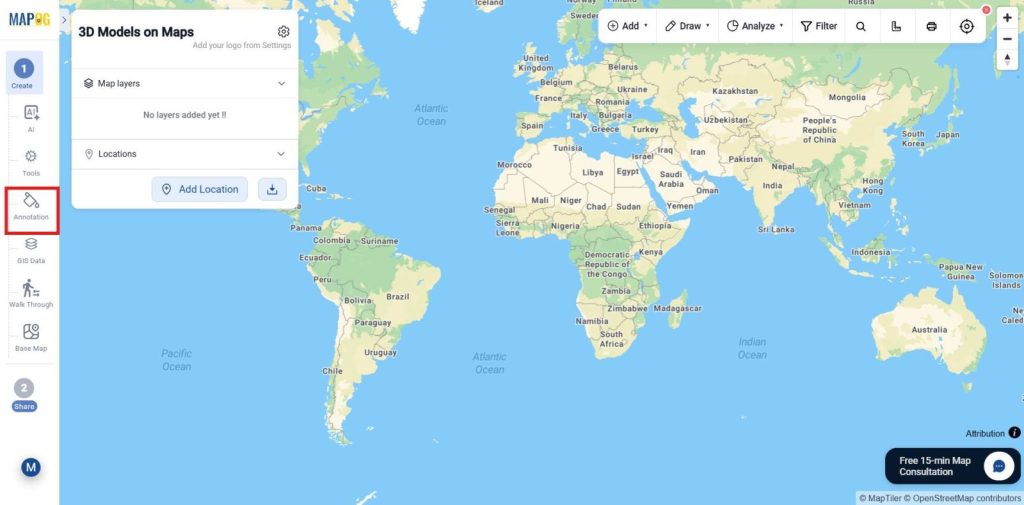
Consequently, These are the Annotation tools that will be explained one by one.
Data Marking & Mapping
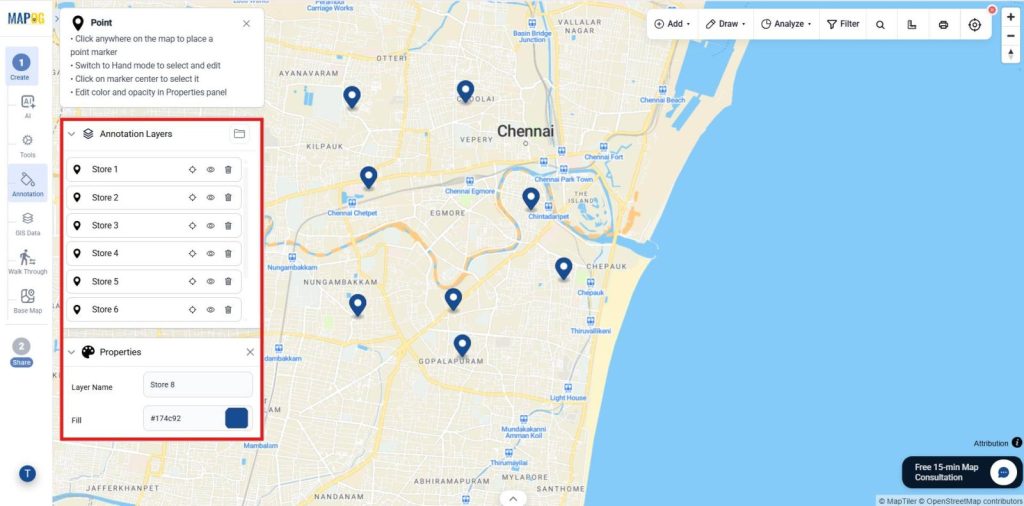
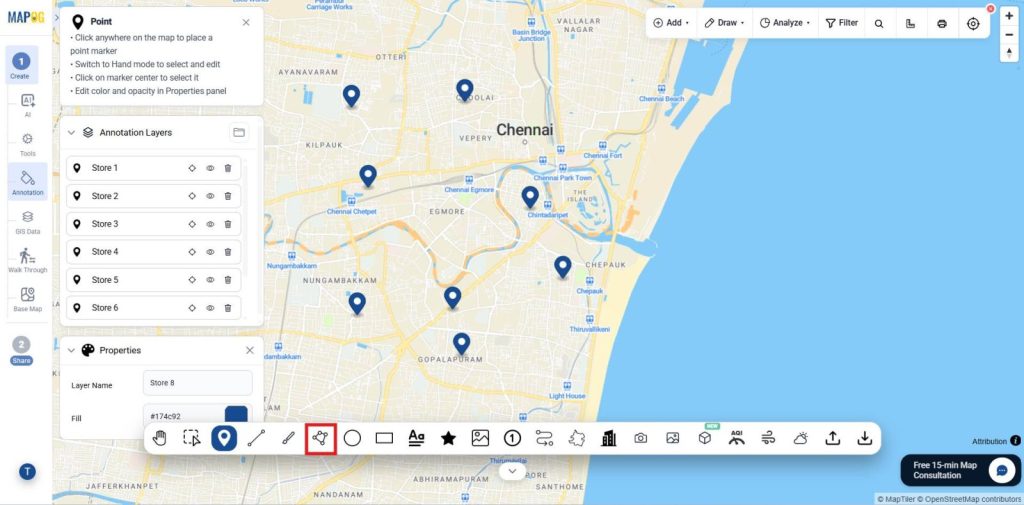
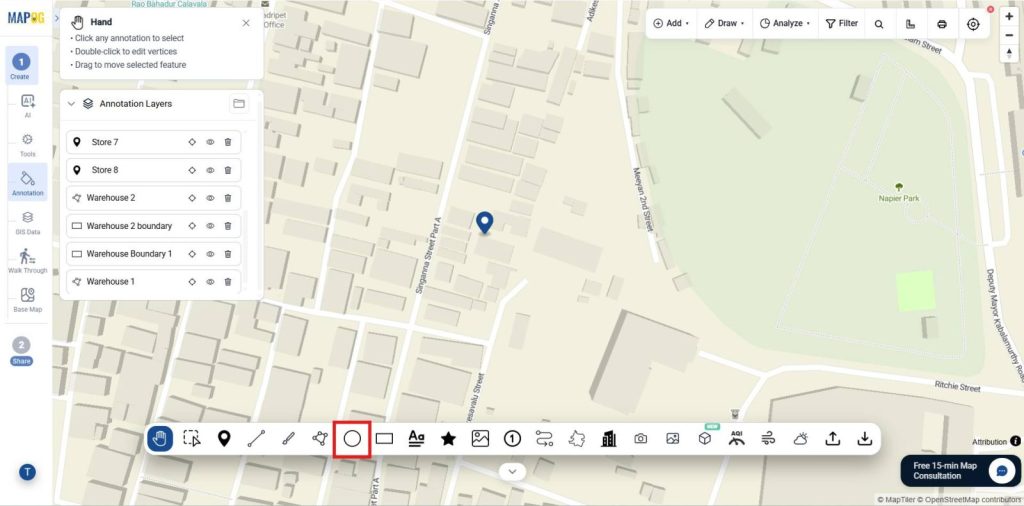
1. Point Tool
- Purpose: Place location markers on specific points of interest.
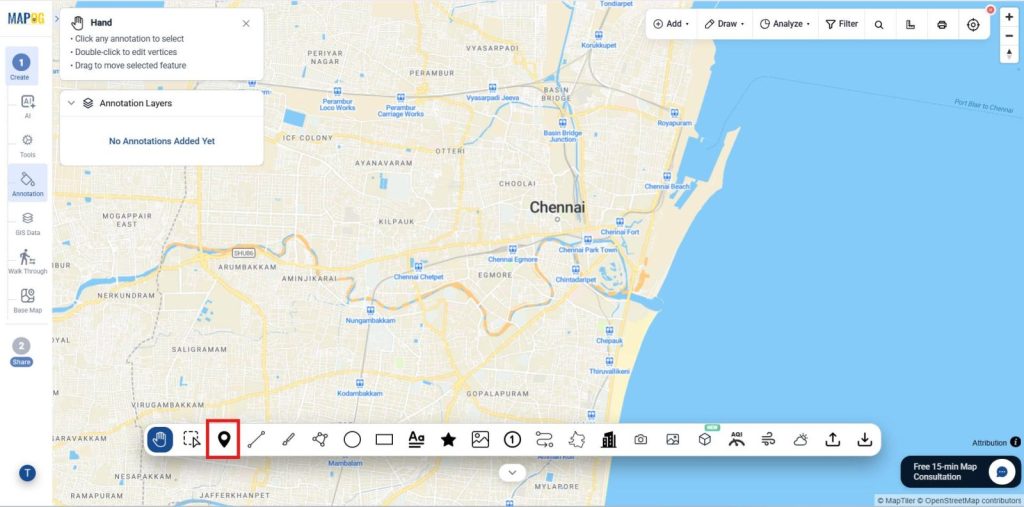
- Use Cases & Industries: Identify locations across retail, logistics, tourism, and safety.
- For Example Idea: Add retail store locations across a city by placing the cursor.
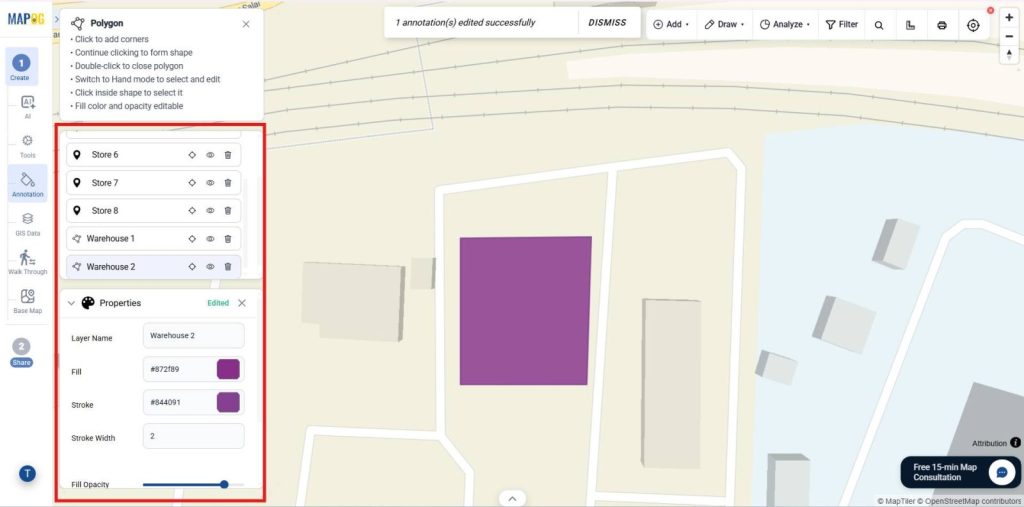
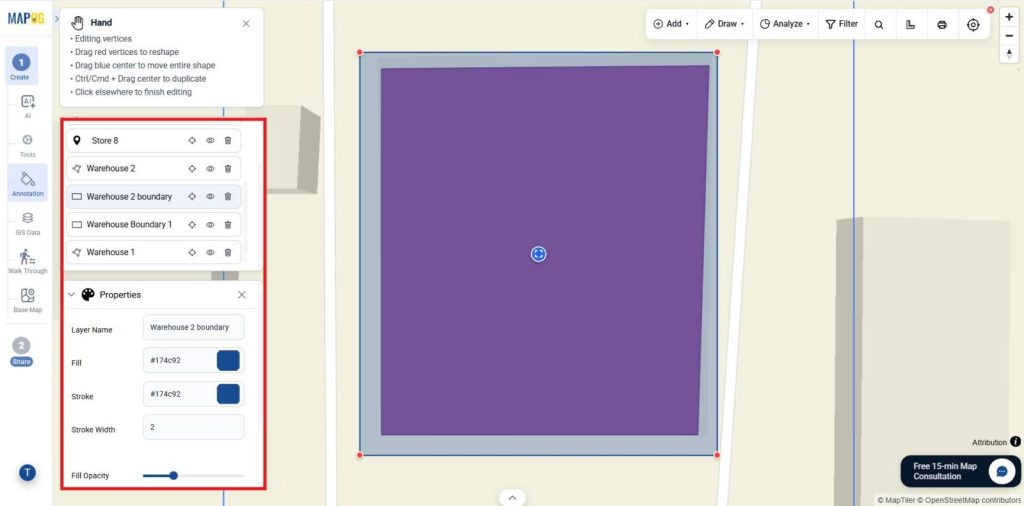
2. Polygon Tool
- Purpose: Create custom area boundaries using multiple points.
- Use Cases & Industries: Define territories, fields, zones, and boundaries across industries.
- Example Idea: Draw a sales territory covering multiple neighborhoods such as a warehouse using the polygon as shown.
3. Rectangle Tool
- Purpose: Draw rectangular boundaries on the map.

- Use Cases & Industries: Mark sites, zones, and areas for planning.
- For Example Idea: Outline a warehouse compound can be mapped using a rectangle.
4. Circle Tool
- Purpose: Highlight areas within a specified radius.
- Use Cases & Industries: Analyze service coverage, delivery zones, and catchment areas in retail, healthcare, and logistics.
- For Example Idea: Draw circle and define 5 km reach zone around a store using the circle tool
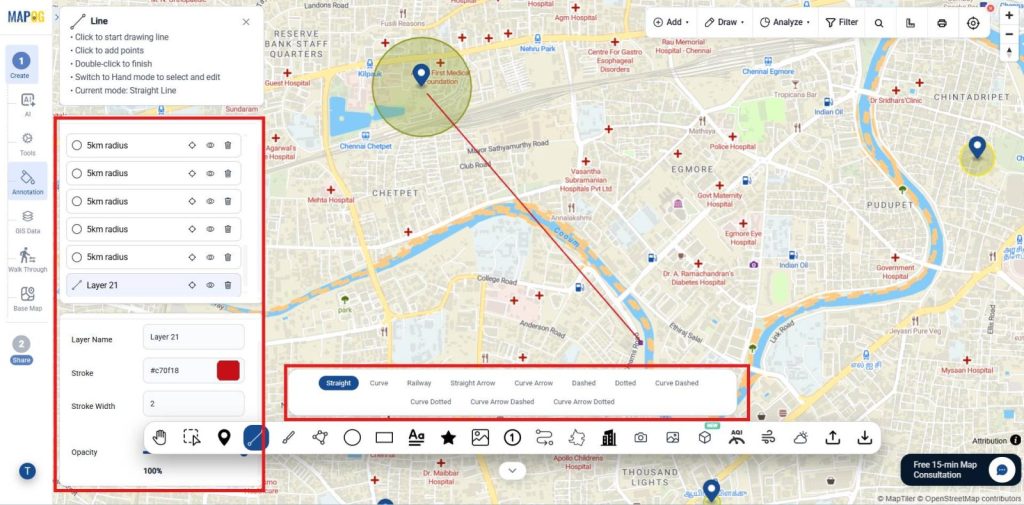
5. Line Tool
- Purpose: In contrast, Draw straight lines between locations.

- Use Cases & Industries: Visualize routes and networks for logistics, telecom, and planning.
- For Example Idea: Use Straight Arrow lines to map warehouse-to-store deliveries as shown, Railway lines for nearby rail corridors, and Dashed lines for proposed future expansion routes.

6. Freehand Drawing Tool
- Purpose: Next, Sketch custom shapes and notes directly on the map.
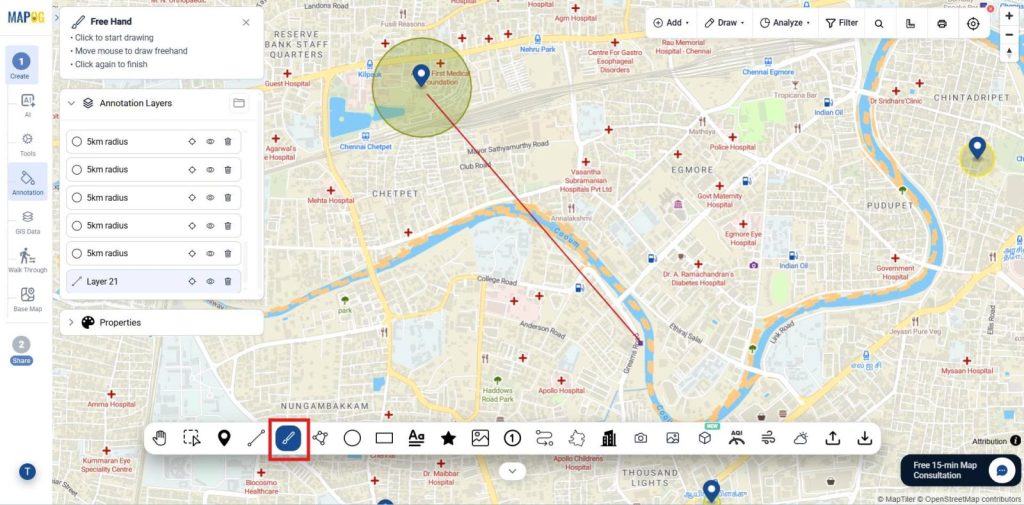
- Use Cases & Industries: Record observations, inspection areas, and temporary zones.
- For Example Idea: A retail store audit map where a field executive uses the Freehand Drawing Tool to outline a section of the store layout that requires reorganization, helping managers visualize merchandising or compliance issues directly on the map.
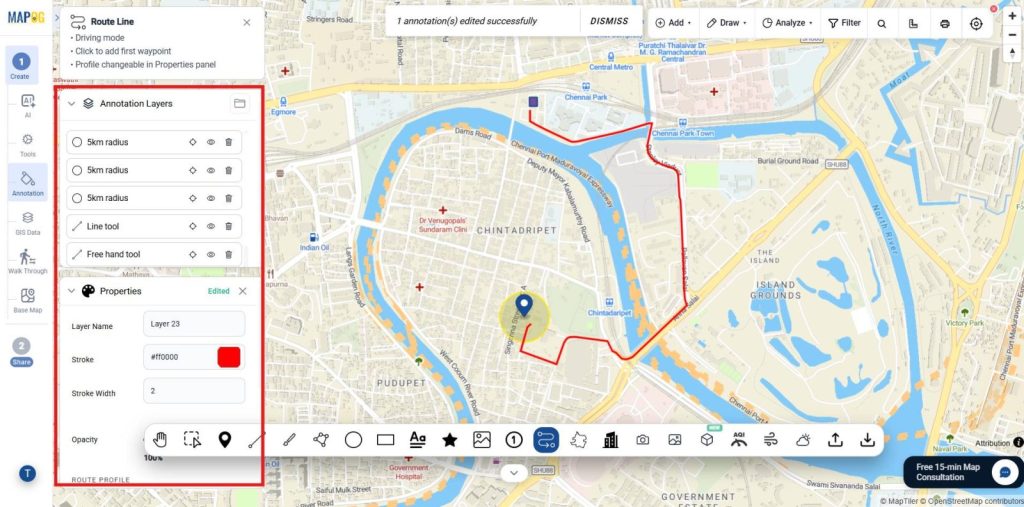
7. Route Mapping
- Purpose: Then, Visualize and analyze travel paths, transportation networks, and movement between locations on the map.
- Use Cases & Industries: Plan routes, utility networks, and logistics operations.
- For Example Idea: Once you select the warehouse and multiple stores, the system automatically generates and connects optimized delivery routes across the city.
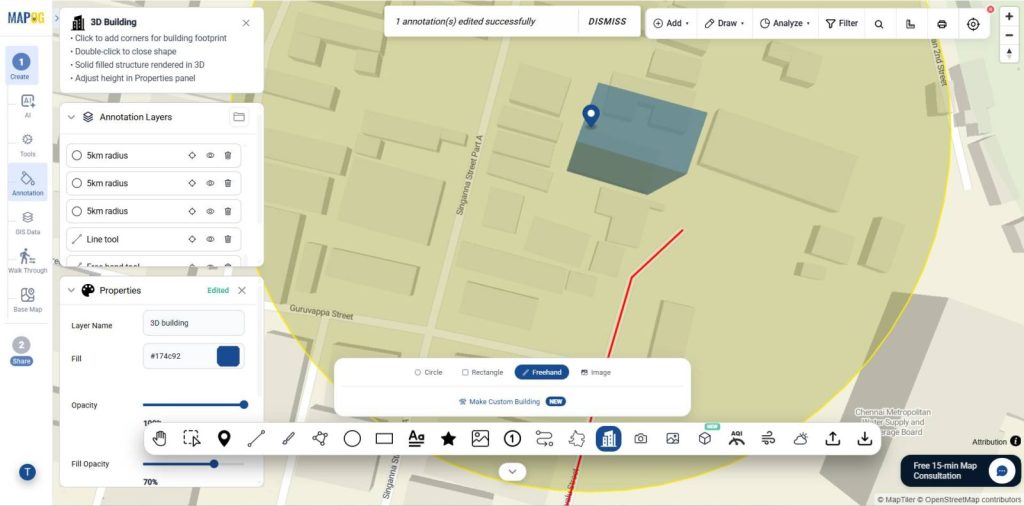
8. 3D Building Mapping
- Purpose: Overall Visualize buildings and structures in three dimensions for enhanced spatial understanding and analysis.
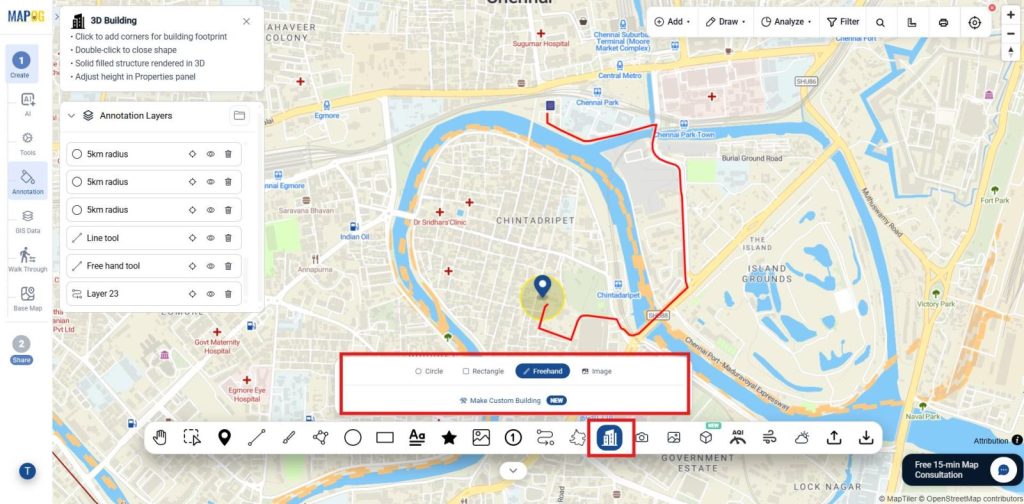
- Use Cases & Industries: Support urban planning, real estate, facilities, and infrastructure.
- For Example Idea: Select a city block, plot four points, assign height values, and connect them to form 3D building structures for visualizing layout and surrounding infrastructure.
Media & Documentation
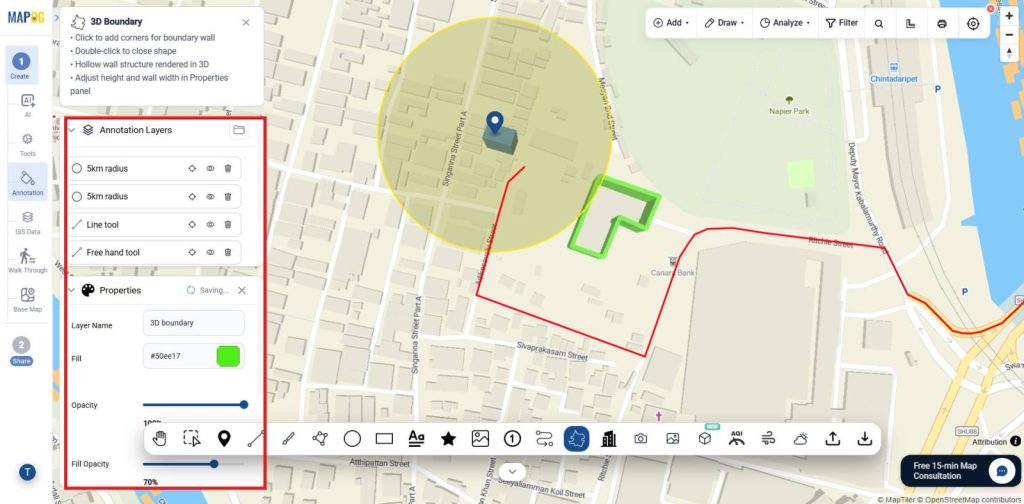
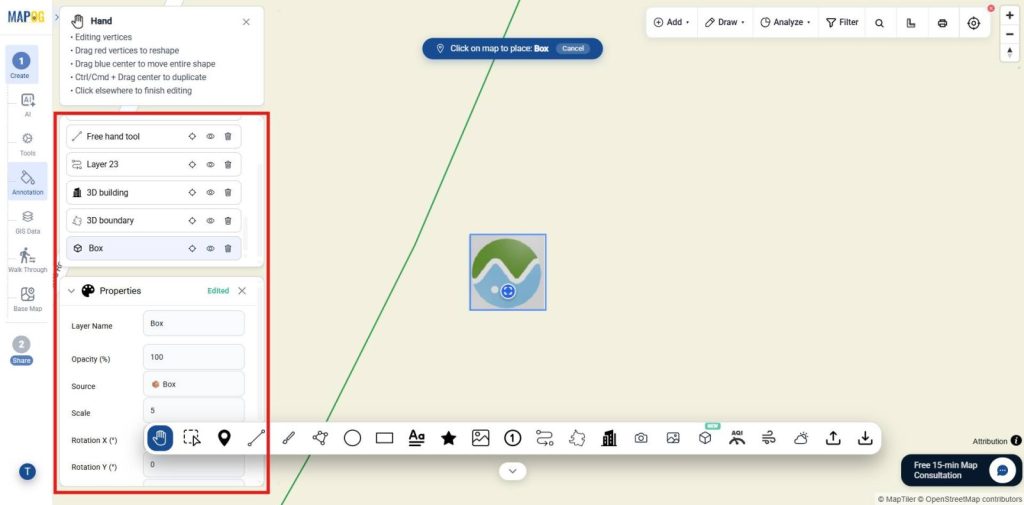
1. 3D Boundary Mapping
- Purpose: Define and visualize area boundaries in three dimensions for improved site analysis and spatial planning.
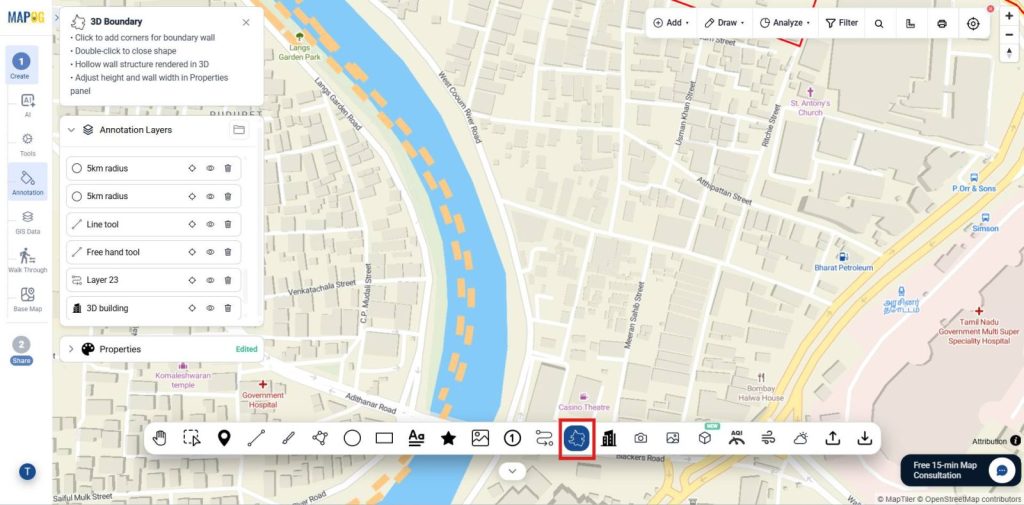
- Use Cases & Industries: Manage sites, zones, boundaries, and infrastructure projects.
- Example Ideas: Define 3D boundary of industrial site using points, visualize extent, and analyze surrounding infrastructure features in detail for planning and evaluation.
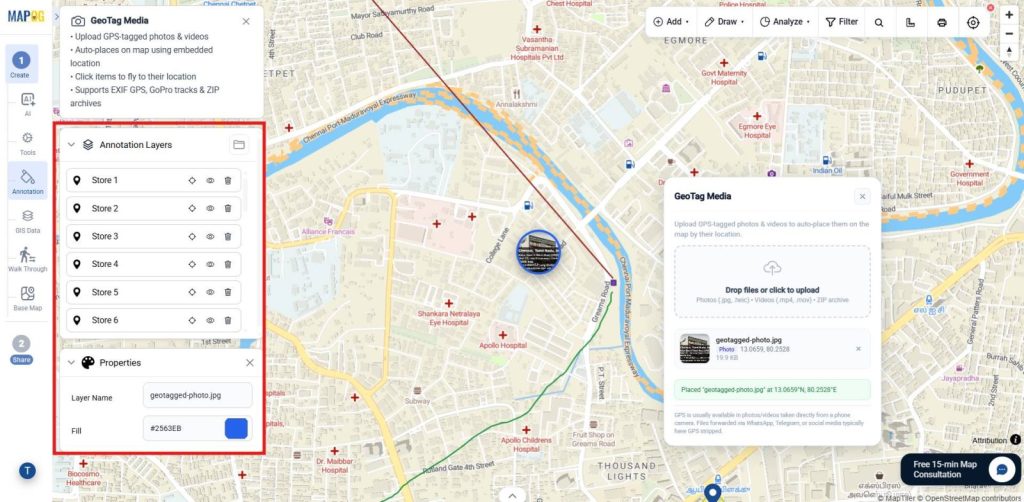
2. Geotagged Image Mapping
- Purpose: Attach location-based images to map features for visual documentation and geographic reference.
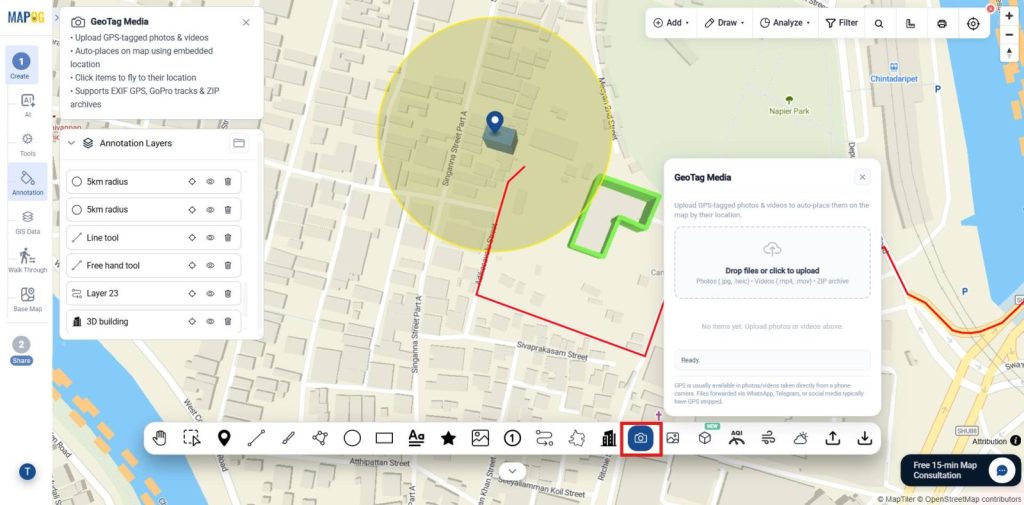
- Use Cases & Industries: Document inspections, audits, surveys, and monitoring.
- For Example Idea: Upload geotagged storefront images to retail locations for audits, where they automatically place at exact positions for compliance checks, visual verification, and store monitoring.
3. Image Room
- Purpose: Organize, manage, and view multiple images associated with mapped locations in a centralized gallery.
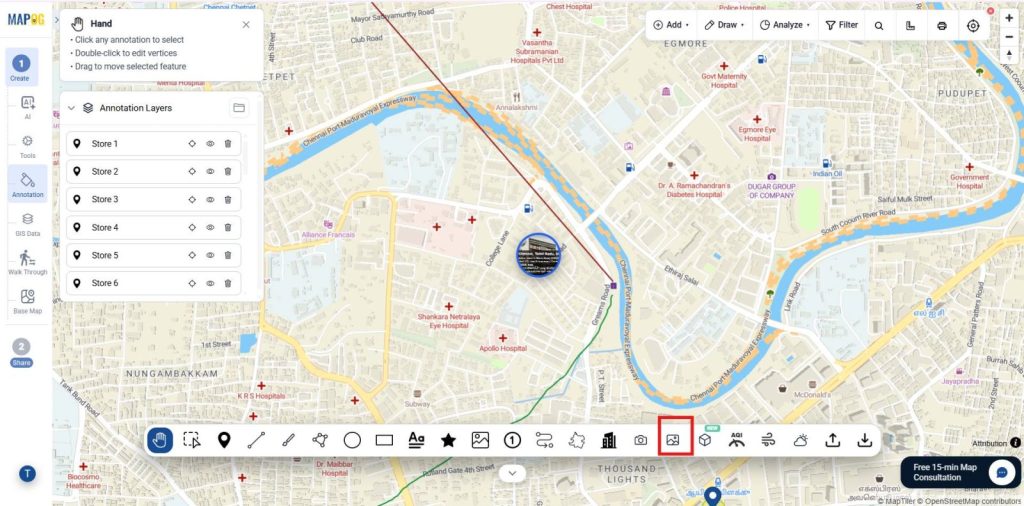
- Use Cases & Industries: Store inspection photos, project progress images, survey documentation, asset records, and site visit photographs in construction, retail, facility management, and field operations.
- For Example Idea: Create an image room containing all inspection photos collected from multiple retail store locations across a region.
4. 3D Model Visualization
- Purpose: Display and interact with detailed 3D models on the map for enhanced spatial analysis and planning.
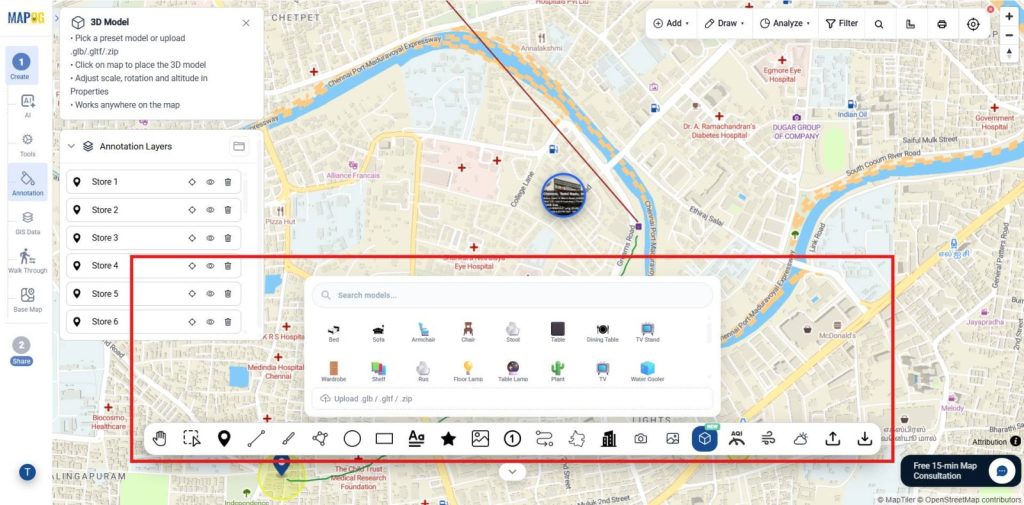
- Use Cases & Industries: Support design, planning, management, and construction monitoring.
- For Example Idea: Place a 3D model of a proposed store on the map to evaluate its fit within the surrounding area and infrastructure from the given or upload it.
MAPOG Annotation Tool: Annotation & Editing
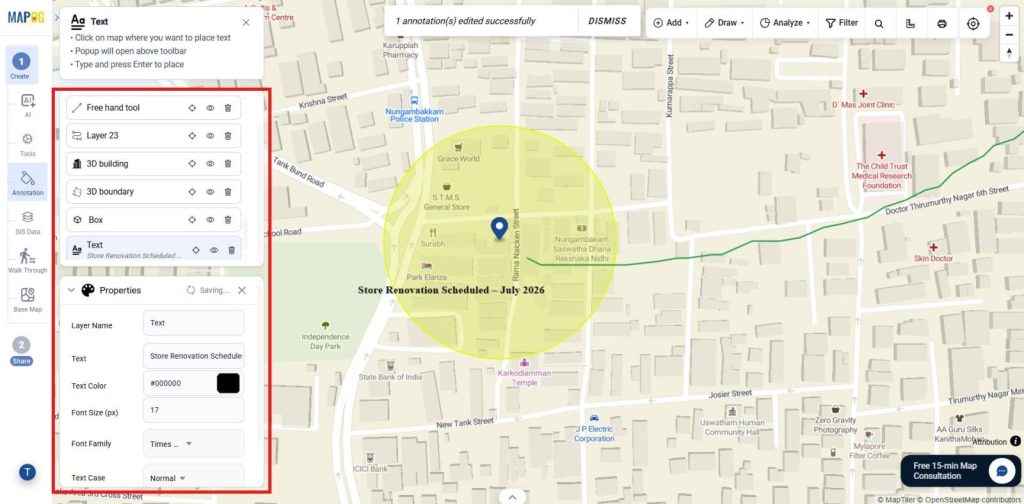
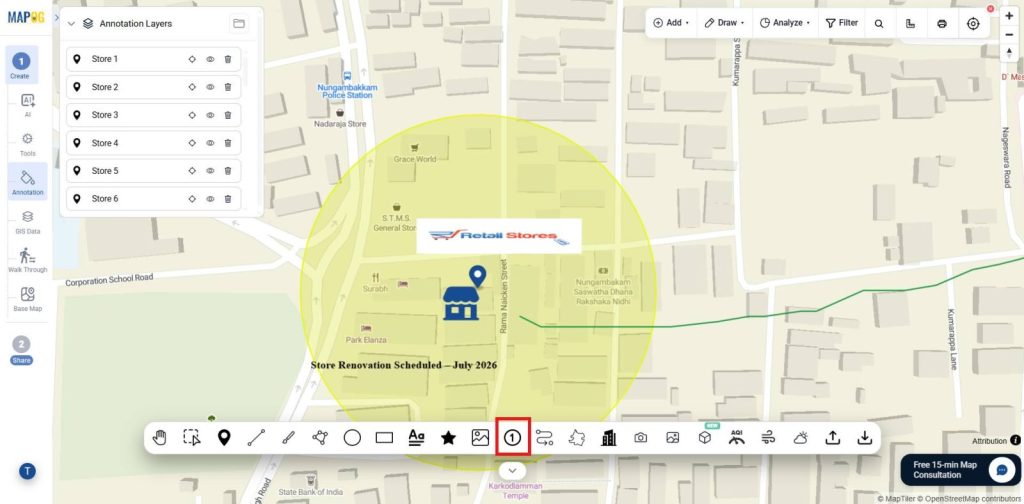
1. Text Annotation
- Purpose: Add labels, notes, instructions, and descriptive information directly to retail locations and map features.
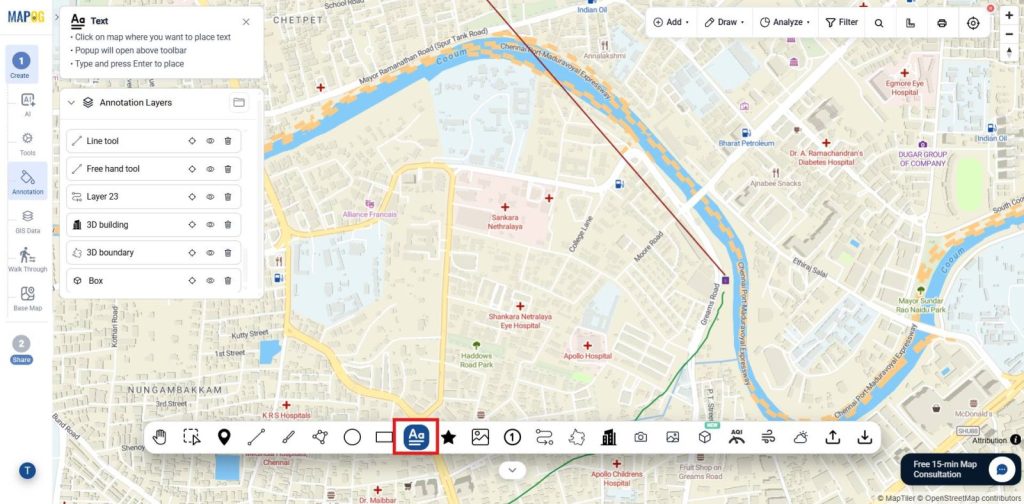
- Use Cases & Industries: Document store data, promotions, updates, and location notes.
- For Example Idea: Add a note saying “Store Renovation Scheduled – July 2026” to a retail store location using the text in the layer properties.
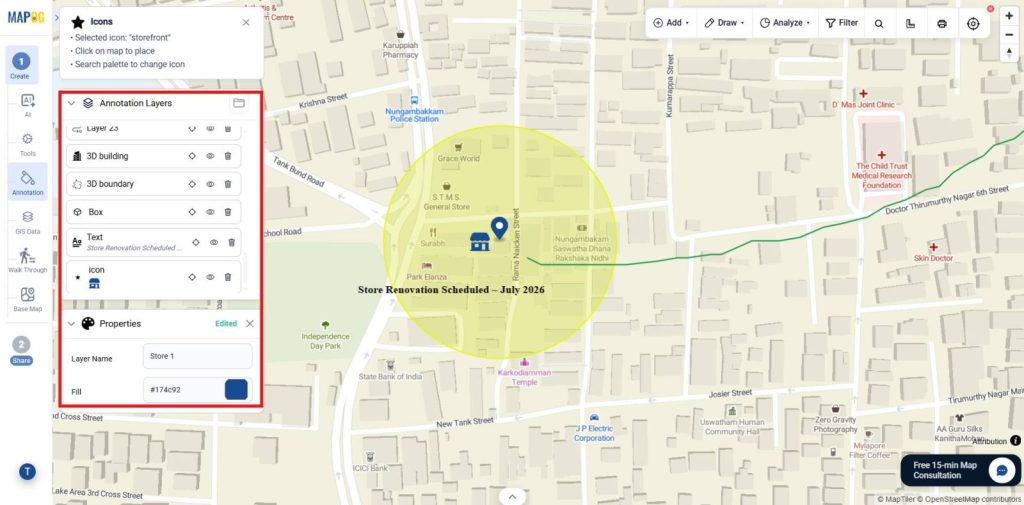
2. Icon Annotation
- Purpose: Use predefined icons and symbols to visually represent retail stores, warehouses, pickup points, and other retail assets on the map.

- Use Cases & Industries: Differentiate stores, centers, pickups, and franchise outlets.
- For Example Idea: Use different icons to represent flagship stores, franchise stores, and warehouses across a retail network.
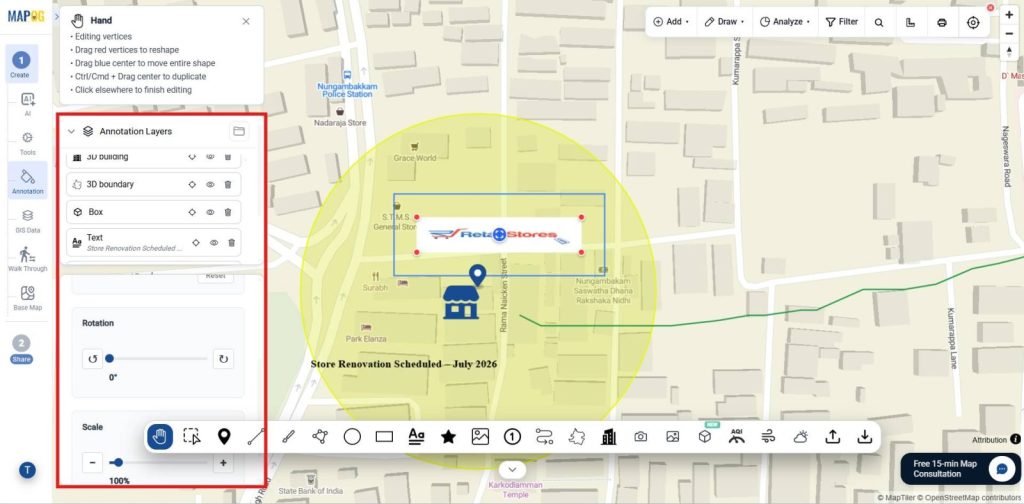
3. Image Shape Annotation
- Purpose: Add custom images as map annotations to provide visual identification of retail locations and assets.
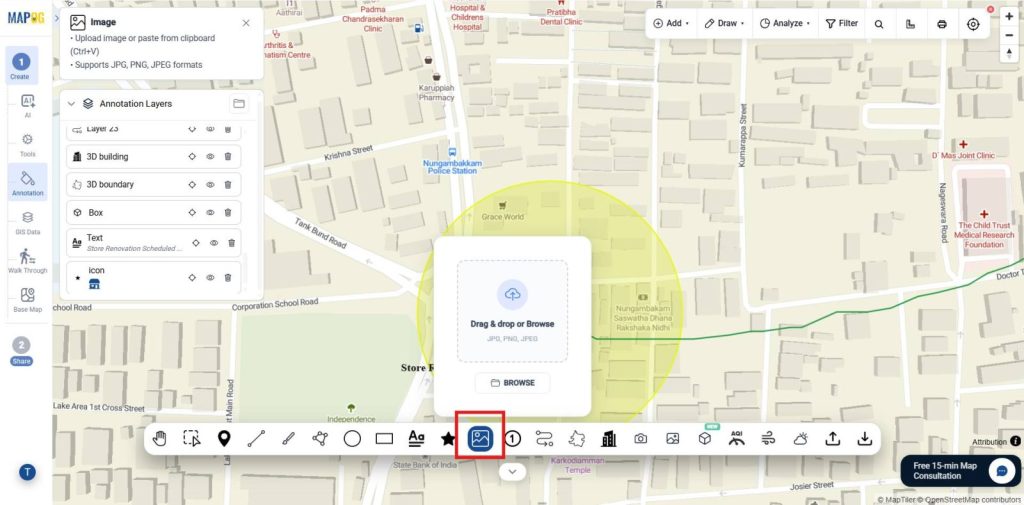
- Use Cases & Industries: Display logos, images, and brand visuals for retail locations.
- For Example Idea: Use a retail brand logo image as the map marker for all store locations and place the image where required.
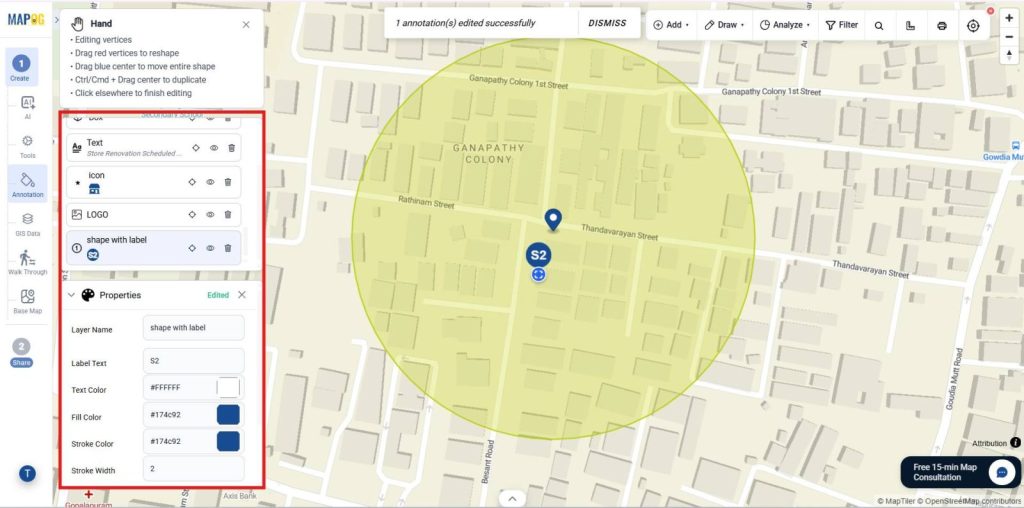
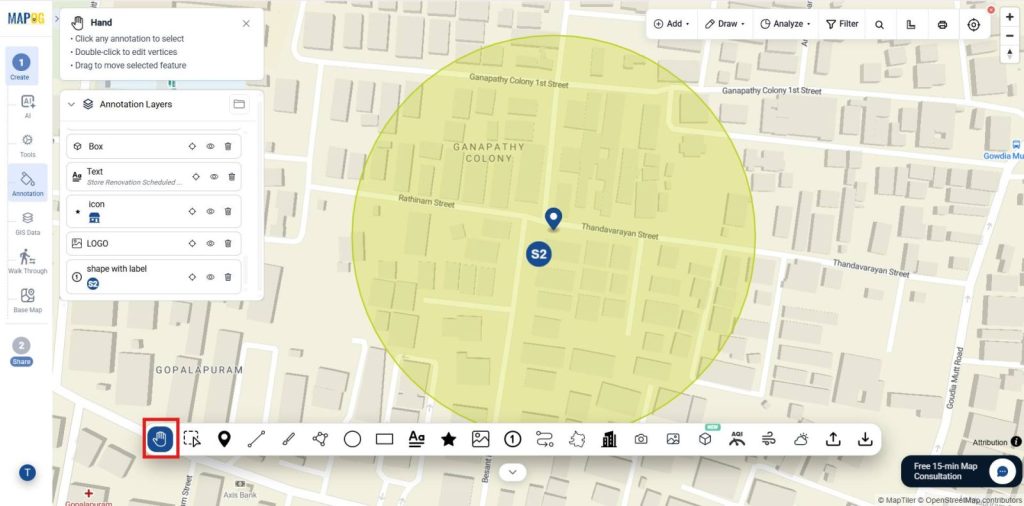
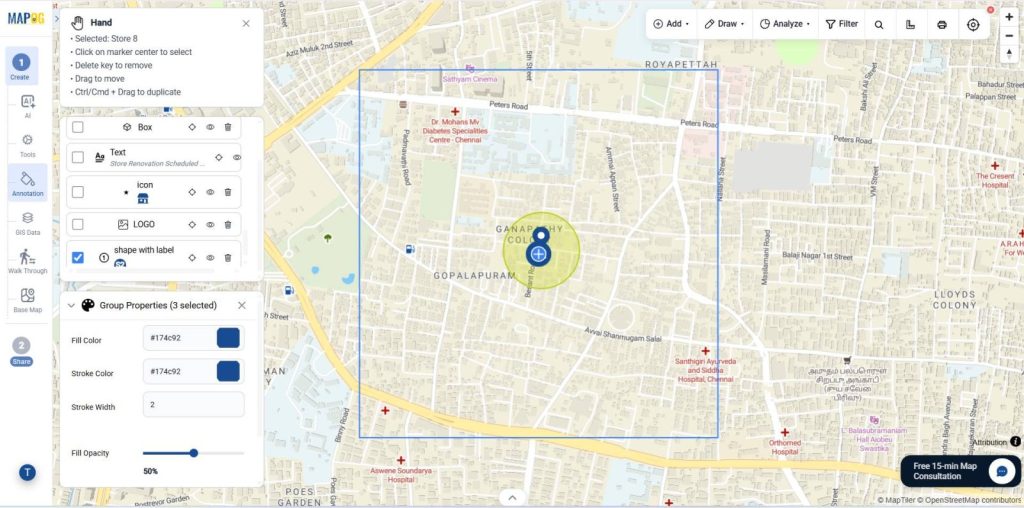
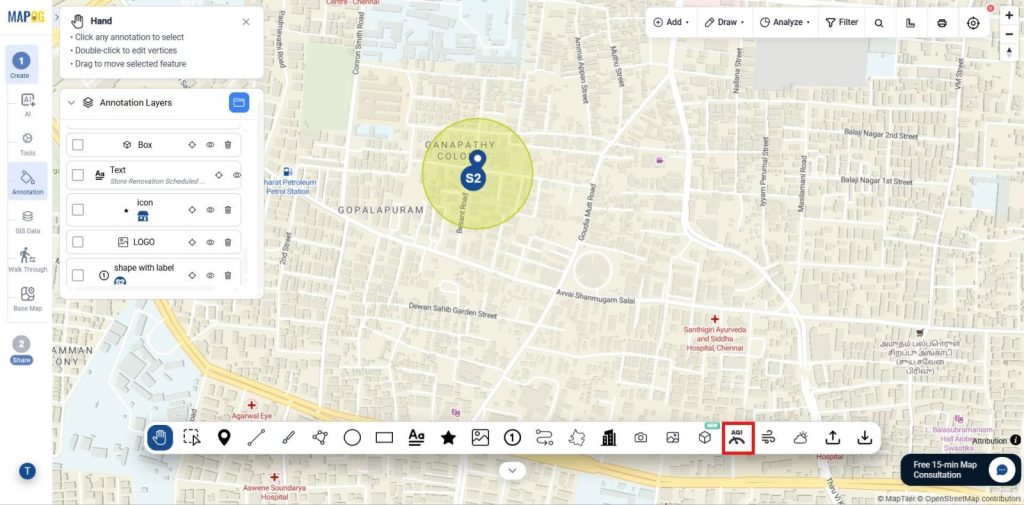
4. Shape with Label Annotation
- Purpose : Create geometric shapes with labels to identify retail territories, service areas, store zones, and operational regions.
- Use Cases & Industries: Define territories, coverage areas, and retail zones.
- For Example Idea: Add the shape with the labels and name it as you needed from the label text.
MAPOG Annotation Tool: Navigation & Viewing
1. Pan Tool
- Purpose: Navigate across the map without creating or editing annotations.
- Use Cases & Industries: Explore areas, assets, and project sites.
- For Example Idea: Review retail stores across different city zones by panning between locations.
2. Information Tool
- Purpose: View annotation details and metadata.
- Use Cases & Industries: Verify records, inspect asset information, and review project details in GIS and asset management.
- For Example Idea: Open a store location and review operational details.
Analysis & Environmental Layers
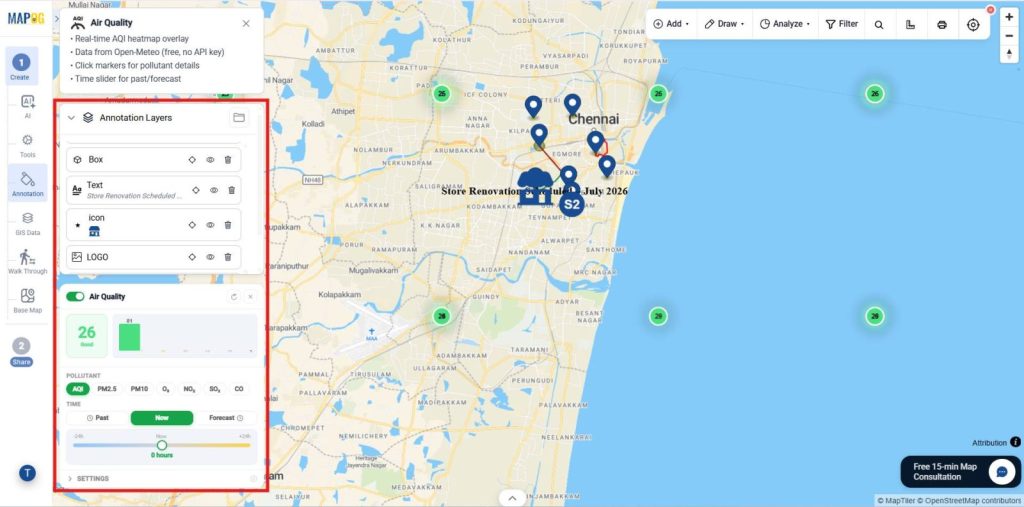
1. AQI Tool
- Purpose: Display air quality information on the map.
- Use Cases & Industries: Monitor pollution levels and environmental conditions.
- For Example Idea: Compare AQI levels across city regions.
2. Environment Tool
- Purpose: Similarly, View current weather conditions and forecasts.
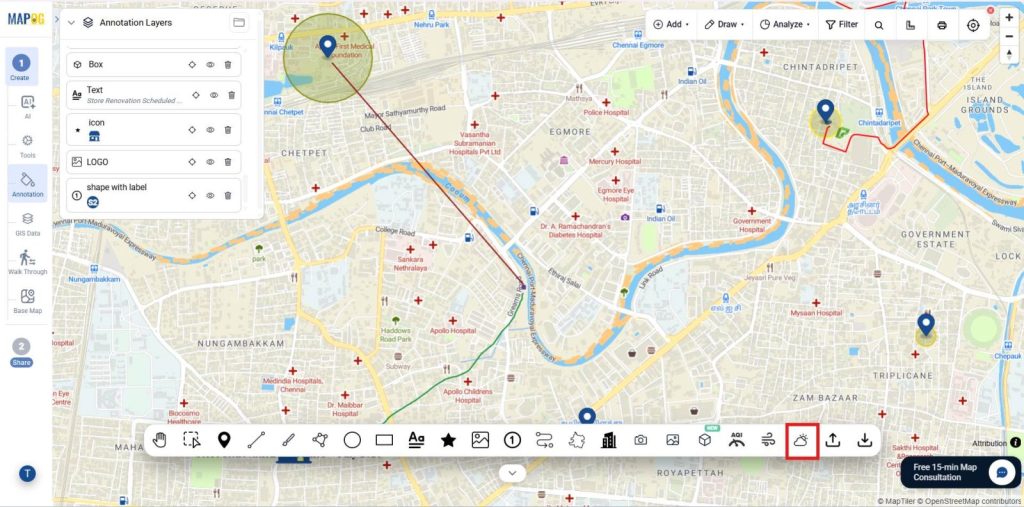
- Use Cases & Industries: Additionally, Support logistics, field operations, agriculture, and event planning.
- For Example Idea: Monitor rainfall forecasts for delivery operations.

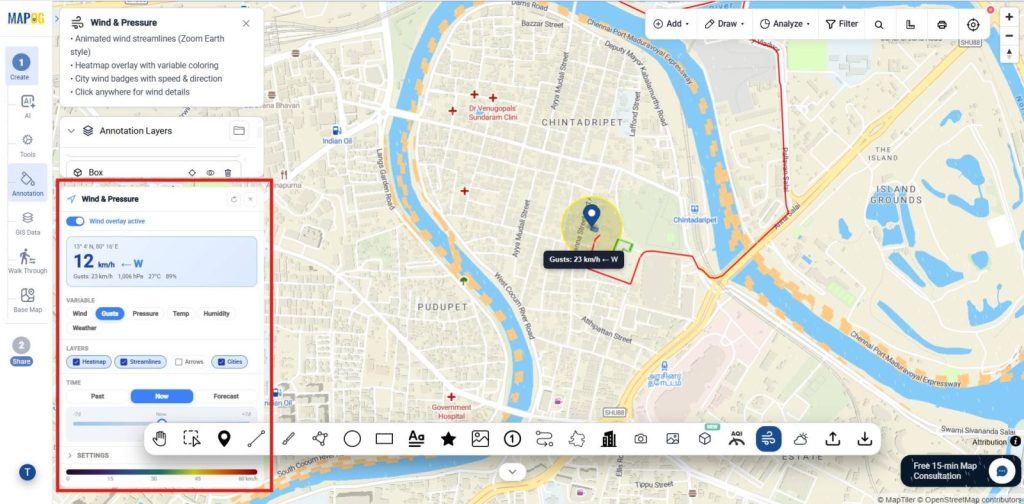
3. Wind and Pressure Tool
- Purpose: Finally, Visualize wind speed and direction.
- Use Cases & Industries: Support renewable energy planning, environmental studies, and aviation.
- Example Idea: Nevertheless, Analyze wind patterns around a wind farm site.
Export & Collaboration
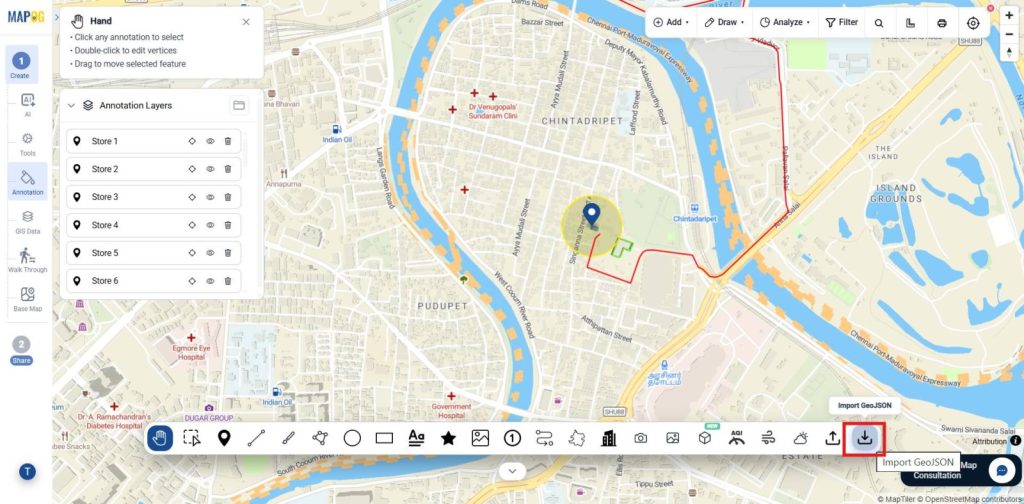
1. GeoJSON Import
Hence, Import GeoJSON files to quickly add retail store locations, routes, territories, and service areas for mapping and spatial analysis.
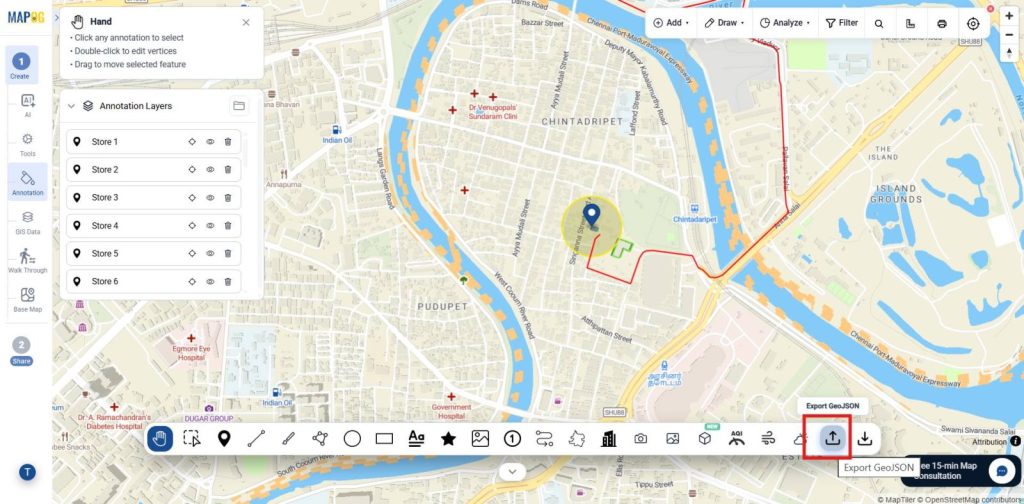
2. GeoJSON Export
Thus, Export map features as GeoJSON to share store locations, routes, and delivery zones for backup, integration, and GIS analysis.
Conclusion
In conclusion, the MAPOG Annotation Tool enables retailers to create interactive maps for store management, delivery planning, site inspections, and network expansion, improving operational efficiency, visibility, and decision-making across their business.
As a result, Explore helpful blogs