Traditional field surveys often cause delays, data mismatches, and poor location accuracy. MAPOG simplifies the process by combining field data collection and mapping into one real-time workflow.
Key Concept: Collect Field Survey Data with Media & GPS
Instead of collecting notes separately and mapping later, MAPOG enables direct data capture on the interactive map. You can record field observations along with photos, videos, and precise GPS coordinates in one place.
What Is Field Survey Data Collection with Media & GPS?
In simple terms, it’s a GIS-based method where field data, photos, videos, and GPS locations are captured in real time and automatically organized on a map. This improves accuracy, reduces manual errors, and speeds up surveys.
Methodology: Collect Field Survey Data with Media & GPS
Organizing survey data by type improves accuracy and speeds up analysis.
1. Configure the Field Survey Project
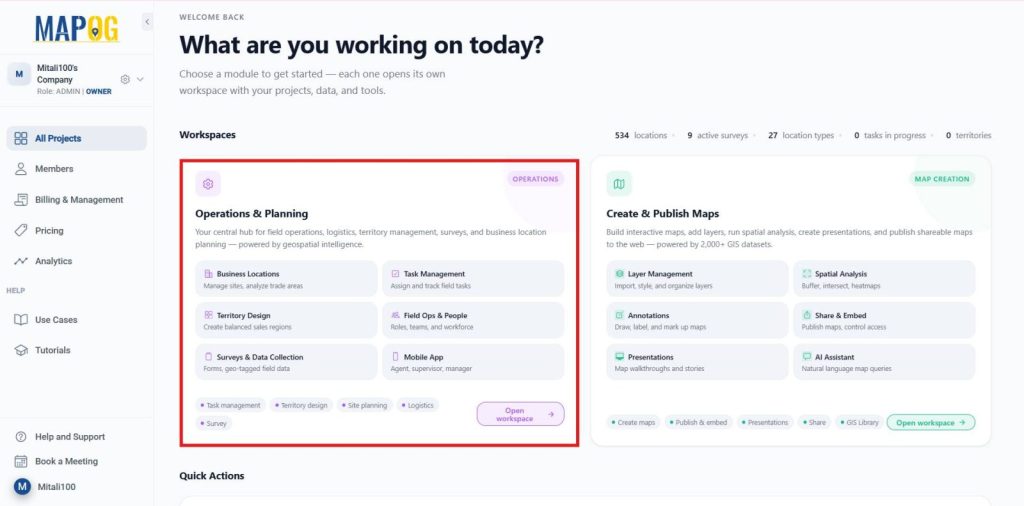
Launch MAPOG, navigate to Operations and Planning, and then select Open Workplace.
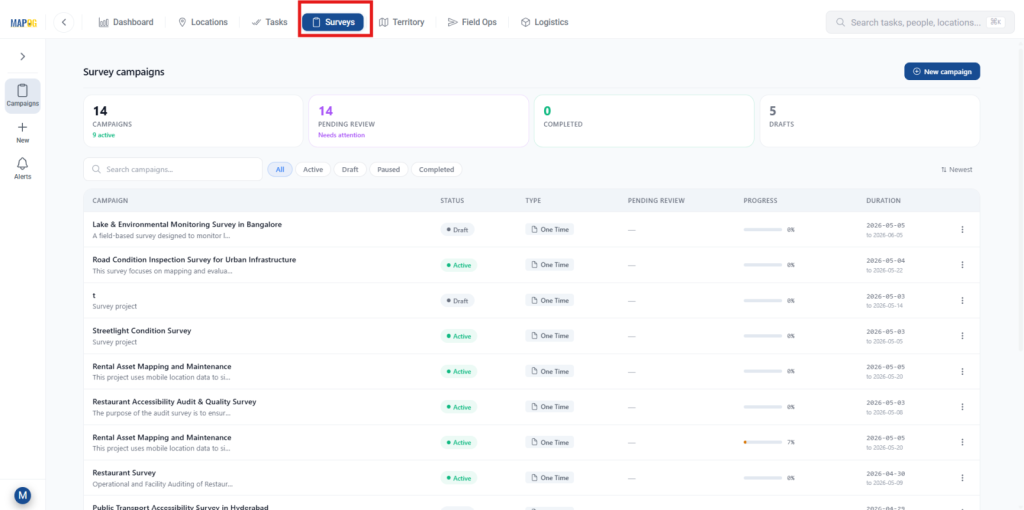
Next, navigate to the Survey Dashboard to get started.
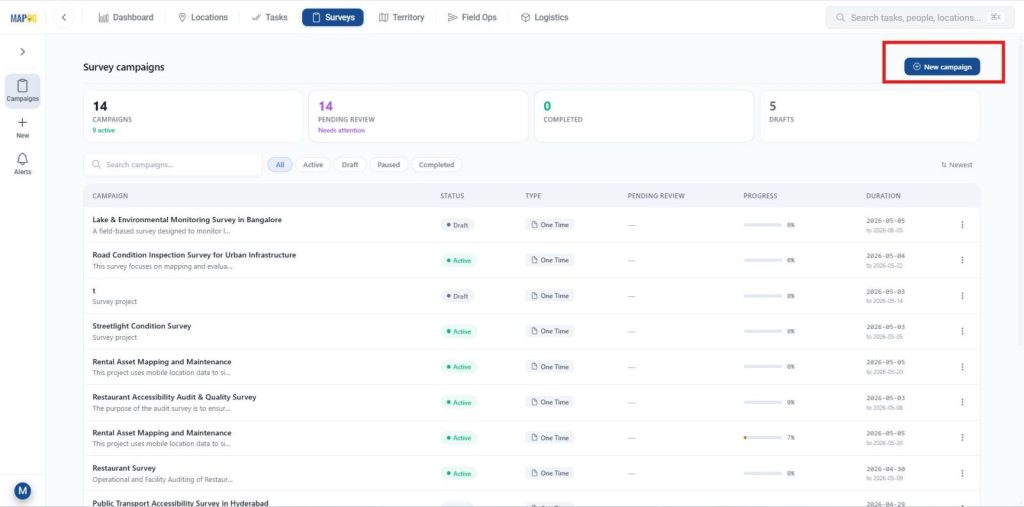
Click + New campaign to start a new field survey project.
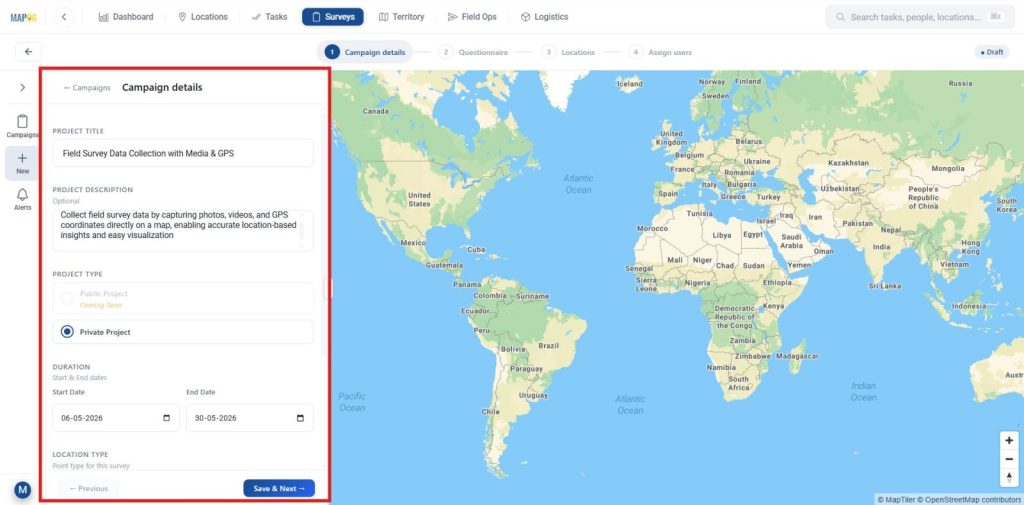
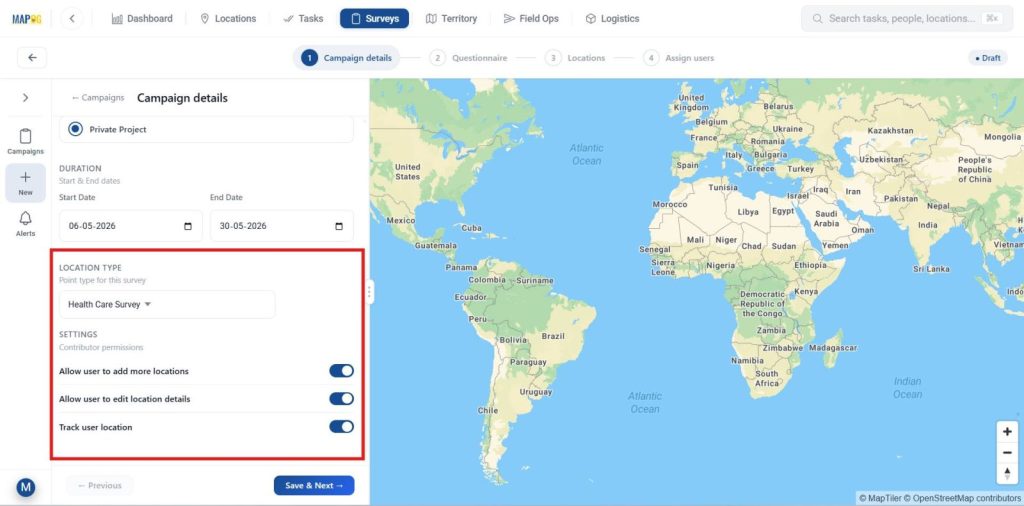
Enter project details like title, description, survey type, duration, and frequency to keep data collection structured and consistent in campaign details.
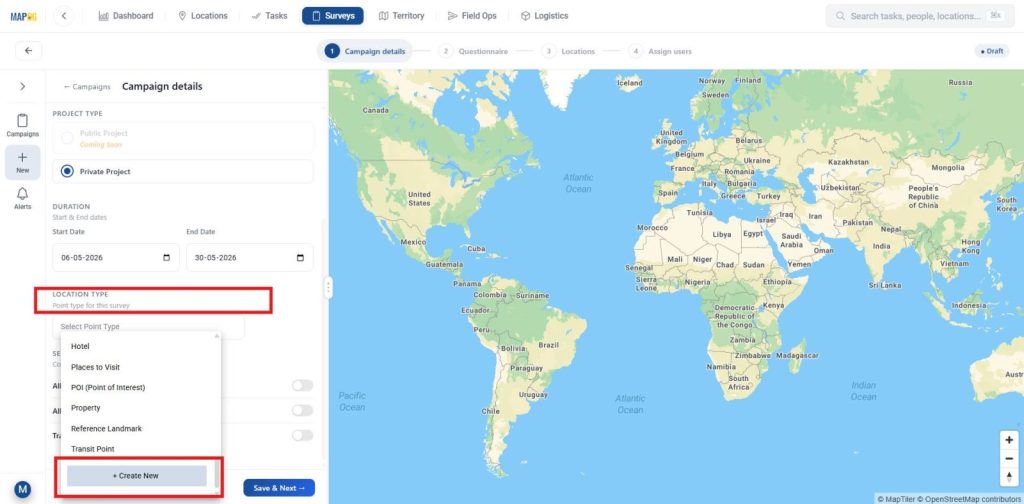
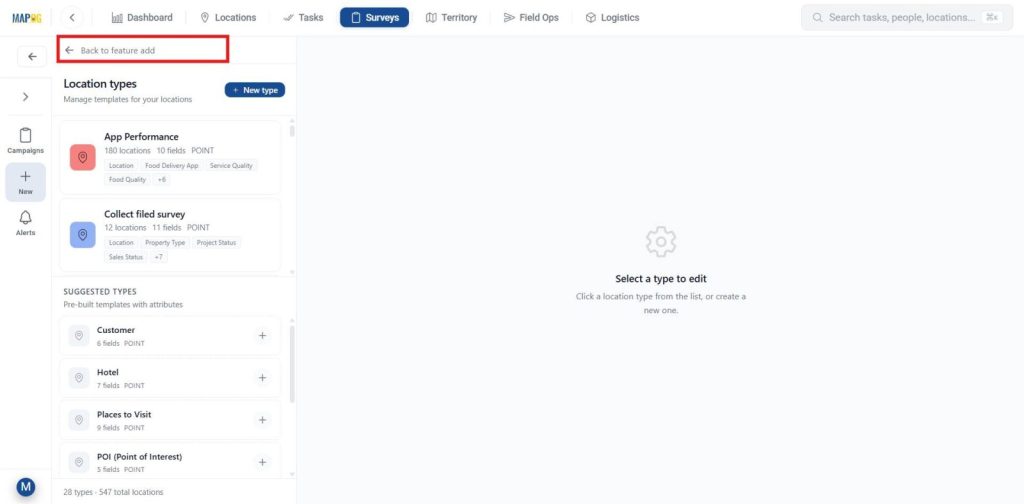
2. Create New location type
Next, go to Location Type and click + Create New to build a custom survey template.
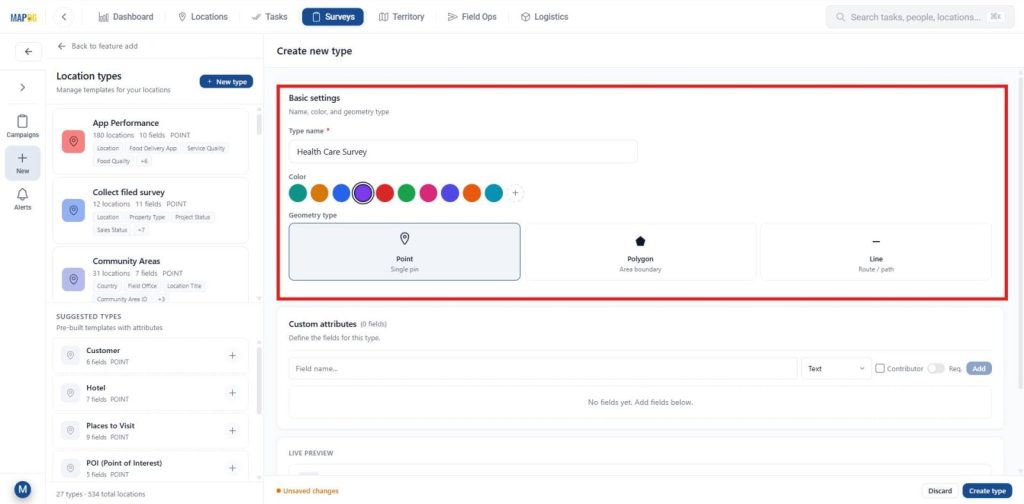
Name it, choose Point geometry (for GPS-based capture), assign a color, and save.
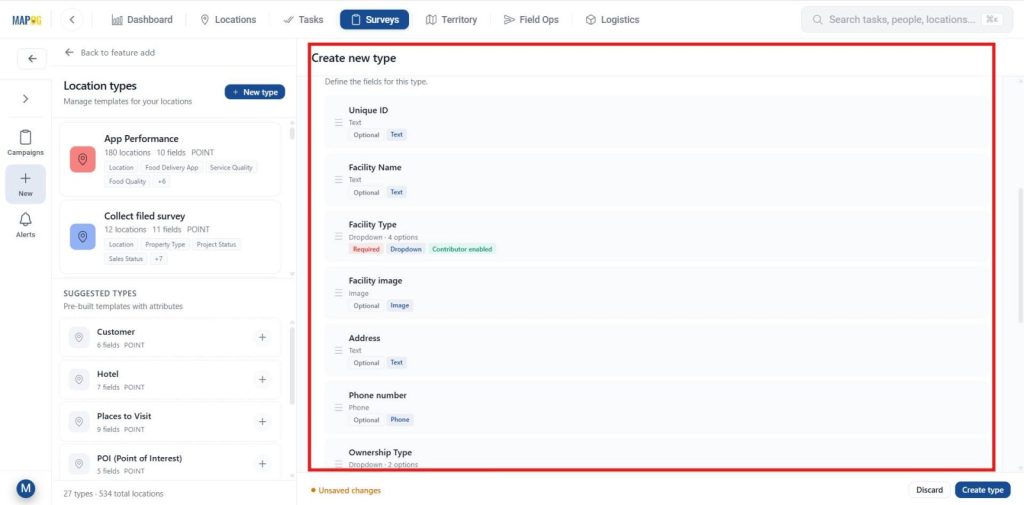
Include field attributes like Facility Name, Facility Type, Photos, Videos, and Operating Hours. Assign suitable field types (Text, Select, Image, Video, Multiselect), enable “Allow for Contributor” so teams can update data in real time, and set essential fields as Required to ensure accurate and consistent reporting.
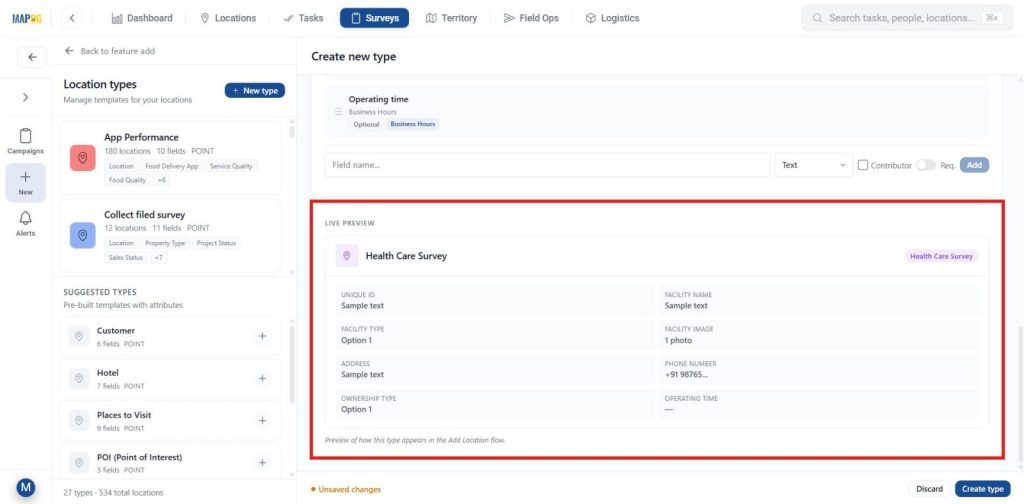
After adding all attributes, use Live Preview to review them, then click Create Type to create a new one.
Then, return to the previous step to add features.
Select your created survey type from the dropdown, configure Contributor Permissions (like adding/editing points and tracking users), then click Save & Continue to finalize your survey setup.
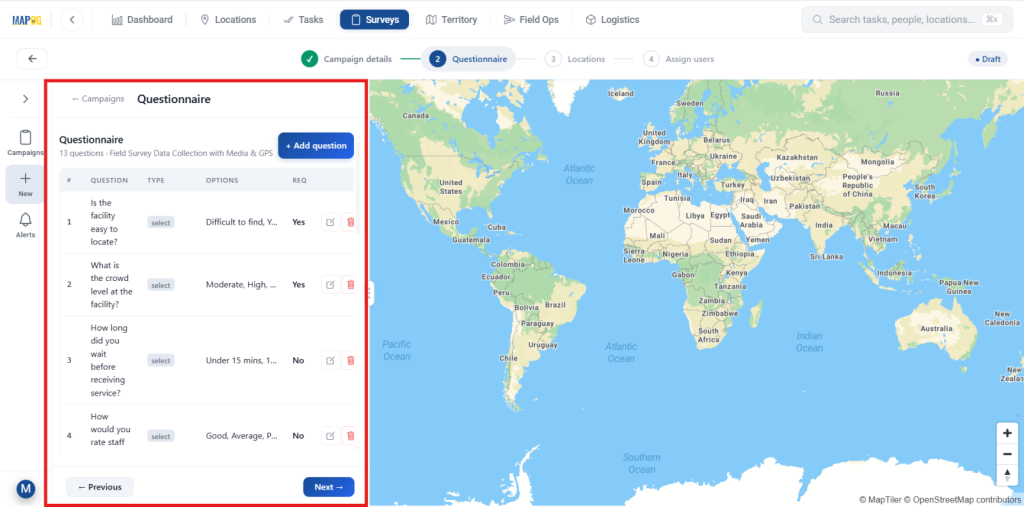
3. Build a Structured Healthcare Questionnaire
After completing the setup, navigate to the Add Question section to design your survey.
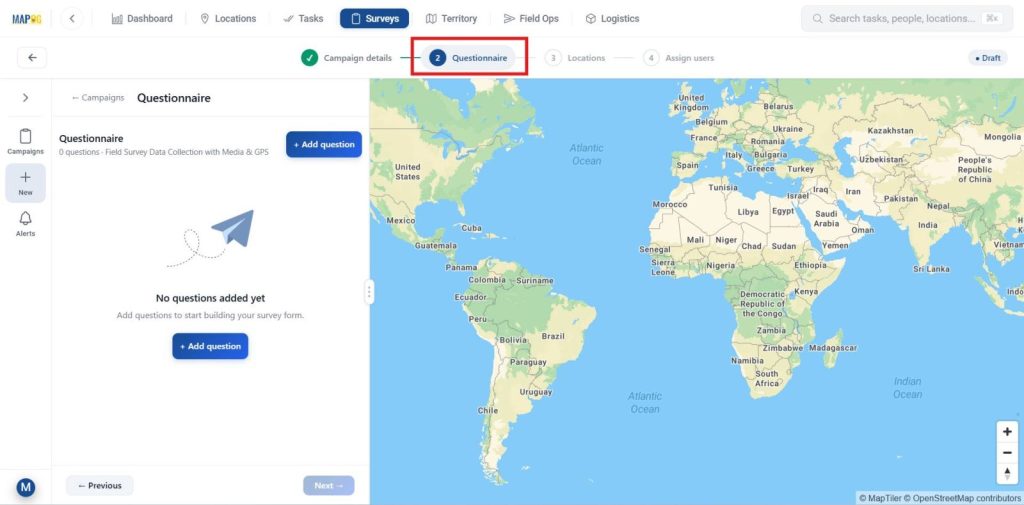
Create healthcare-focused questions to capture services, patient load, and operating hours. Use suitable input types like Text, Select/Multiselect, and Image or Video, then mark key fields as required for reliable data collection.
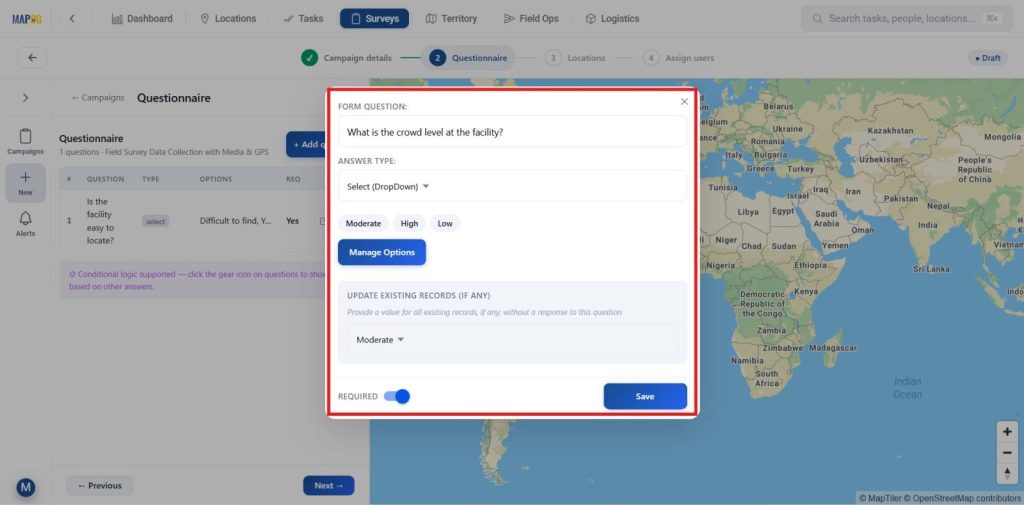
Once all questions are added, review them for accuracy and completeness, then move to the next step.
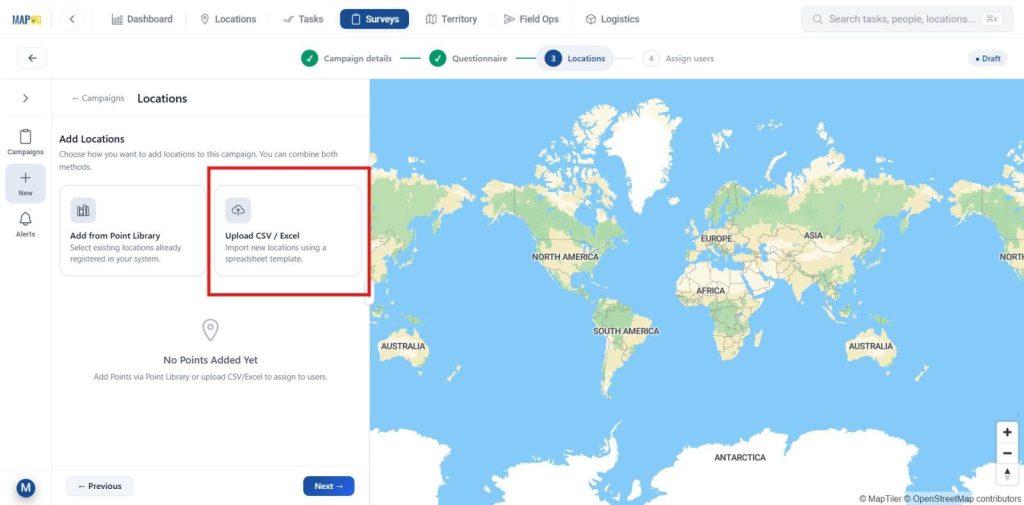
4. Import Facility Locations Using Excel
With your questionnaire ready, to add locations use Upload CSV/Excel to import multiple healthcare facilities at once or add from point library.
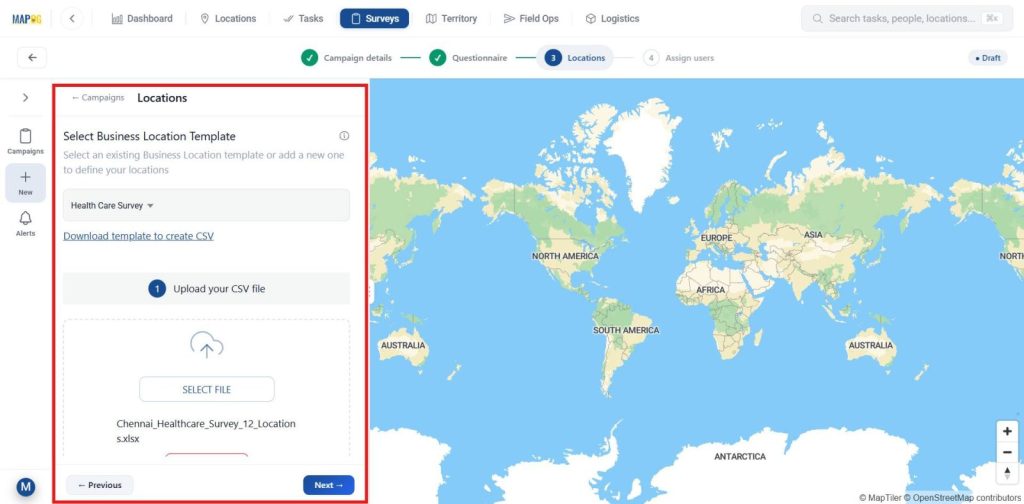
Upload your Excel file, and the system will automatically apply the selected healthcare survey template and move to next.
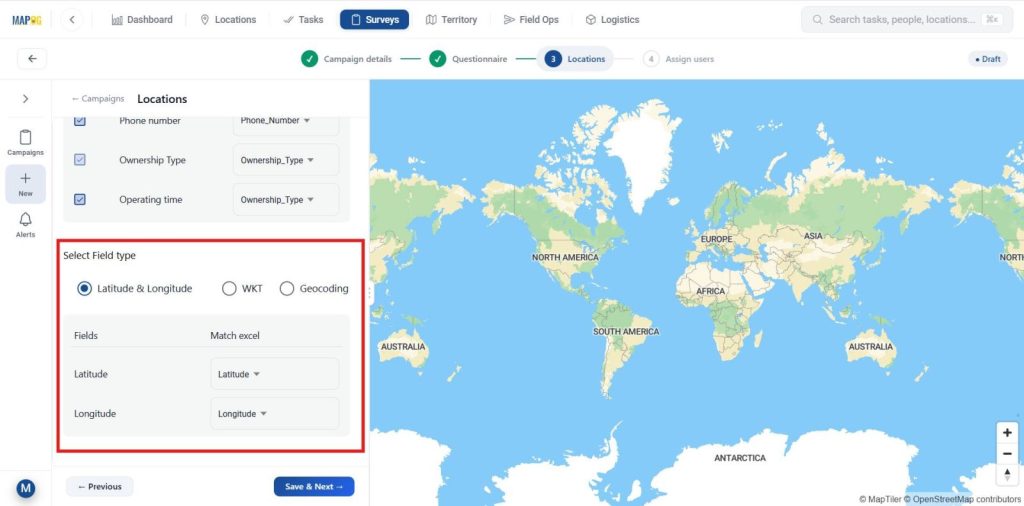
In Define Location Fields, set a Unique ID or choose Auto Generate, map facility attributes to Excel columns, select display fields, and decide whether to Update or Ignore Duplicates.
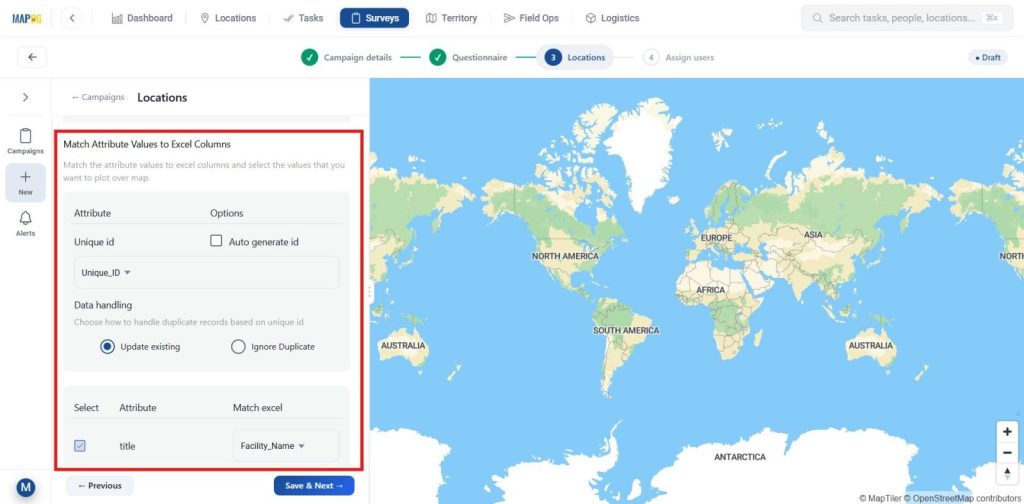
Assign Latitude and Longitude correctly under Select Field Type, then click Submit to complete the import.
All healthcare facility locations will appear as points on the map automatically—then proceed to the next step.
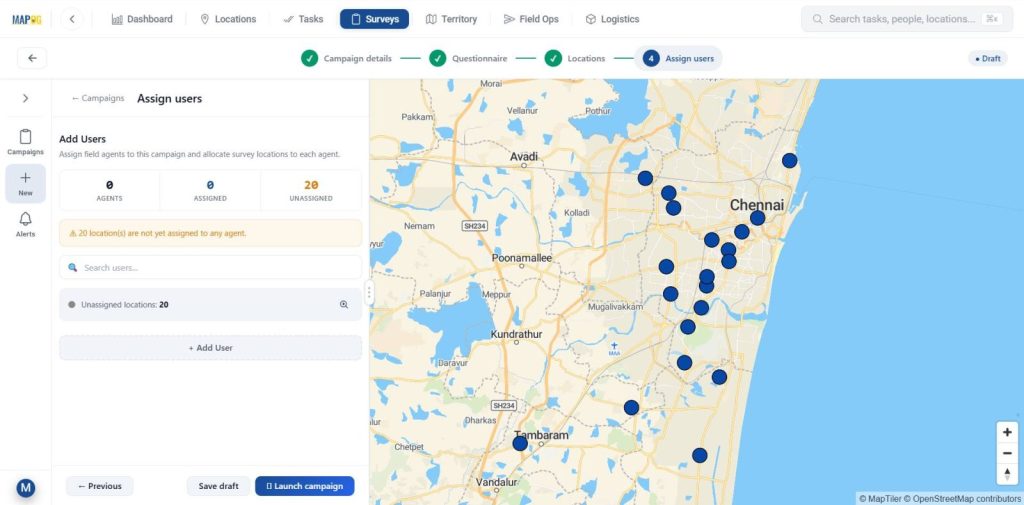
5. Add Contributors and Assign Healthcare Survey Zones
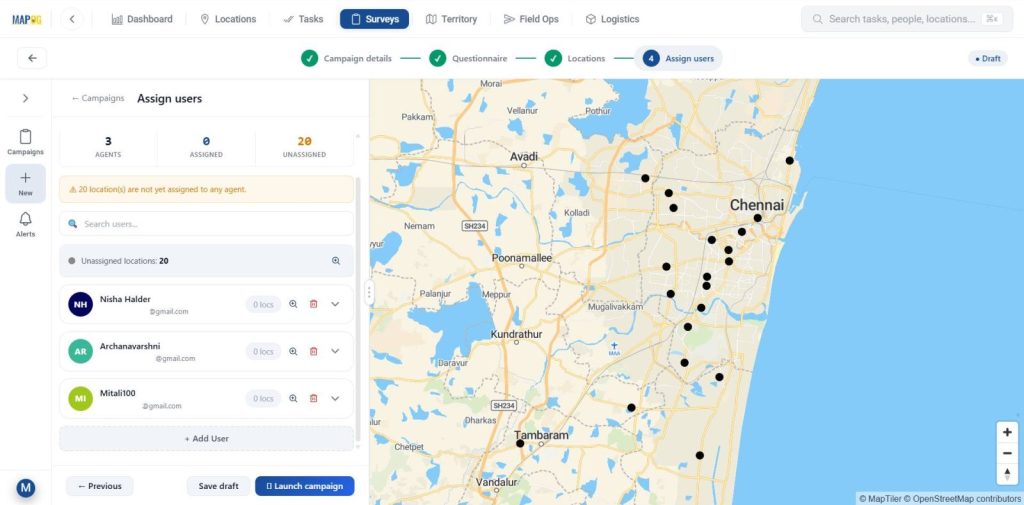
After importing the data, go to the Add User section to manage your healthcare survey team and click Add Member to include new contributors.
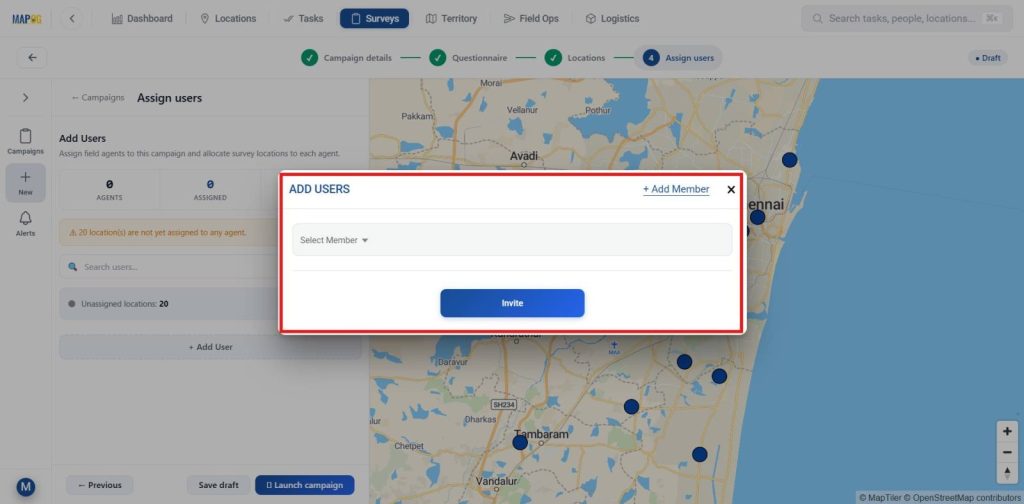
In Add Users, select from existing users and assign them as team members.
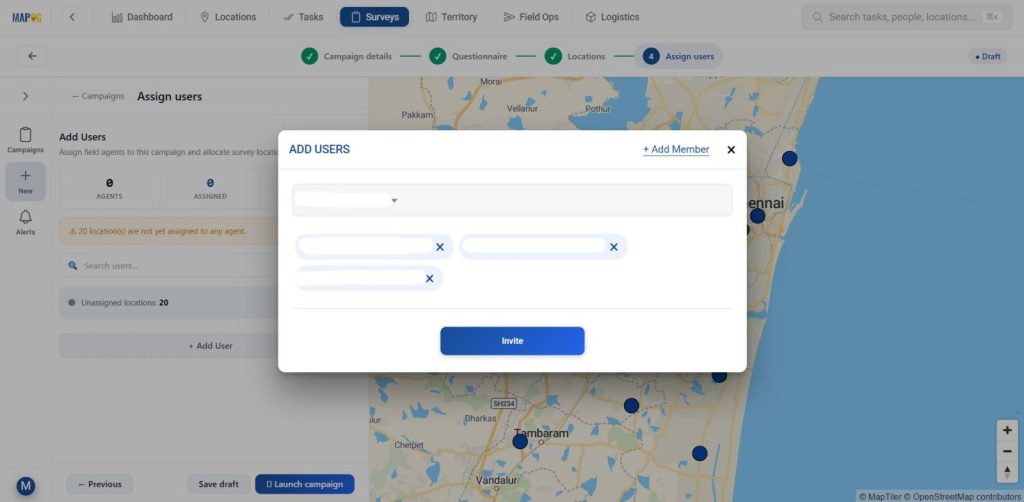
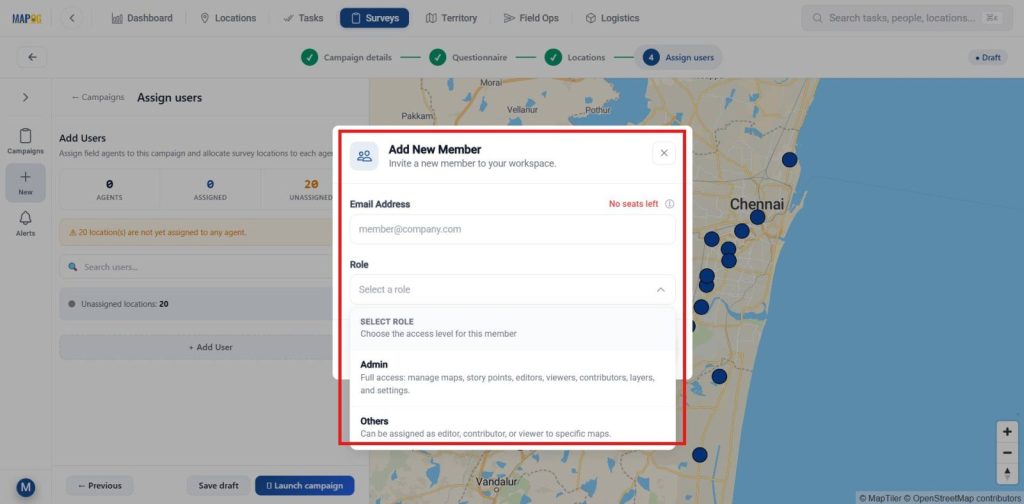
To add new users, enter their email ID, assign an appropriate role, and click Save.
Next, choose the added members from the list and click Invite to assign them as contributors.
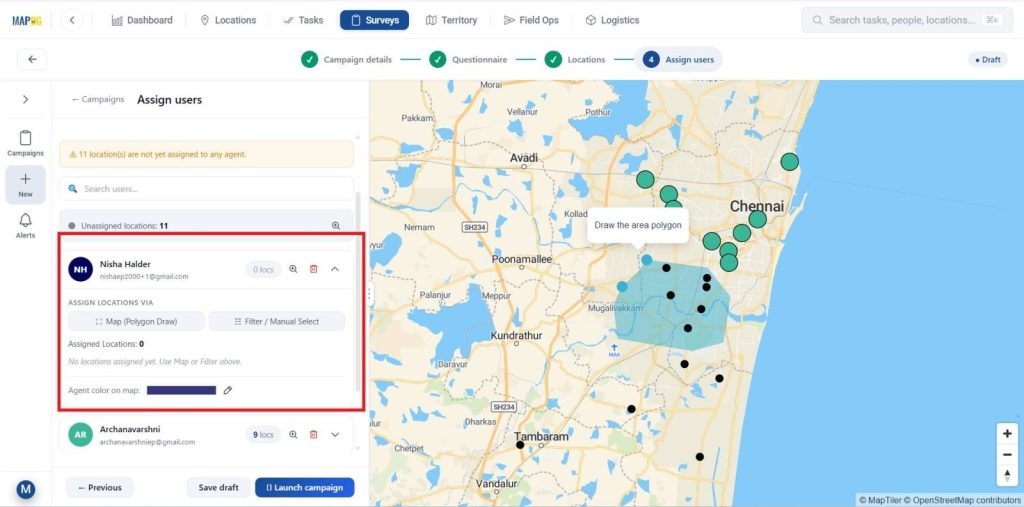
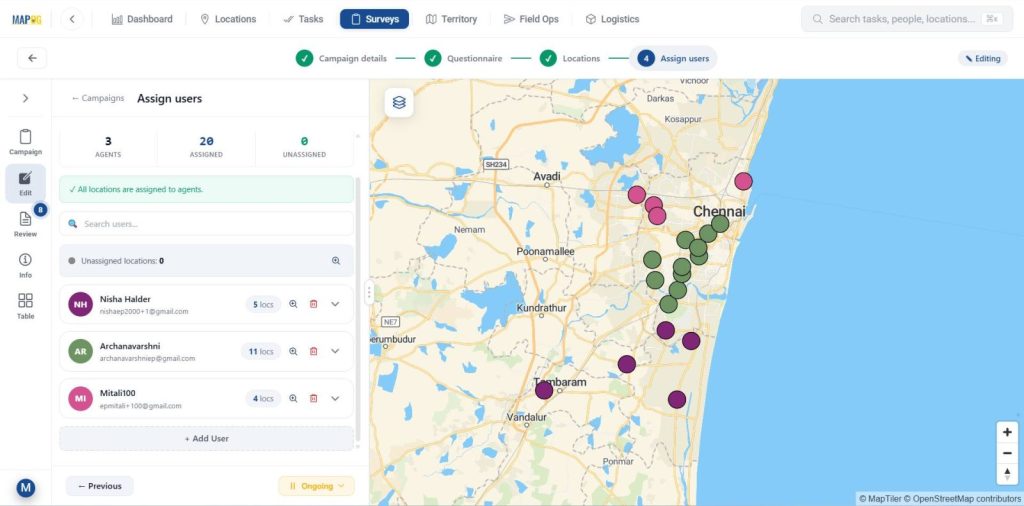
Select a contributor and use the map tool to draw assigned zones, helping divide regions and allocate specific healthcare facilities to each team member.
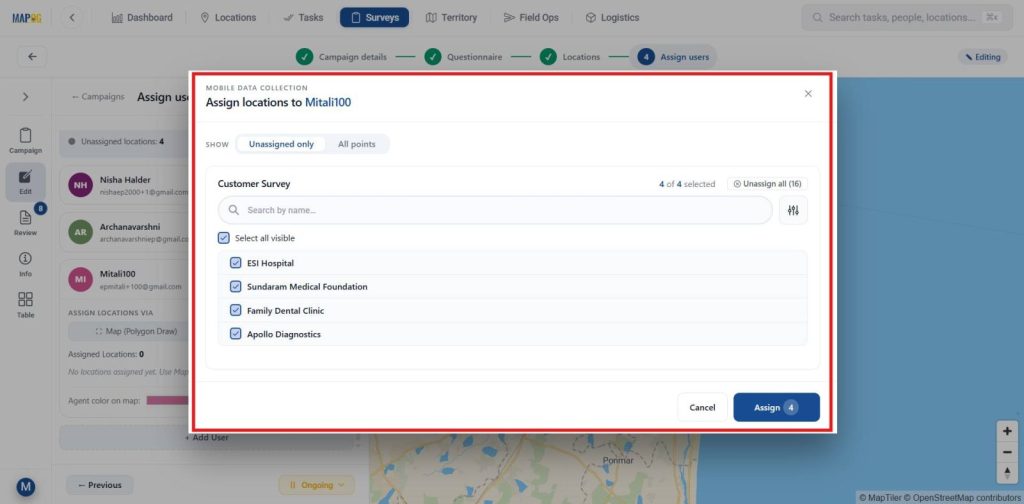
Use the filter tool to sort facilities by assigned or unassigned status for easier location allocation.
At last, assign distinct colors to each contributor’s zone for clear visual identification and better coordination.
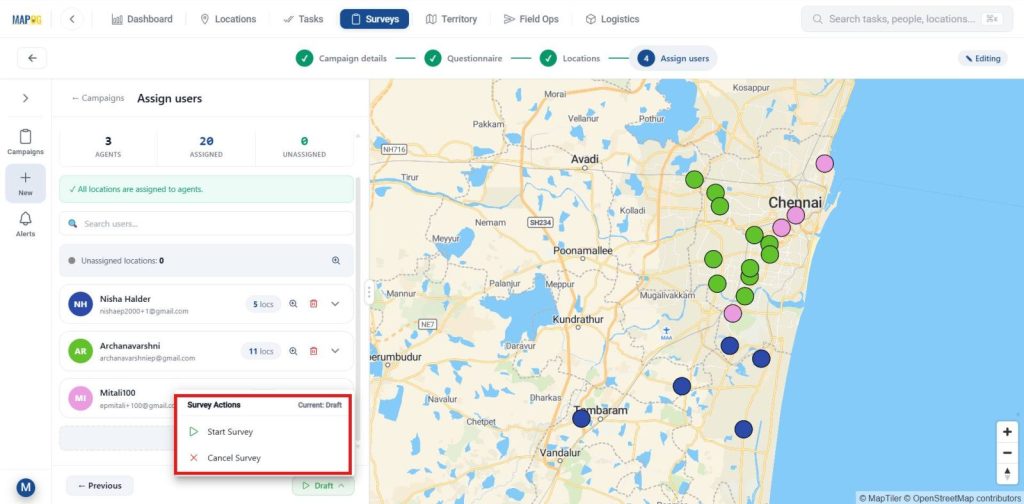
6. Launch Healthcare Survey & Analysis
With the setup complete, go to Survey and click Start Survey to begin real-time healthcare data collection.
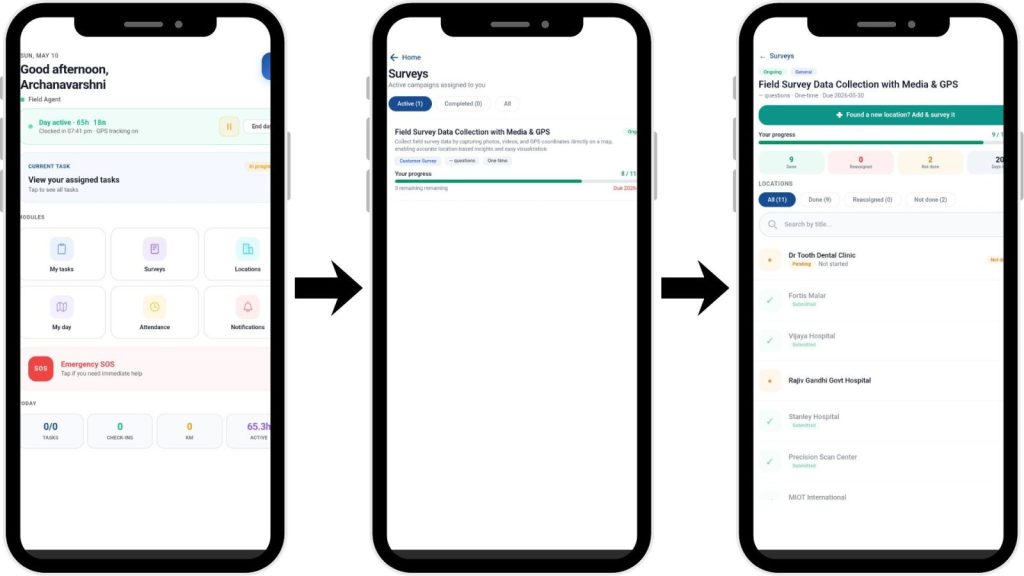
Assigned team members can open the MAPOG Contributor app, navigate to their allocated areas, add new healthcare facilities with +Find new location, record site details, and submit them for mapping.
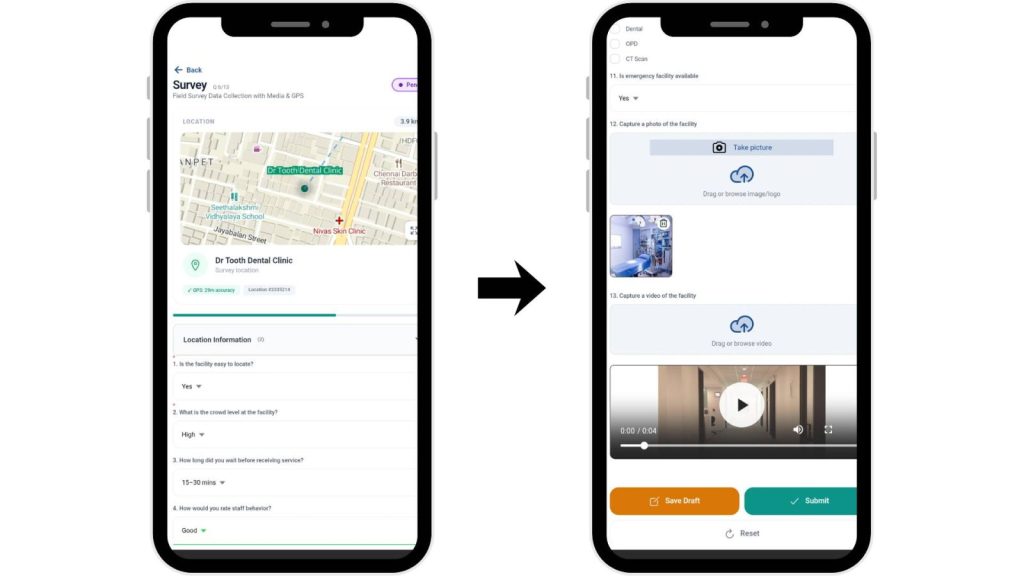
Users can access the questionnaire, fill in responses, upload images for verification, and either submit the survey or save it as a draft for later completion.
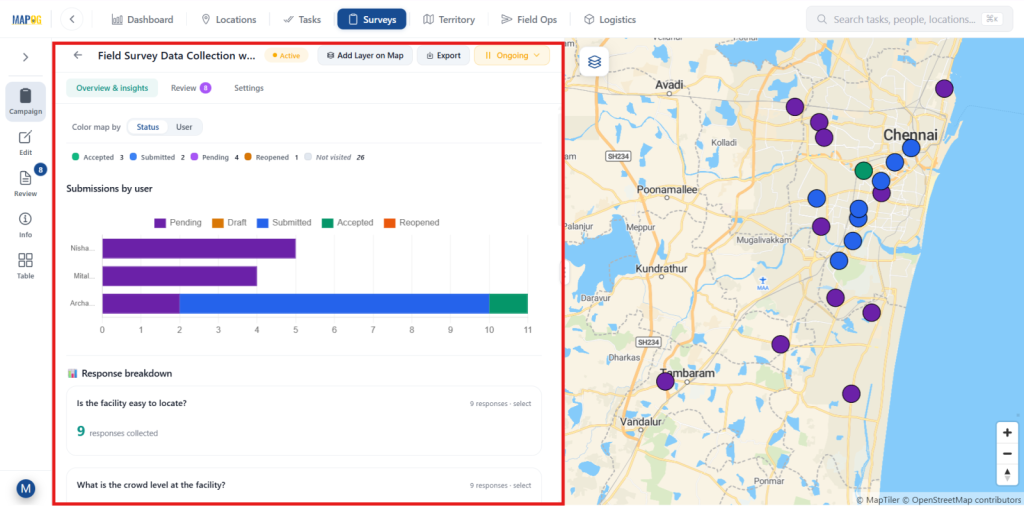
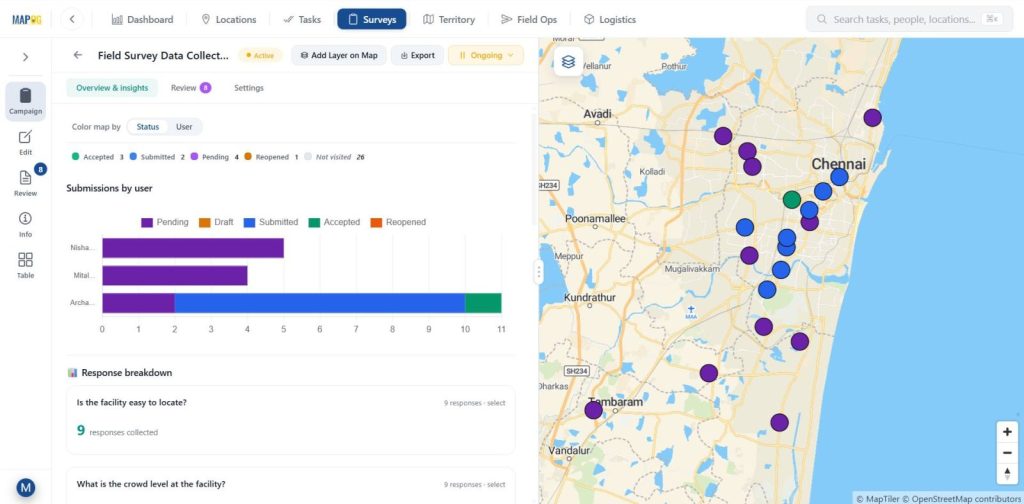
Use the Overview Dashboard to monitor survey progress and view insights and real-time updates in a structured data table.
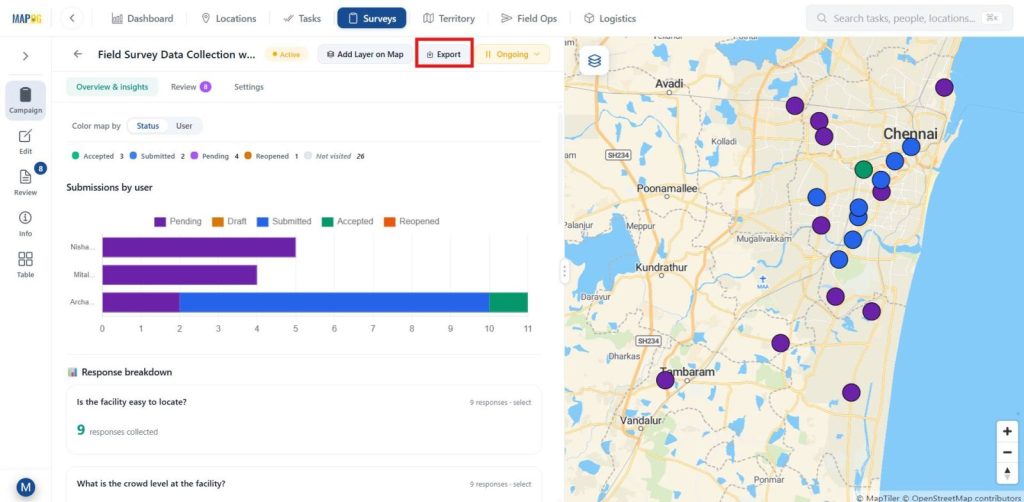
Navigate to Export Data to download all collected survey data as a CSV file for further use.
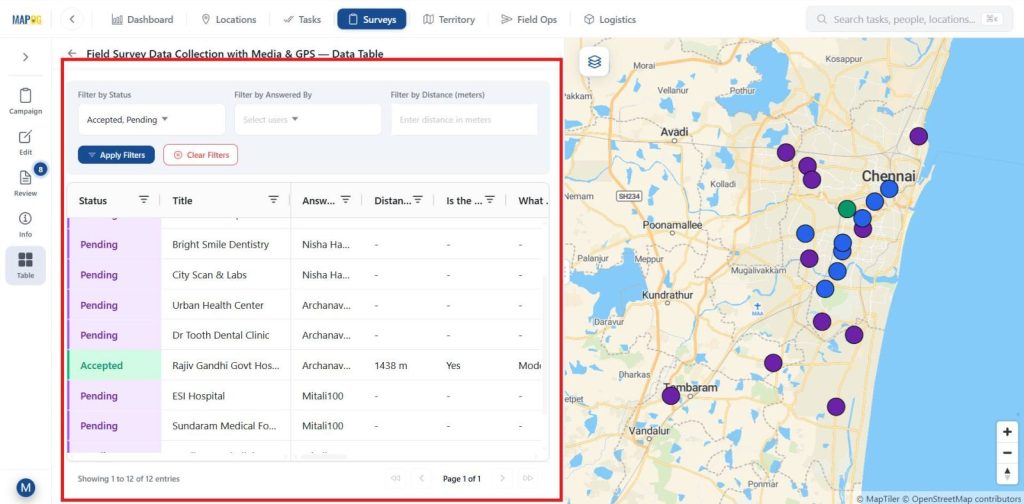
Then, apply filters to view Pending surveys, track Submitted entries, and review Accepted responses separately for better monitoring and analysis.
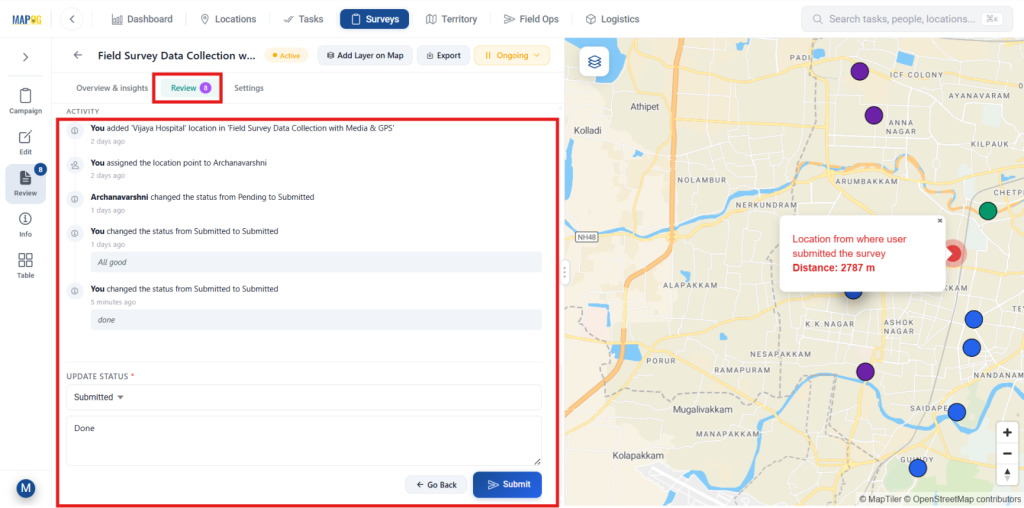
Meanwhile as a project manager, review field submissions, verify accuracy, and update the status to Accepted once validated.
Also for analysis, select Add Layer to Map to visualize data, compare datasets, and perform spatial analysis for better insights.
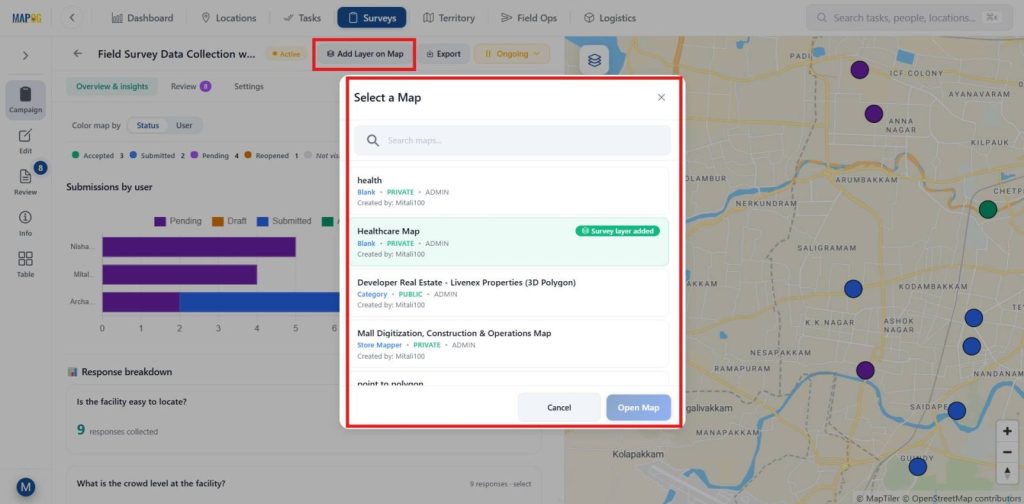
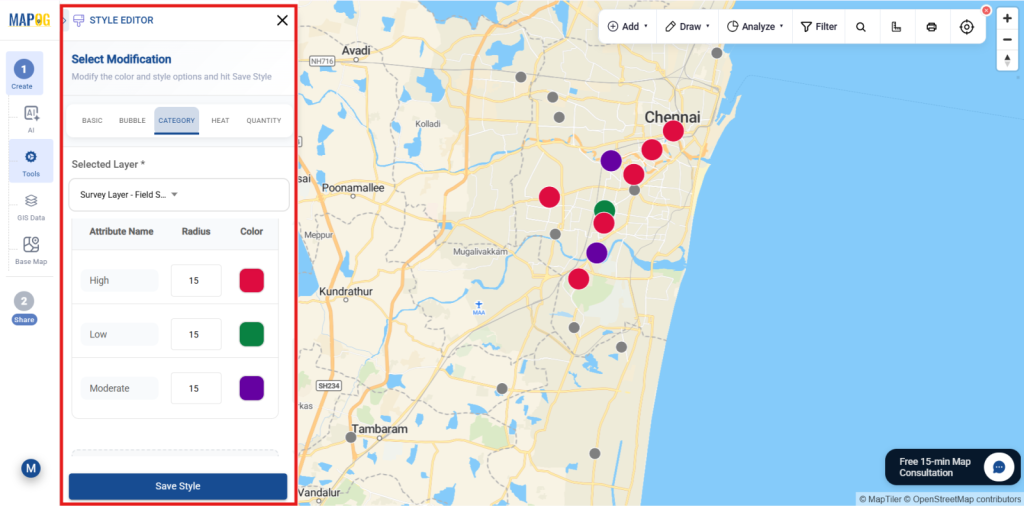
Go to Add Style Layer, select Category, choose an attribute, apply colors, and save. For example: green, red, and violet for easy facility comparison.
Industry Use Cases and Benefits
Map hospitals, clinics, and diagnostic centers on separate layers to analyze coverage, track surveys, compare data, and improve healthcare planning with faster location-based insights.
MAPOG Mobile App: Android (Play Store) and iOS (App Store)
Conclusion
In conclusion, MAPOG simplifies healthcare survey management by converting collected field data into structured maps and dashboards, helping teams monitor progress, analyze facilities, and make informed decisions efficiently.
Explore helpful blogs