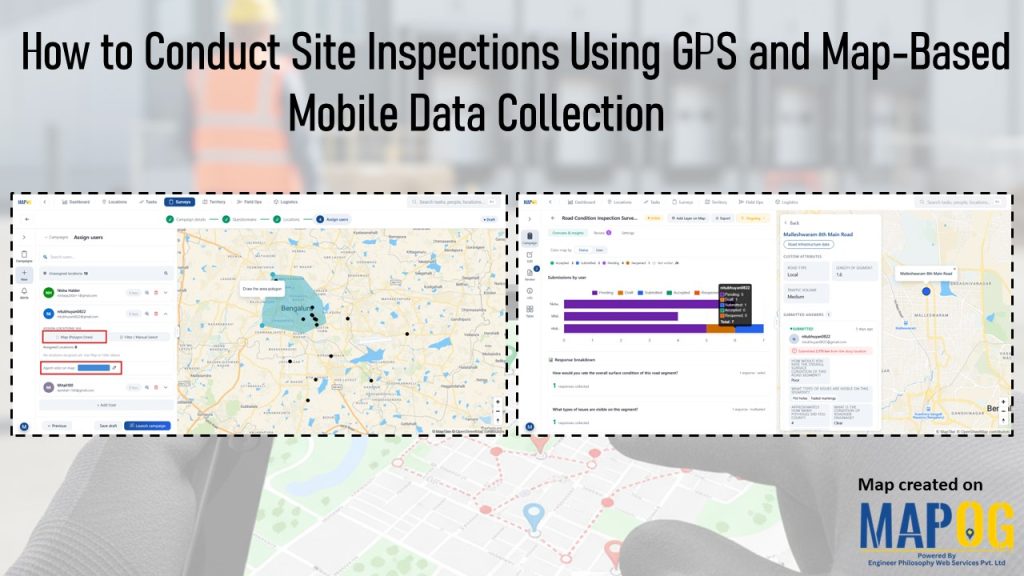
Site inspections often suffer from scattered notes, delayed updates, and missing evidence. Paper records get misplaced, photos remain disconnected from locations, and teams struggle to consolidate findings. As a result, inefficiency grows and corrective action slows.Take road infrastructure as an example. Potholes, drainage issues, and faded markings demand attention, yet traditional inspections fail to capture them consistently. That is why it is vital to conduct site inspections using GPS and map‑based mobile data collection. With MAPOG, every observation is geotagged, photos and videos tied to coordinates, severity tracked, and data unified for timely, accurate action.
Key Concept: Why Conduct Site Inspections Using GPS
Inspections go beyond recording problems; they establish context. GPS and ma p-based mobile data collection tie every detail to precise location and time, turning inspections into reliable evidence. This approach improves transparency, accelerates decision-making, and builds greater trust among stakeholders across industries.
Steps on How to Conduct Site Inspections Using GPS
1. Create a New Campaign
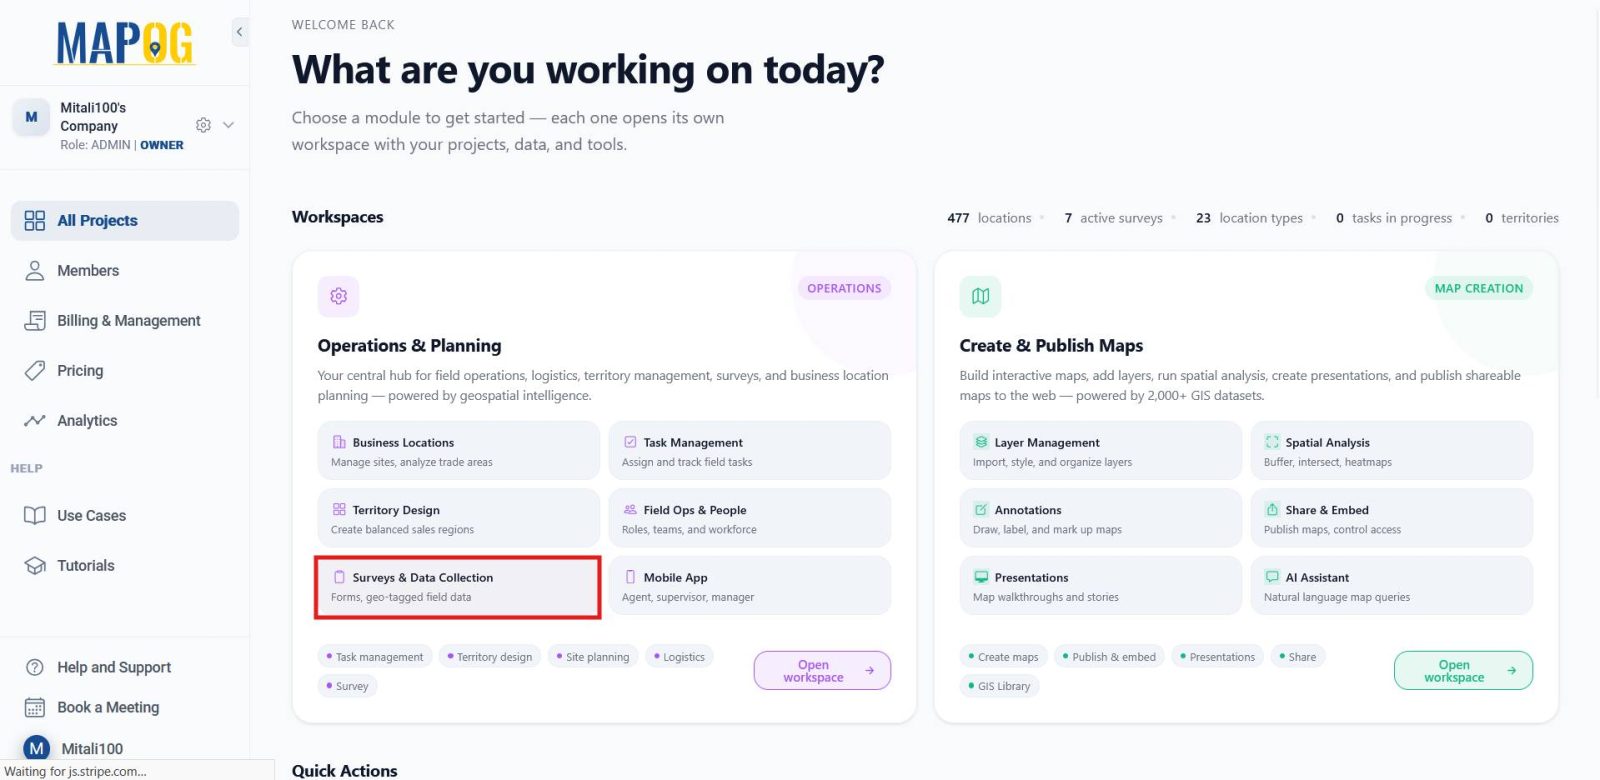
To begin, open MAPOG, navigate to Operations and Planning, and select Survey and Data Collection.
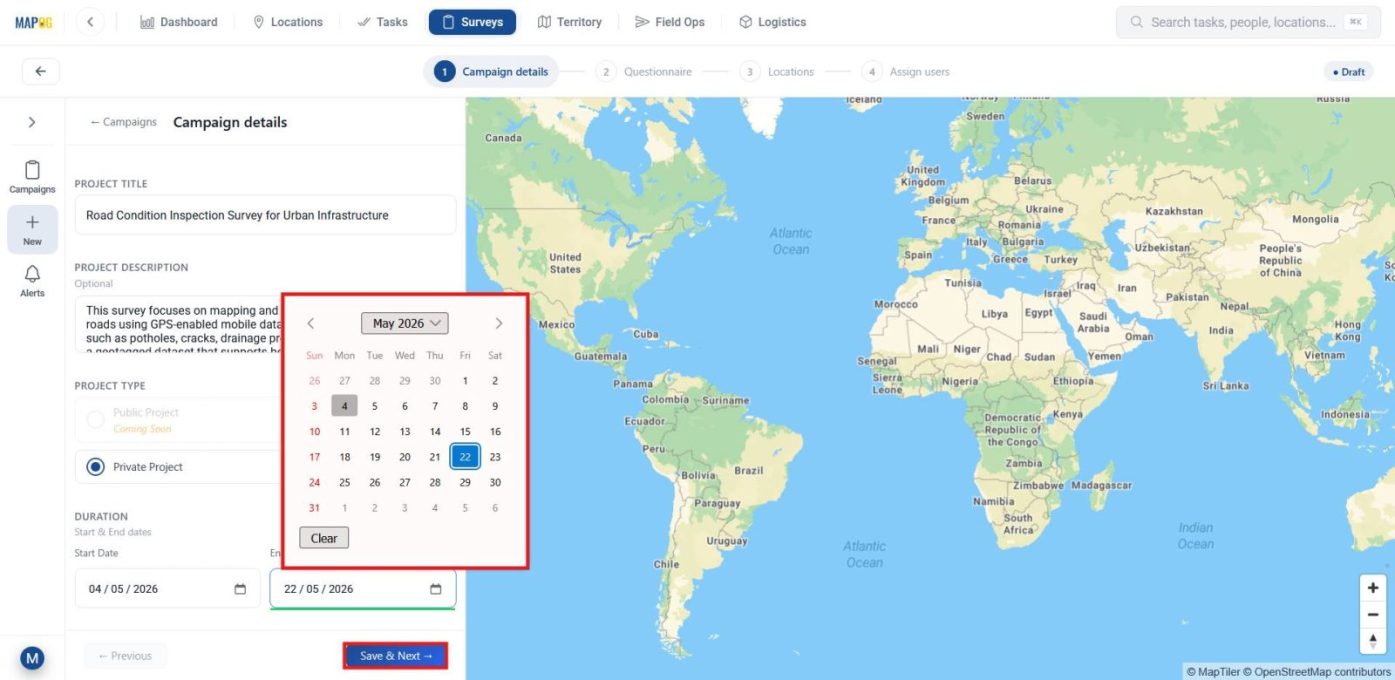
Then, click New Campaign, add a clear title, description,set project type as private and duration so the survey has a defined scope and timeline.
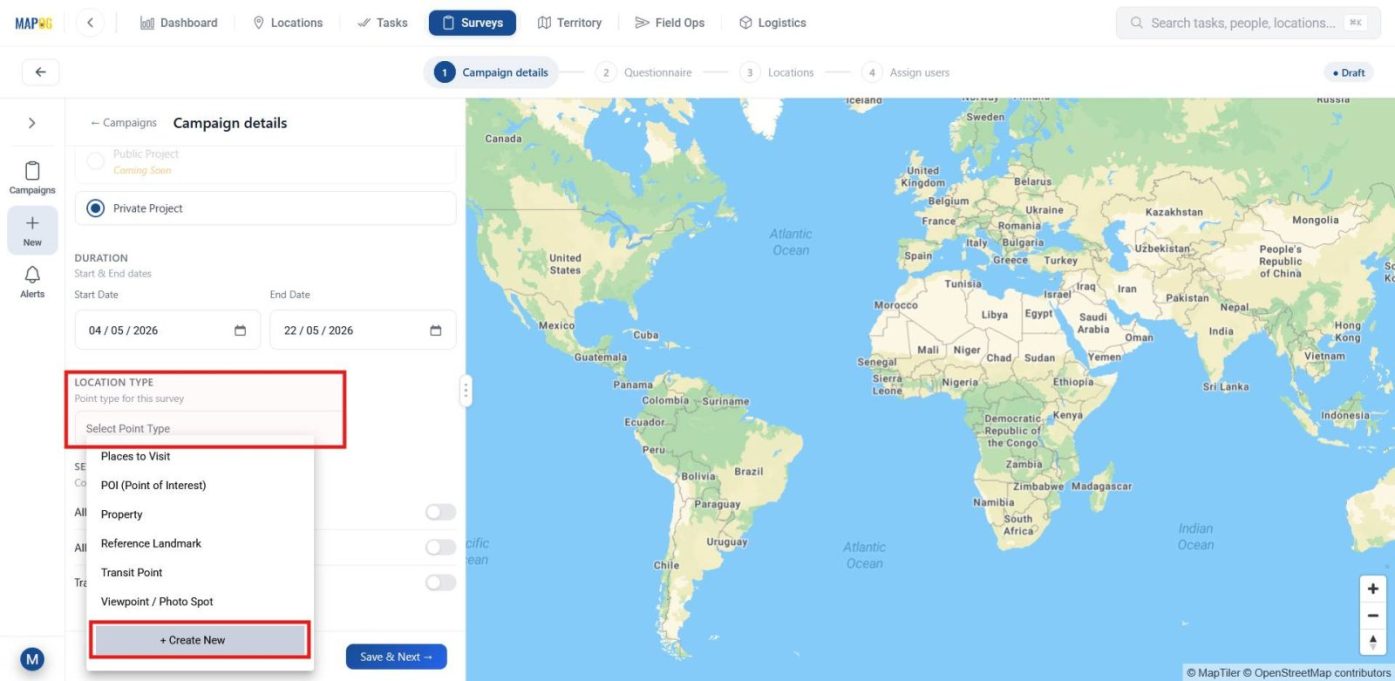
2. Create New Location Type
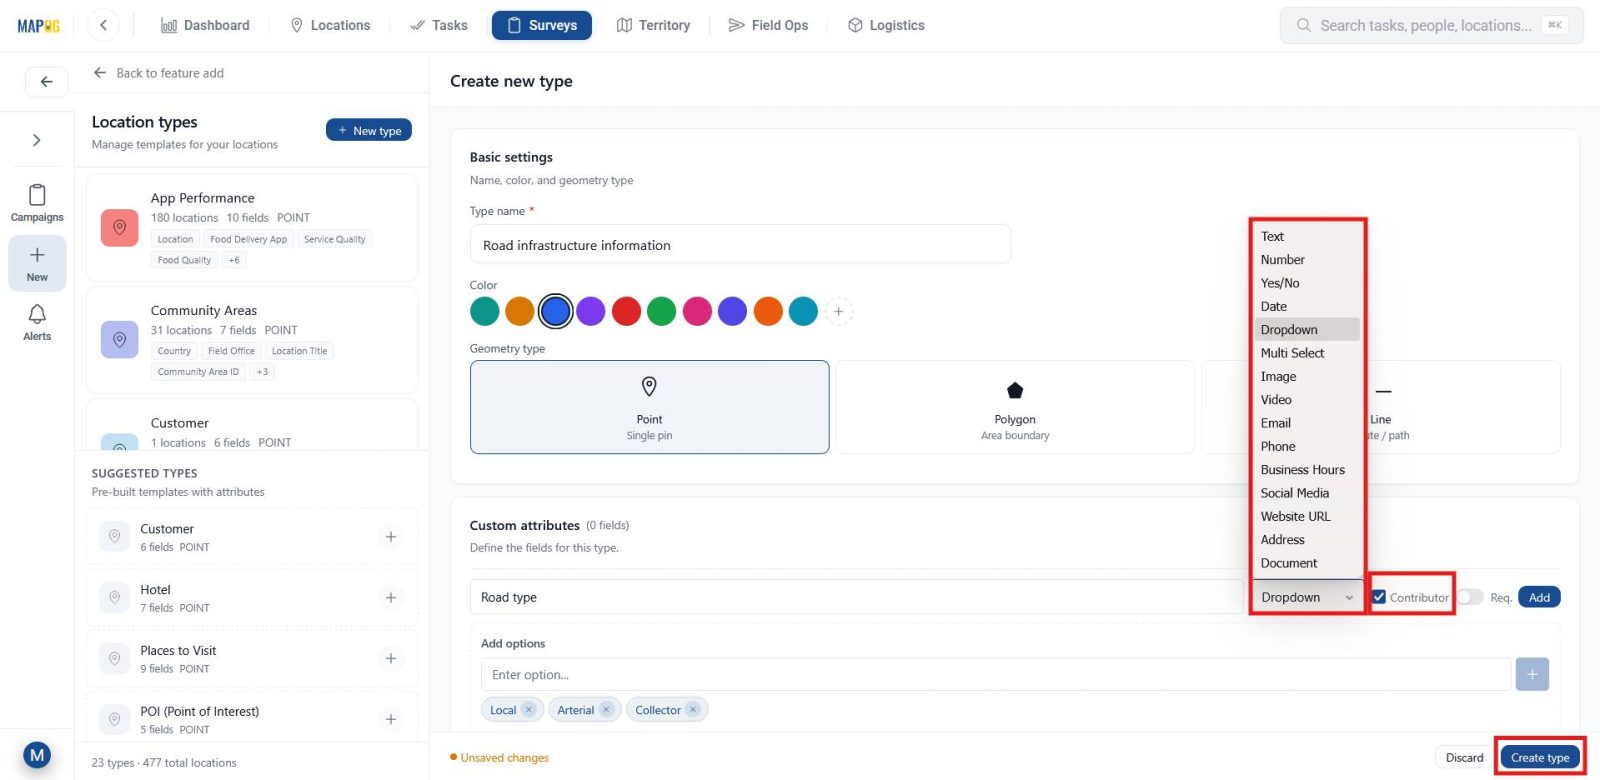
Next, from the location type dropdown, click create new, and then click new type.
Provide a name, assign a color, and set geometry to Point for precise mapping. Next, add attribute fields such as road type (dropdown), road name (text), or amenities (multiselect). Enable contributor access so on‑site updates can be made, then click Create Type to save and reuse across projects.
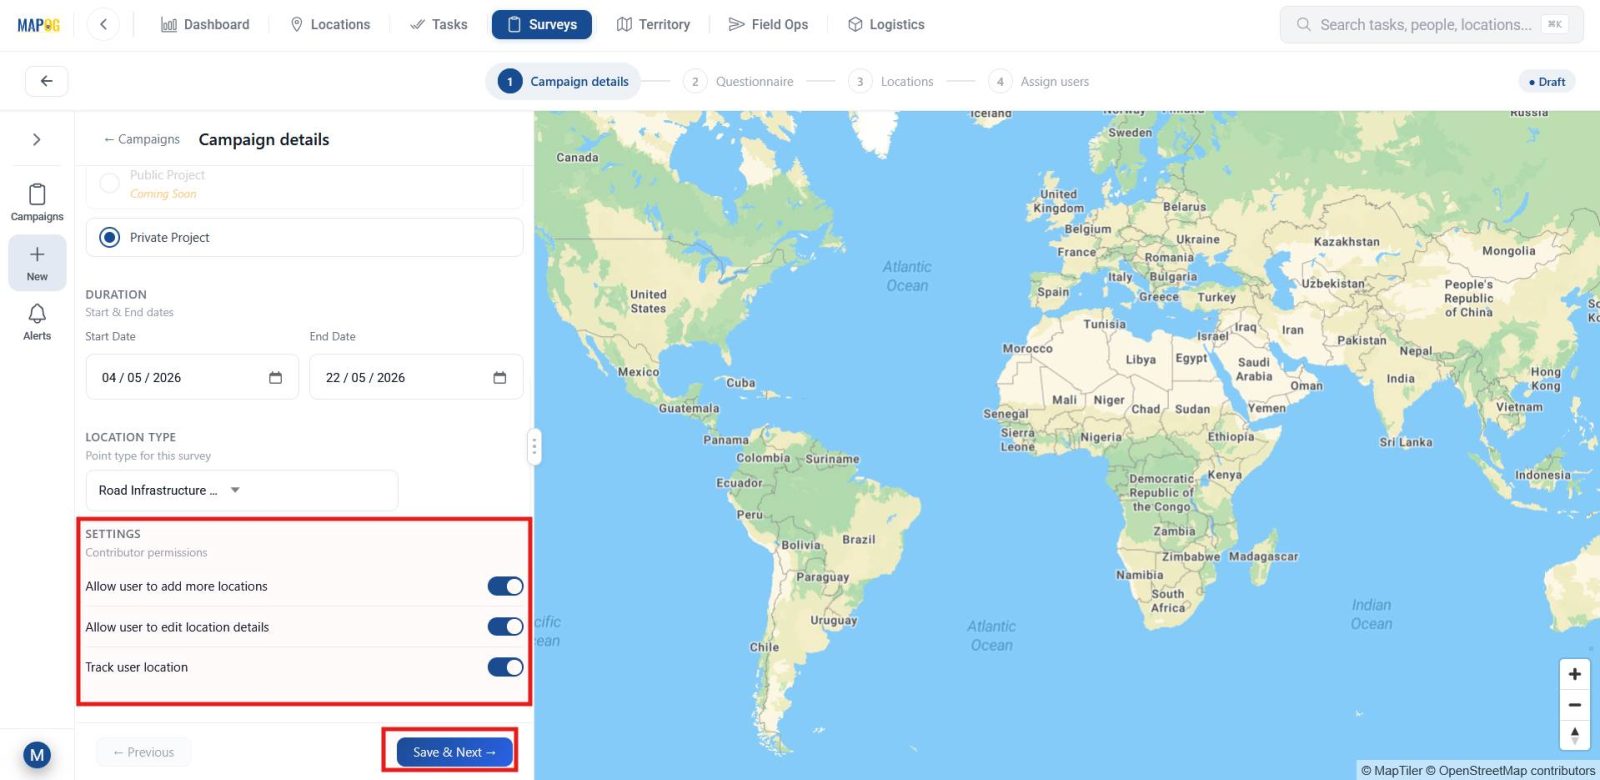
Next, select the recently created location type from the dropdown and then, enable contributor permissions so that changes can be done by the assignees on site if needed. Once the structure is set click save and next.
3. Add Survey Questions
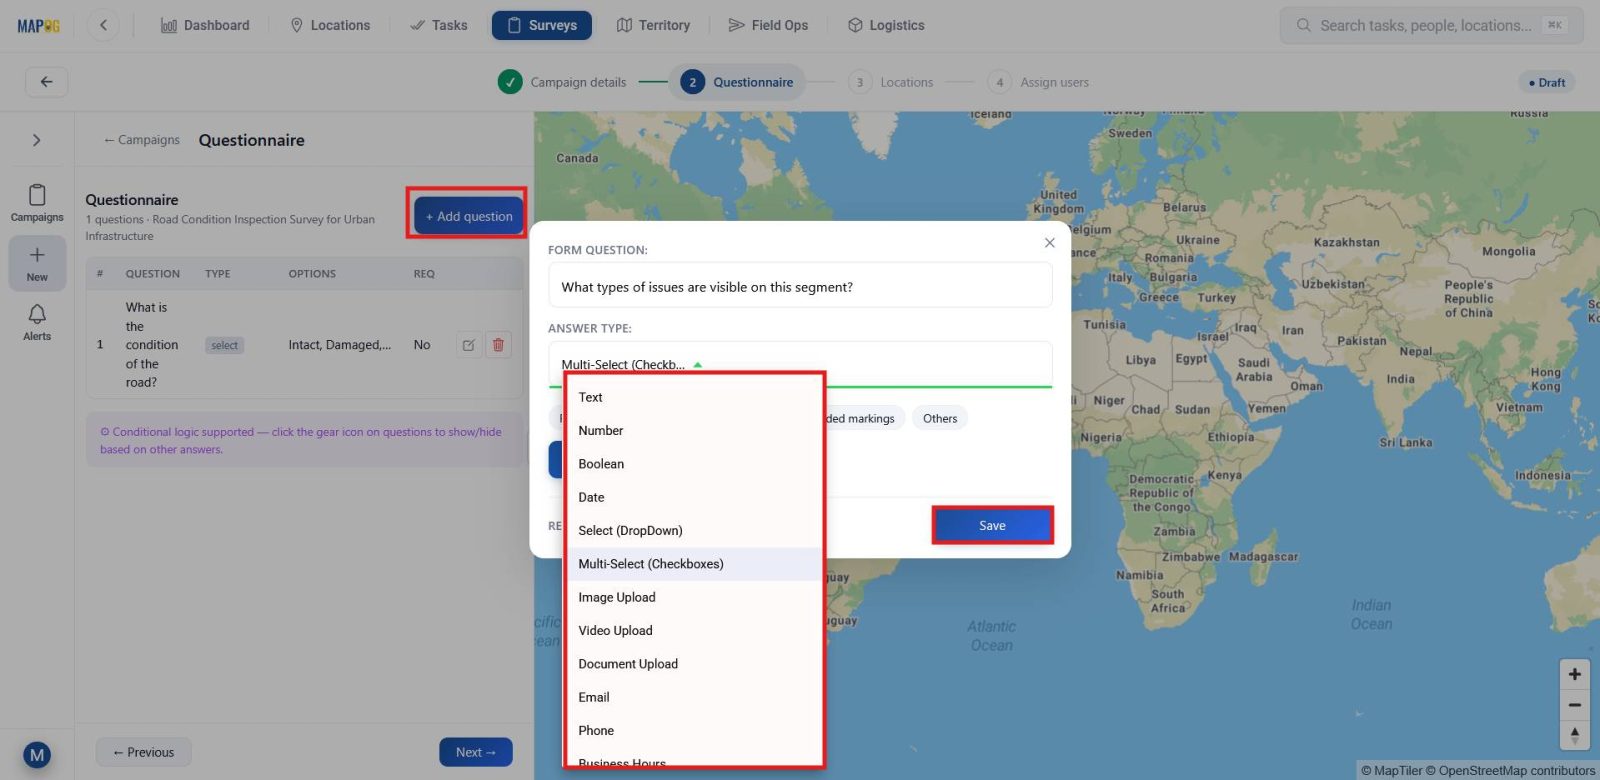
Now, click Add Question and build your survey. For example, enter a question like “What types of issues are visible on this segment?”, select the response type as multiselect, and add predefined options.
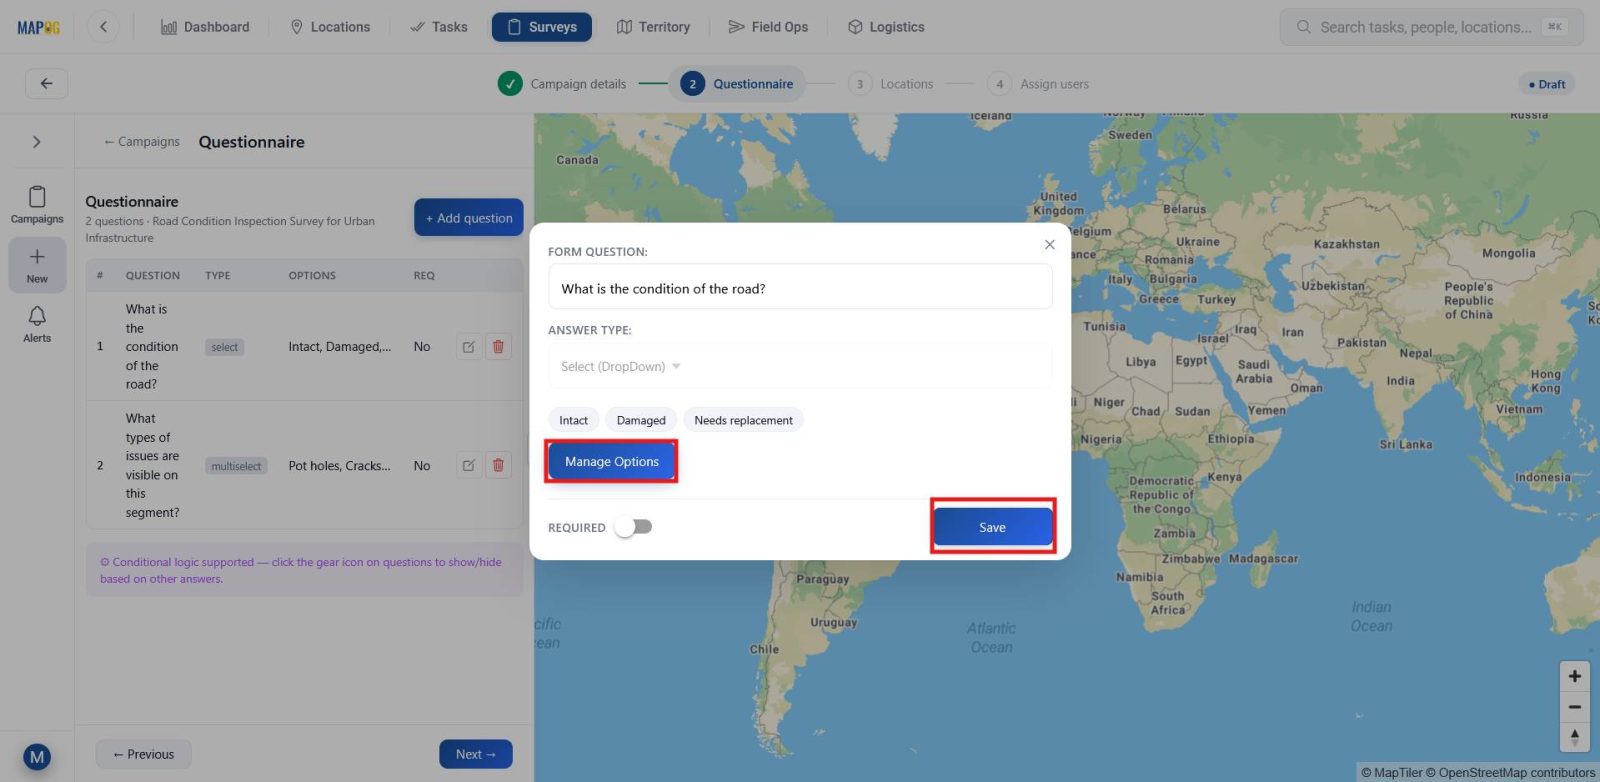
Moreover, adjust choices anytime through the manage options menu to keep data flexible yet structured.
4. Upload Location Data
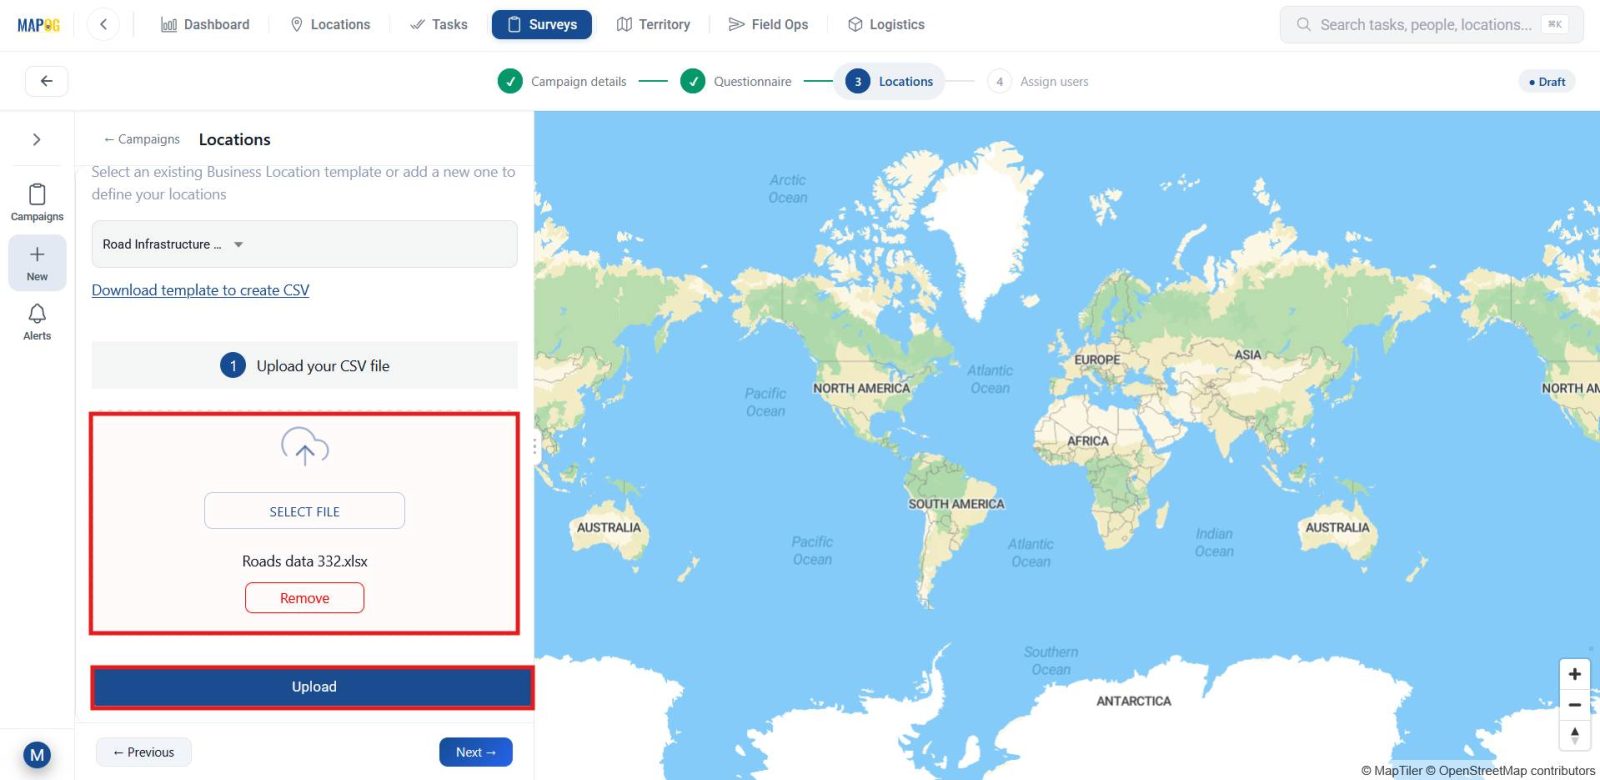
Following this, go to the locations section and choose upload CSV/ Excel option and browse and upload the file with site details.
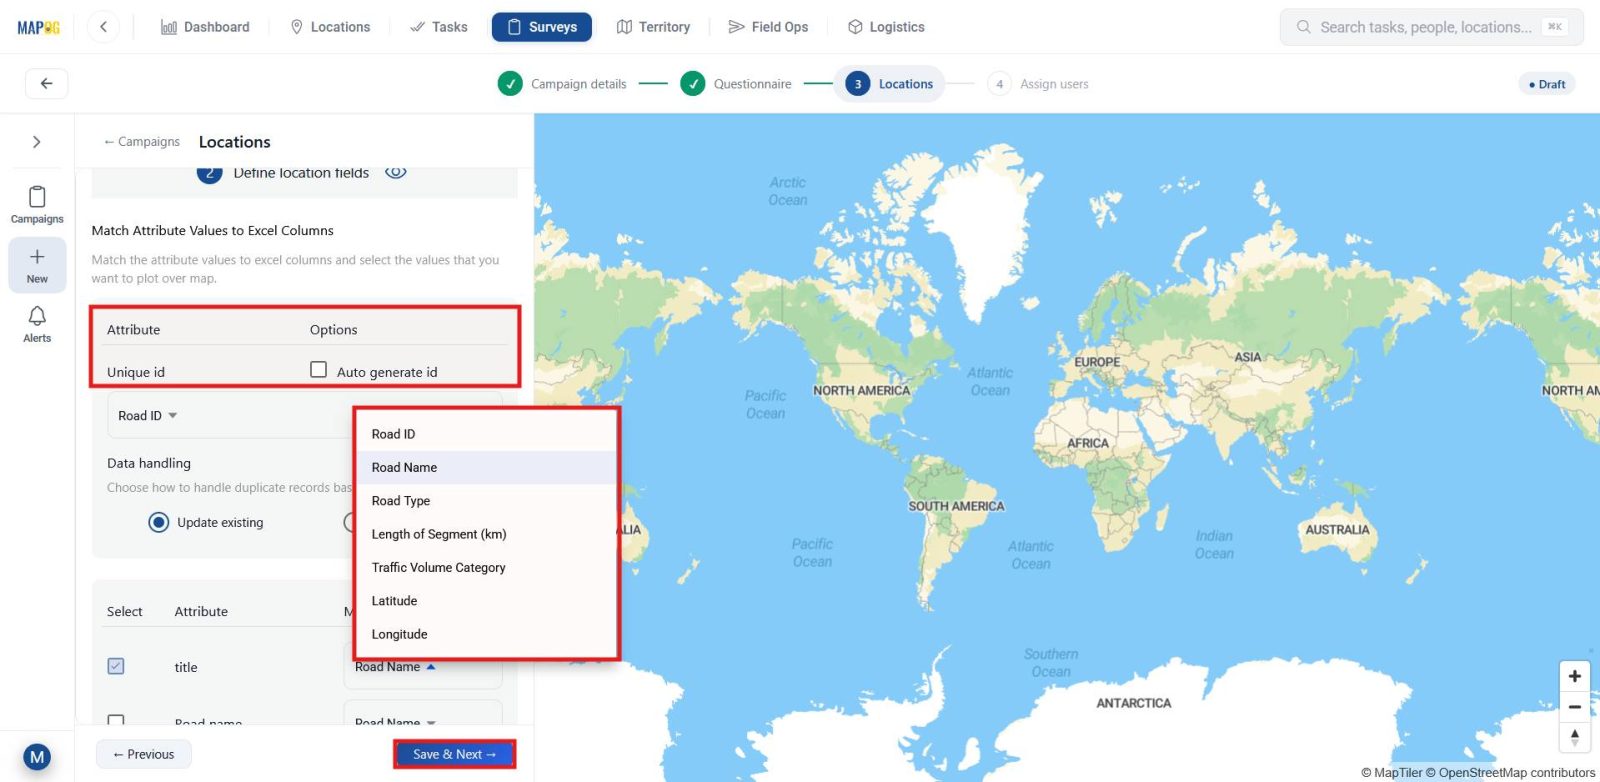
Then, choose unique ID if the attribute is there in the file, if not choose auto-generate ID. Next, match columns with attributes, place points using latitude/longitude or WKT, and submit so all locations appear on the map for coverage visualization.
5. Add Team Members
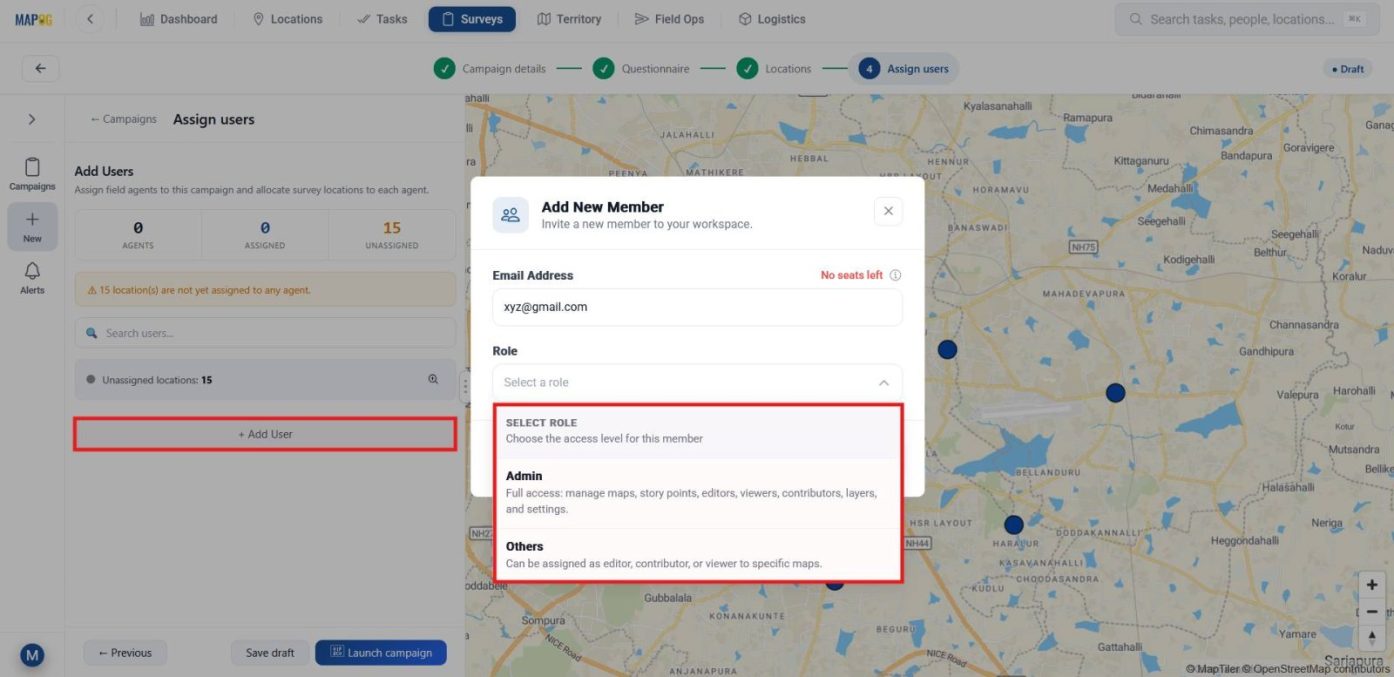
Afterward, invite members through add users and then add members by entering email IDs and assigning roles such as admin or others such as editor, contributor, or viewer and then send invite.
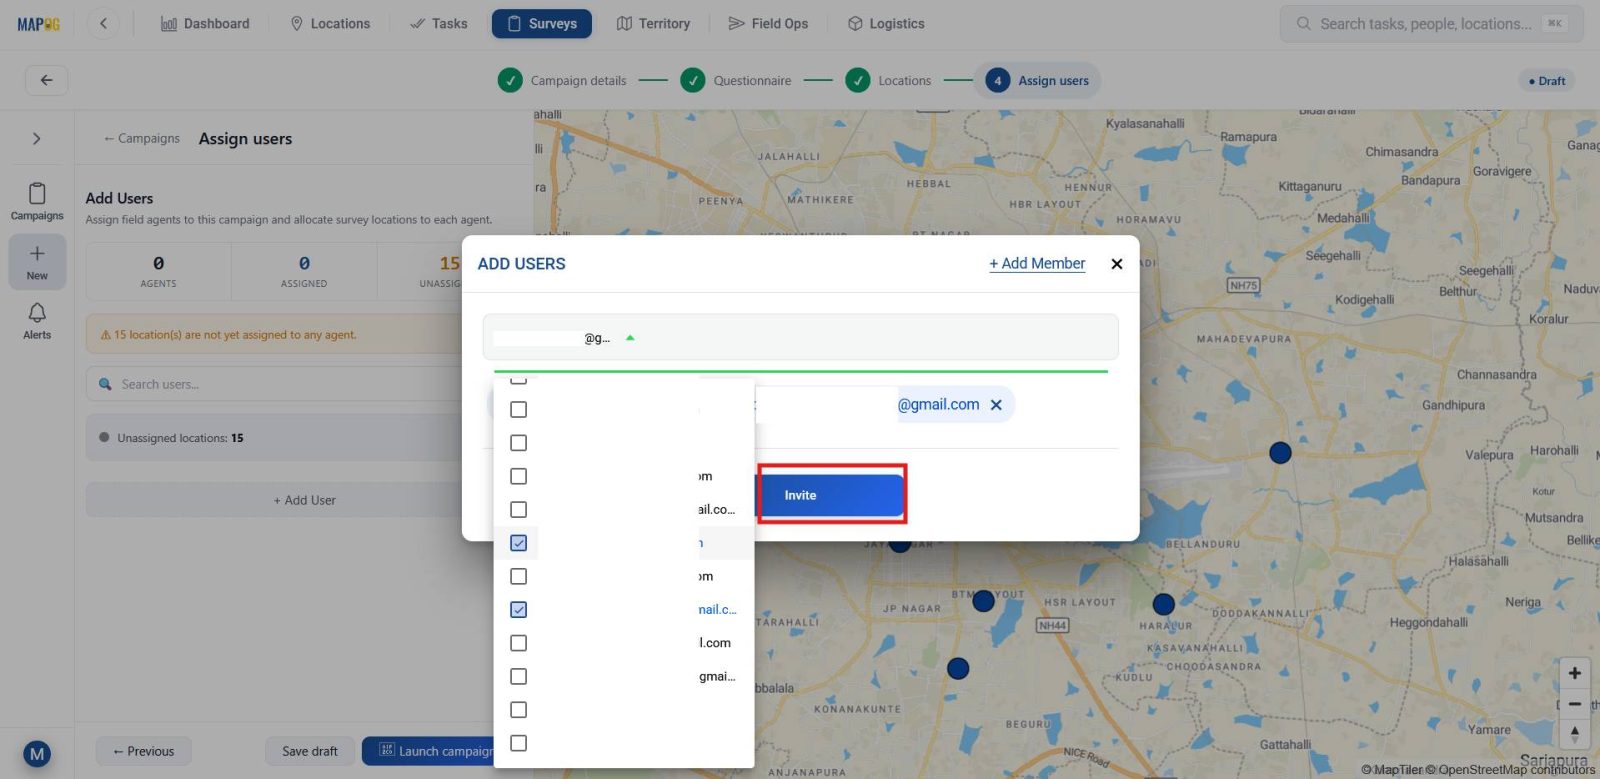
Then select members from the dropdown and invite. Consequently, responsibilities are clearly defined and access remains controlled.
6. Assign Locations via Map
Next, use the map option to draw polygons around points and assign them to team members. Customize colors for clarity and
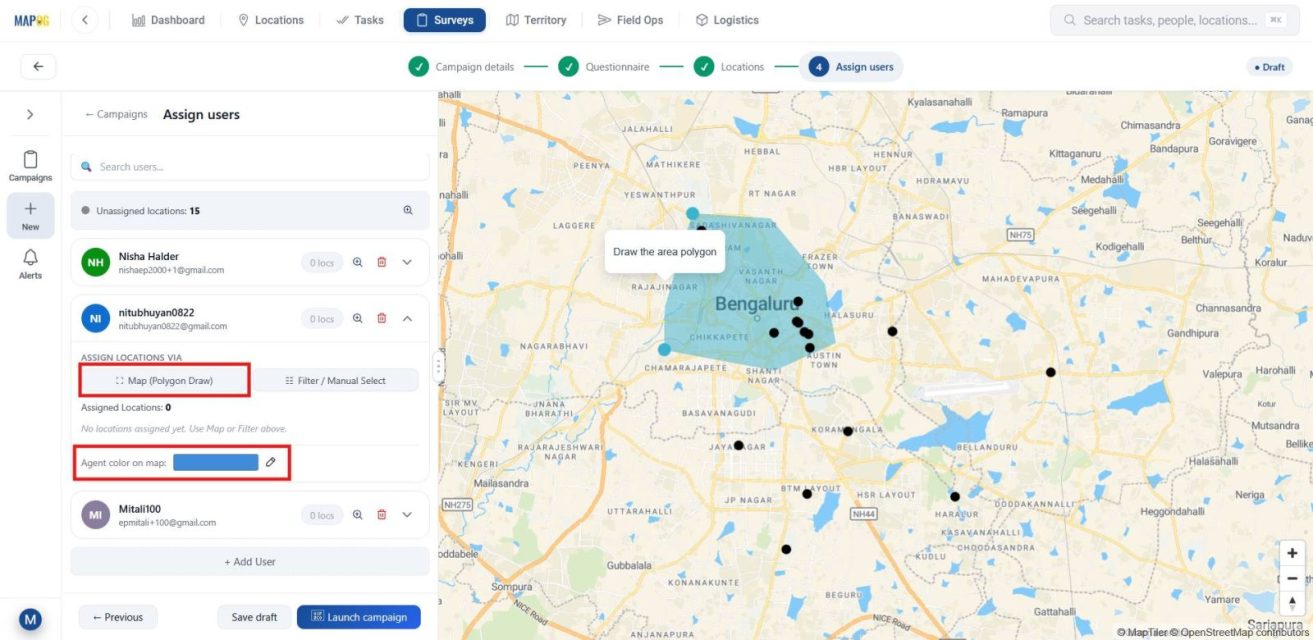
optionally, apply filters to distribute workload.
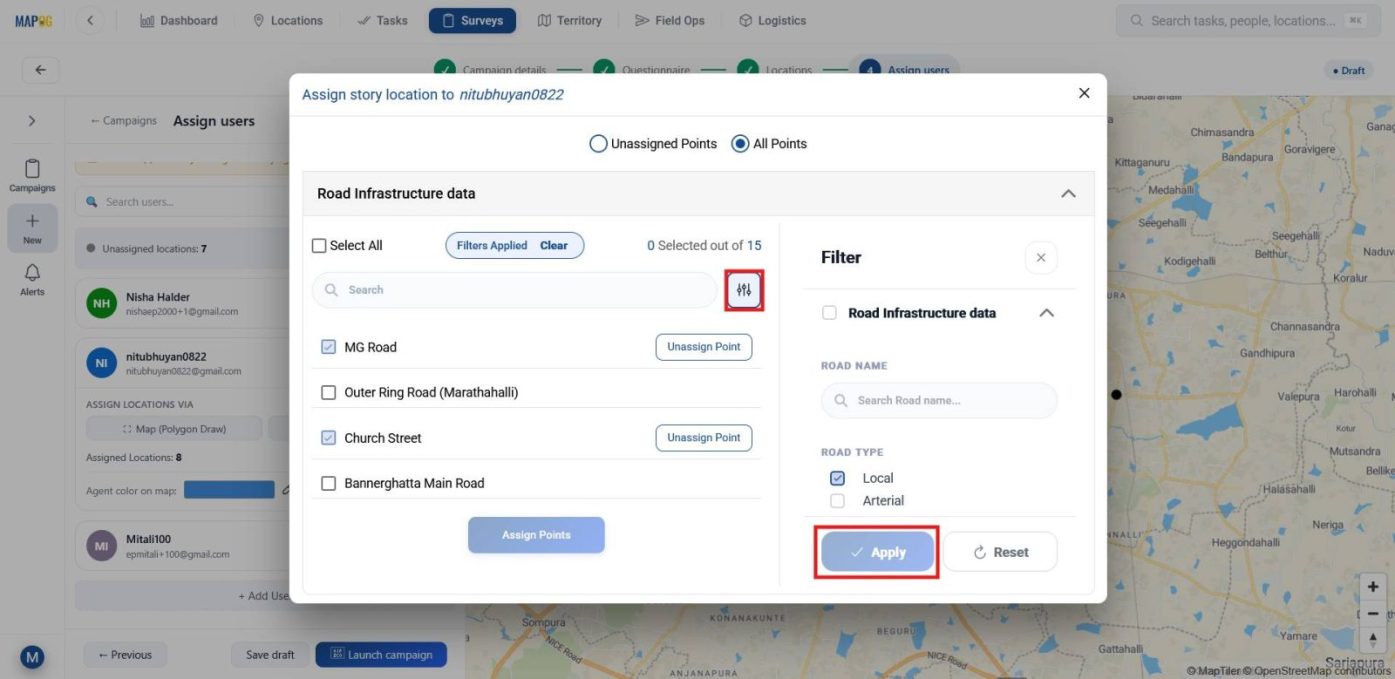
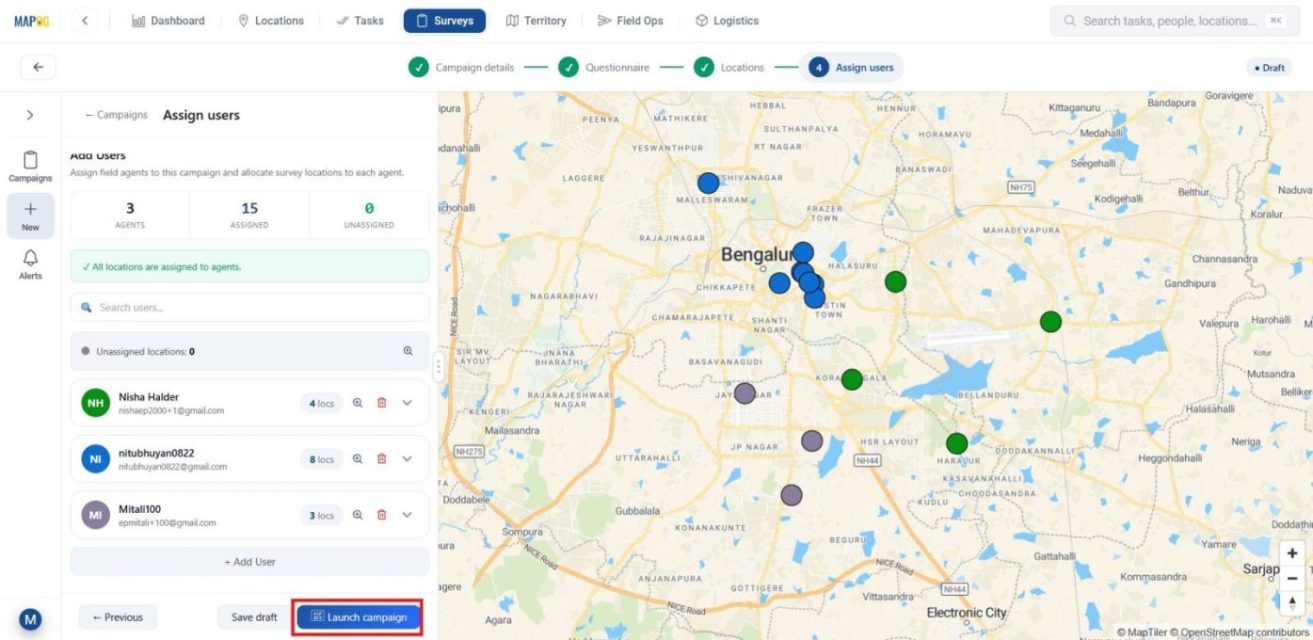
7. Launch the Survey
Once everything is configured, move to draft and then launch the survey to begin field operations smoothly.
8. Field Data Collection via Contributor App
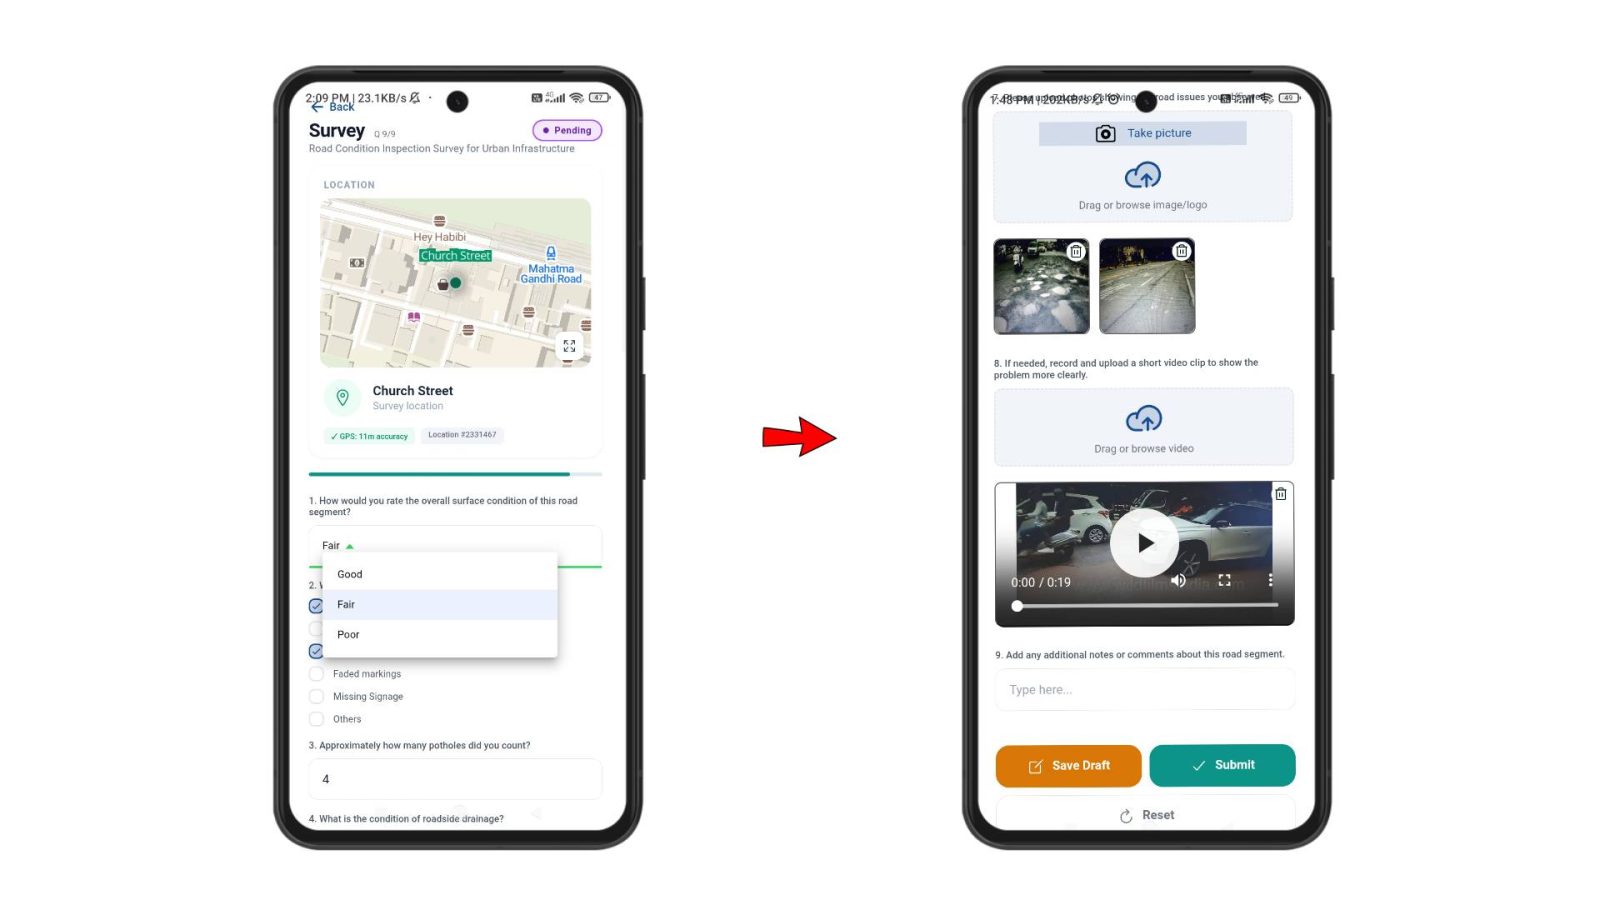
Meanwhile, contributors access their assigned sites directly through the app. If they discover a new location, they simply click + Find a New Location, place the point on the map, add required details, and save.
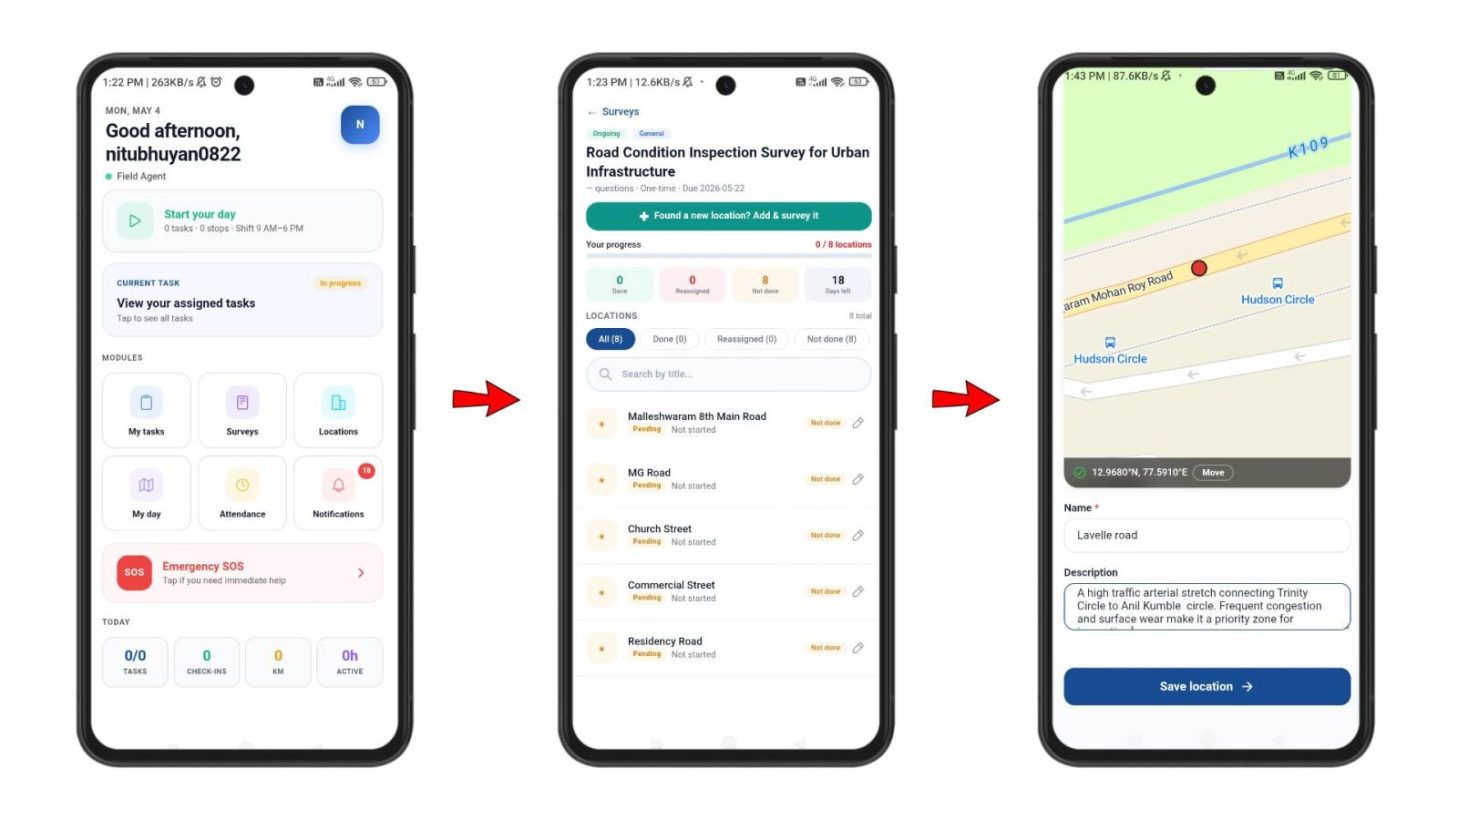
Within the survey section, they complete forms, upload photos or videos, and either submit or save drafts. As a result, inspections generate real‑time, verifiable records of field activity.
9. Monitor Responses in Dashboard
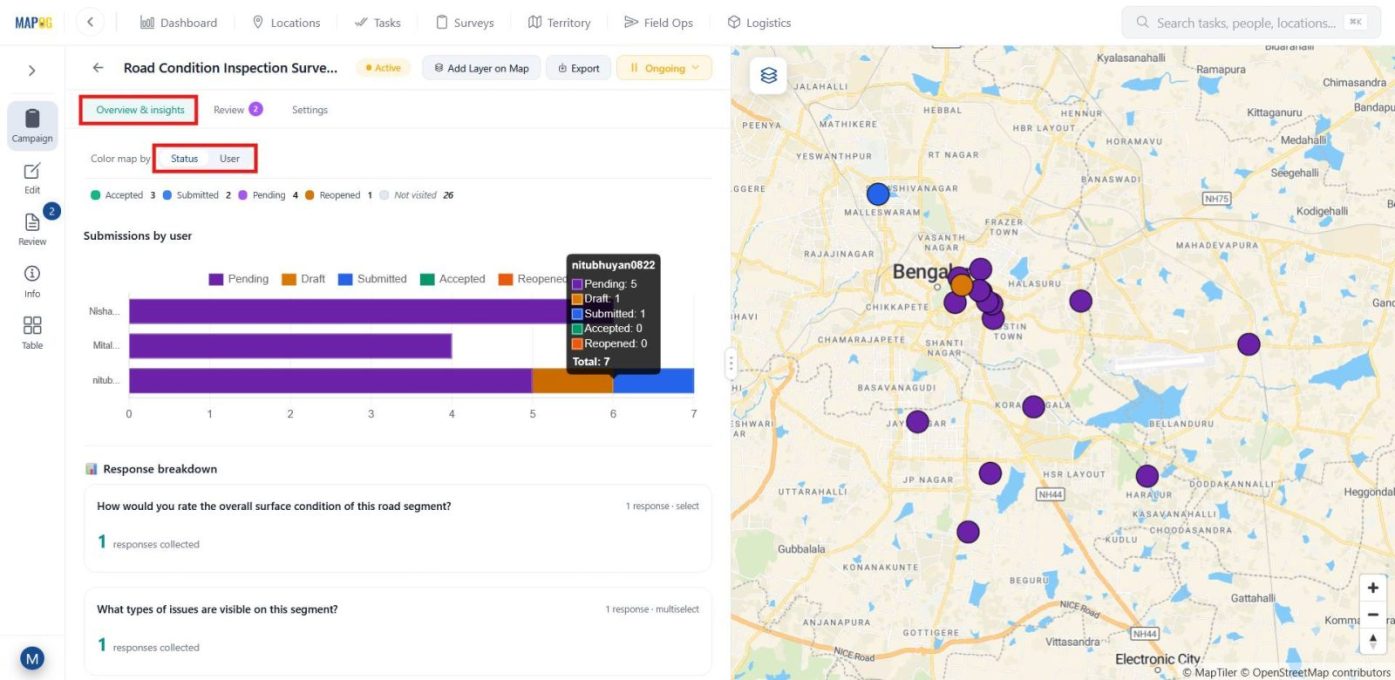
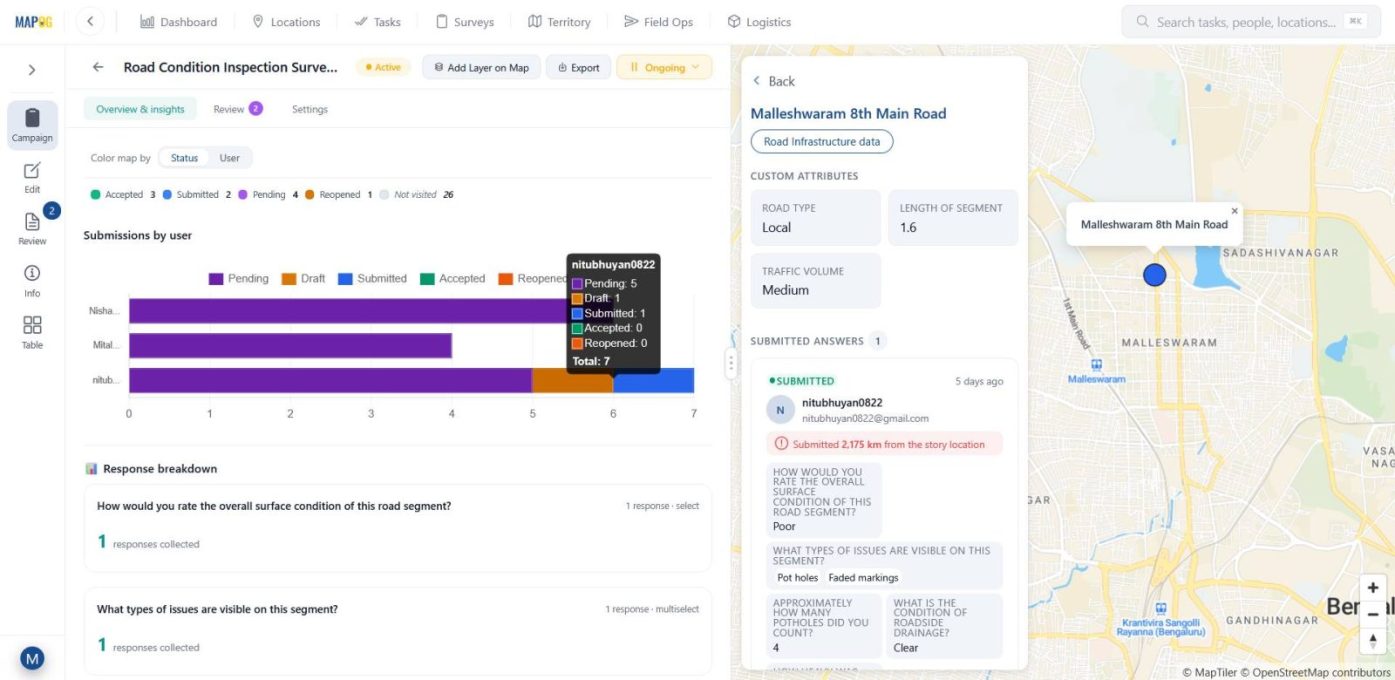
Finally, return to the dashboard, where the Overview and Insight section displays all campaign entries, allowing users to view data by user and submission status.
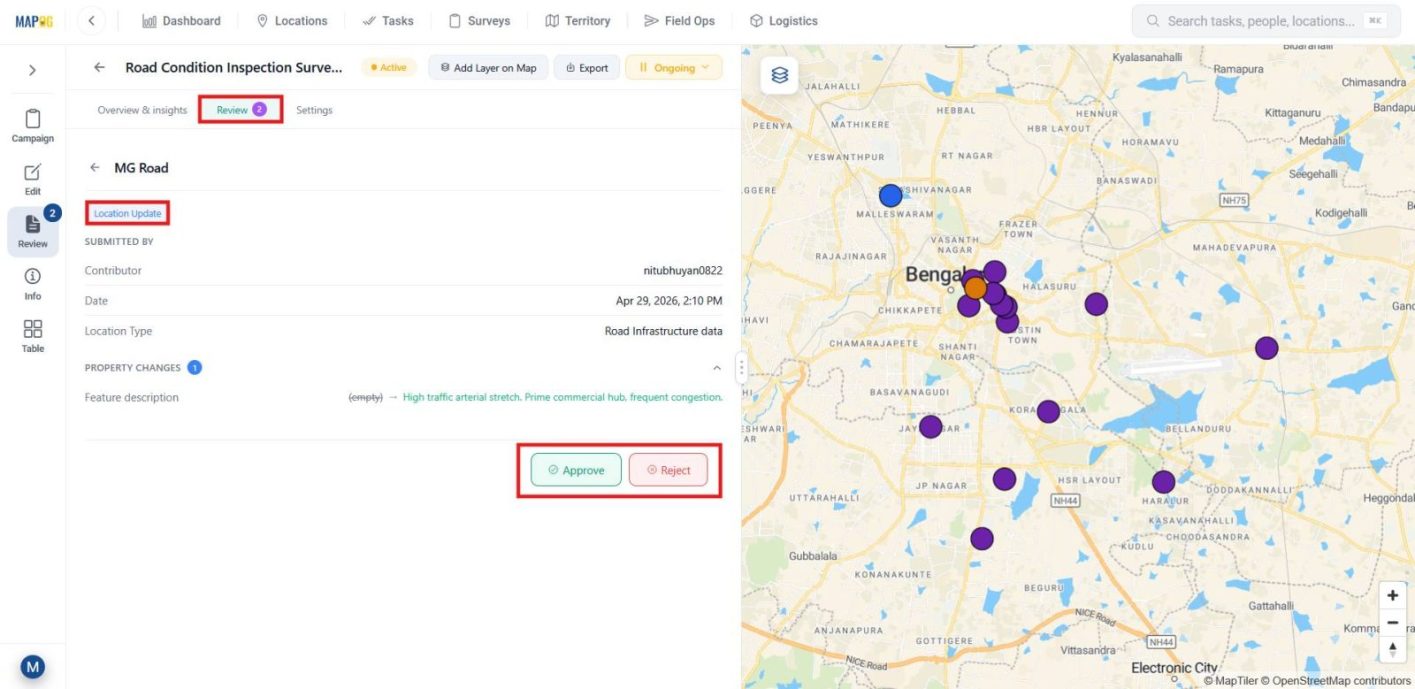
In the Review section, reviewers approve or reject location updates.
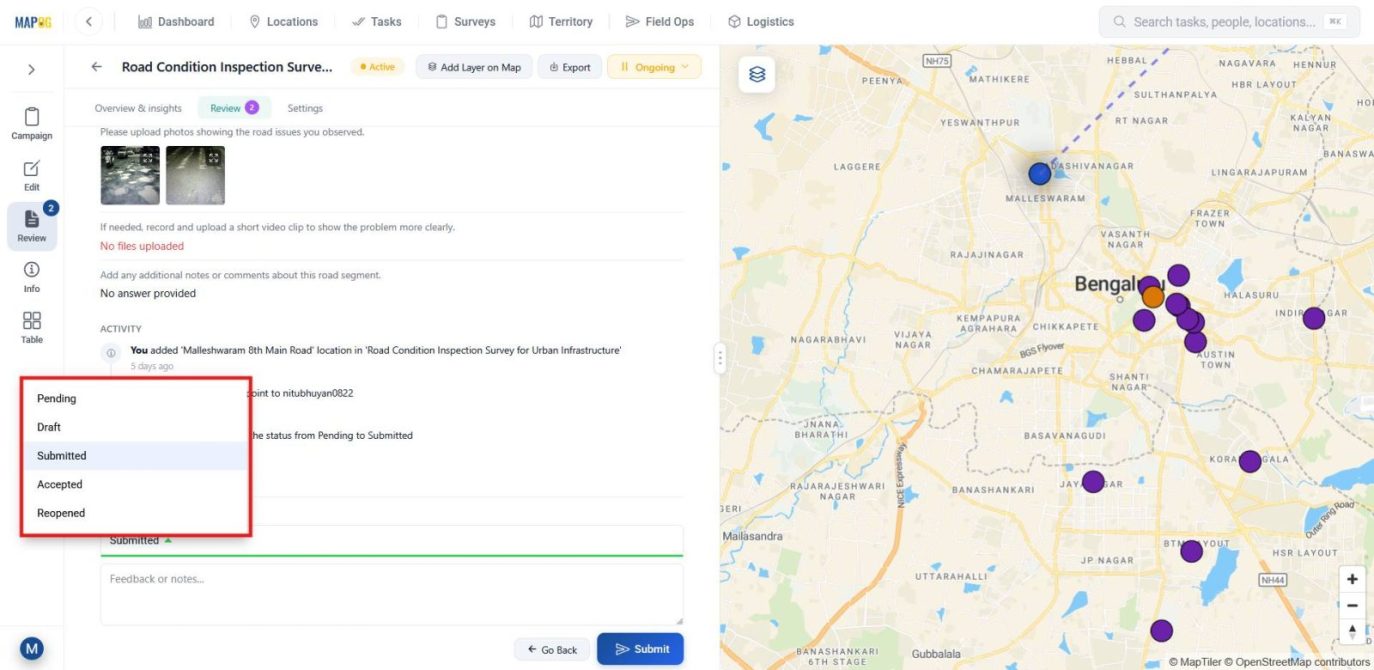
while reviewers view survey forms and mark them as accepted or reopen them.
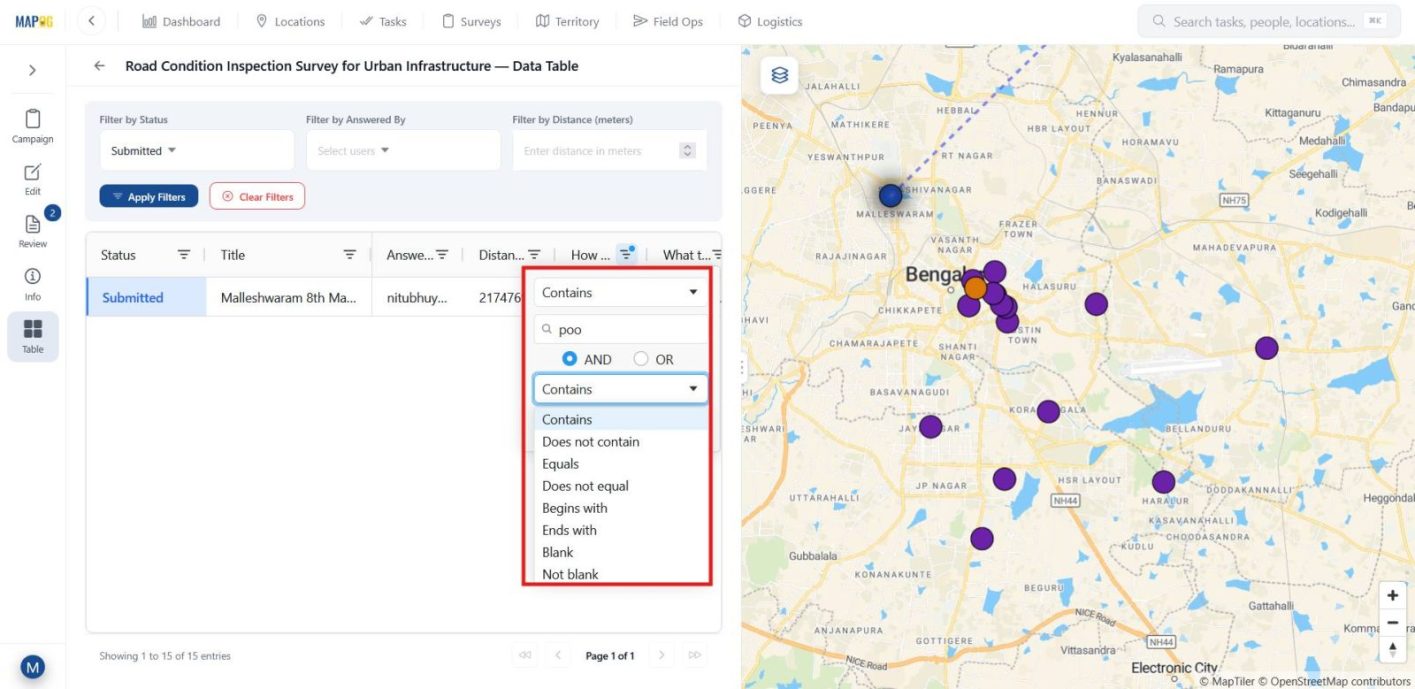
Meanwhile, the Table section enables filtering by status, user, or keywords, with advanced searches supported through AND/OR logic.
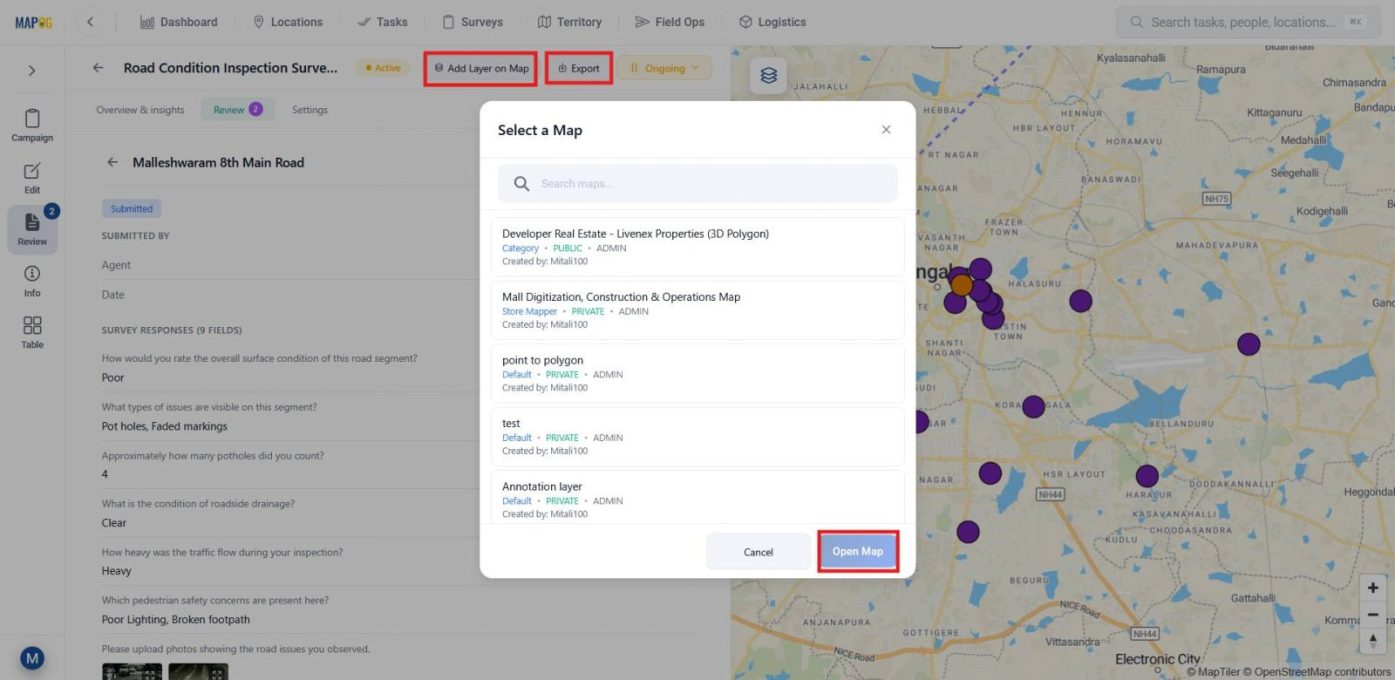
Users can download data as CSV from the Export option and use the Add Layer on Map feature to integrate survey results into new or existing maps, enabling broader insights and more informed decision-making.
Industrial use and benefits
GPS‑based inspections transform industries by streamlining construction safety, documenting real estate conditions, maintaining infrastructure, and monitoring energy assets. Consequently, organizations achieve faster reporting, fewer errors, stronger collaboration, and reliable accountability through accurate, location‑based evidence that strengthens decision‑making.
Conclusion
In summary, conducting site inspections using GPS and map‑based mobile data collection with MAPOG transforms inspections from scattered, manual tasks into streamlined, location‑driven workflows. Teams capture every detail, track every issue, and prepare every report for action, creating a reliable, efficient, and transparent inspection process across industries.
Download the contributor app from here:
App Store (iOS) | Play Store (Android)