In the competitive real estate market, site planning has become increasingly complex, often leading to project delays and increased costs due to challenges in evaluating land suitability and environmental constraints.
However, GIS-based workflows, such as those provided by MAPOG, simplify these challenges by allowing planners to visualize and analyze site feasibility effectively, resulting in more accurate and data-driven planning processes.
Key Concept of Real Estate Site Planning with GIS
Real Estate Site Planning entails analyzing various layers, including roads, pipelines, powerlines, and drainage systems, to determine optimal land parcels for development. For instance, when planning a residential township, planners can overlay road networks with utility infrastructure to prioritize areas based on accessibility and services. GIS tools such as Advance Filter, Merge Polygon, and Nearby Neighbor in MAPOG facilitate this process.
Step-by-Step Real Estate Site Planning Process
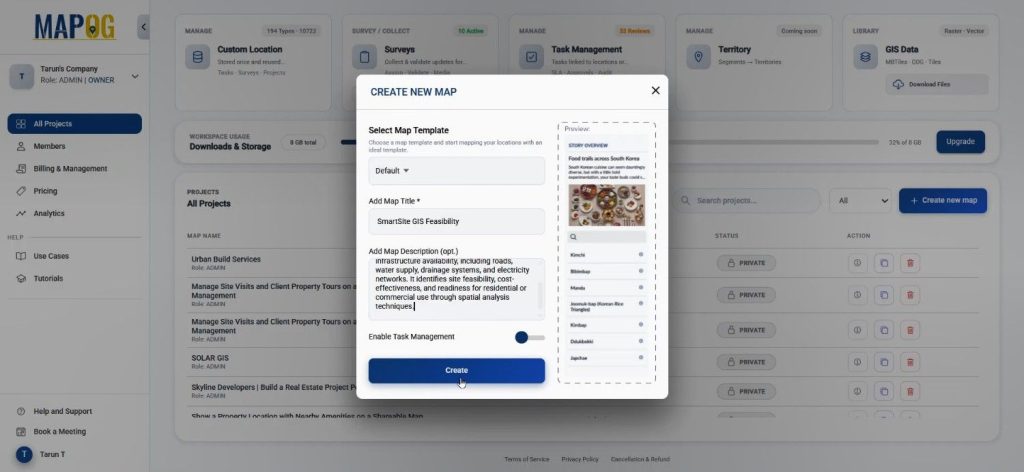
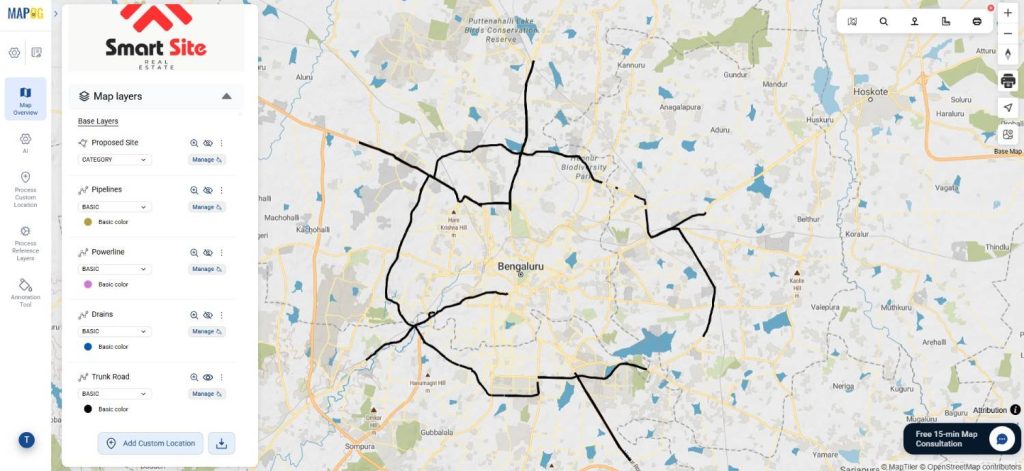
Step 1: Creating the Base Map for Real Estate Site Planning
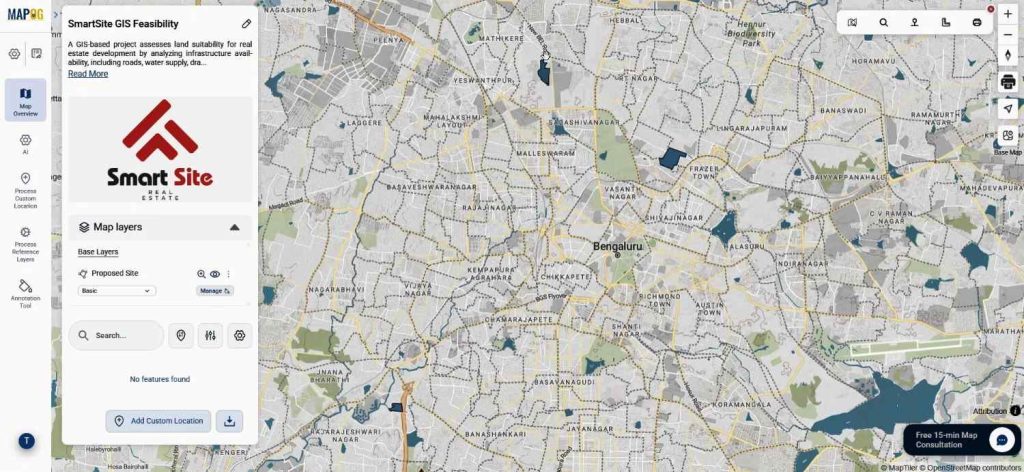
First, click on create new map & set map template as default. After adding a title and description, click create.
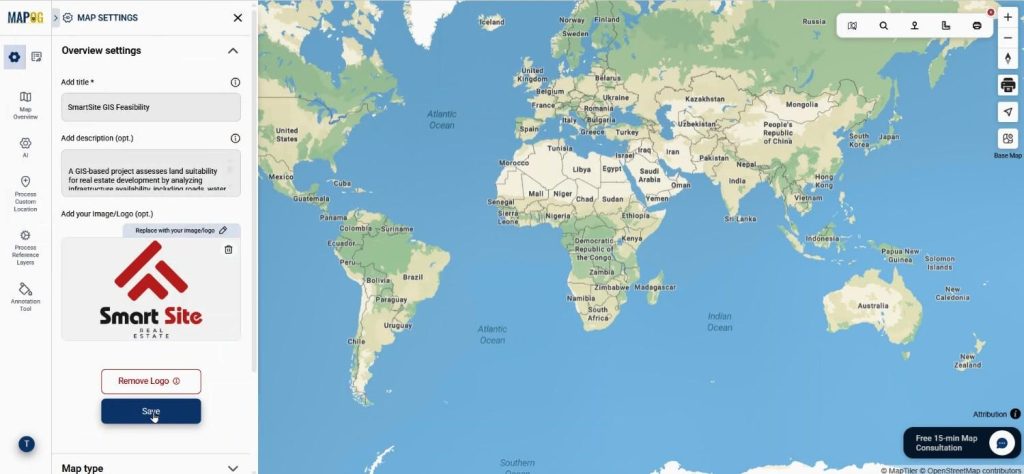
Come to the map interface, click on replace to change the logo, it helps with branding.
Then, to upload proposed site planning polygon layer use “Upload Vector File” option.
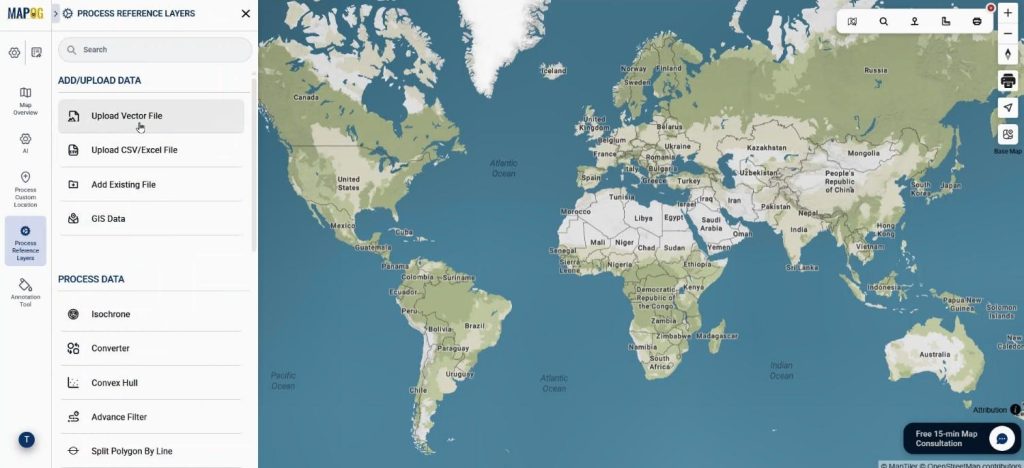
Browse the file & upload it.
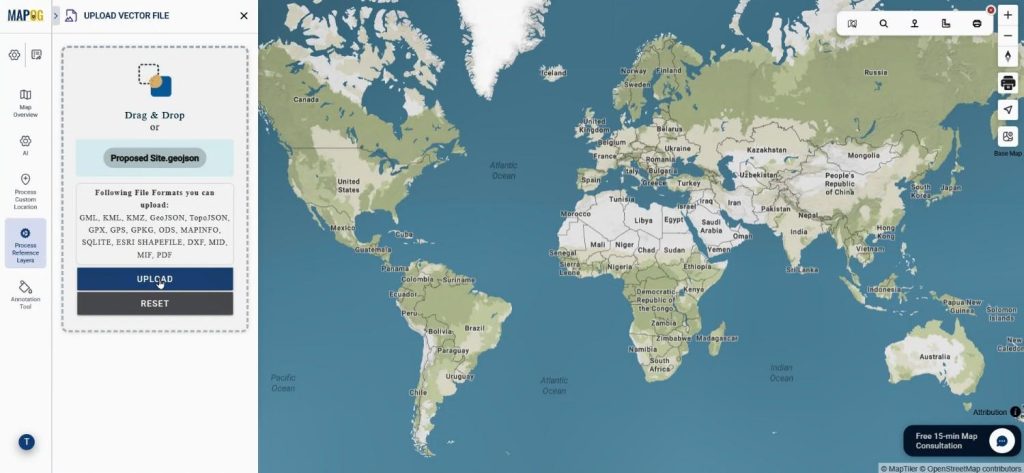
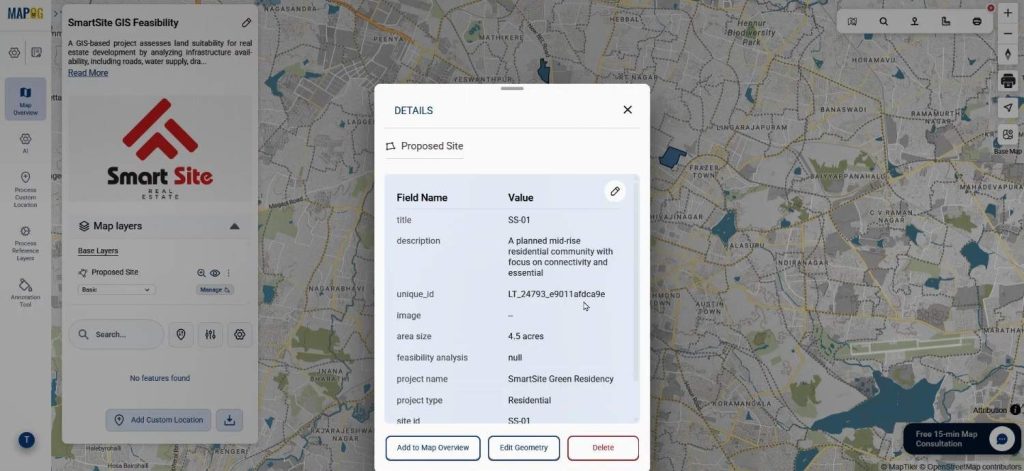
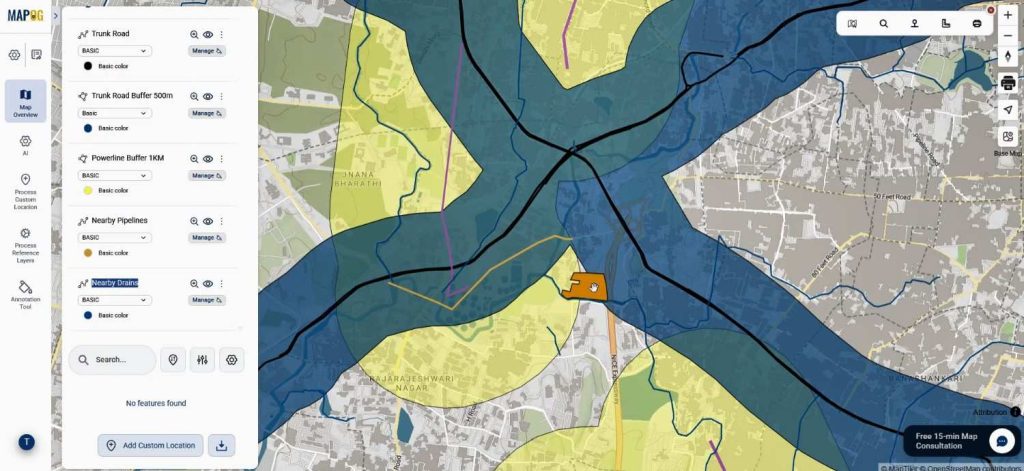
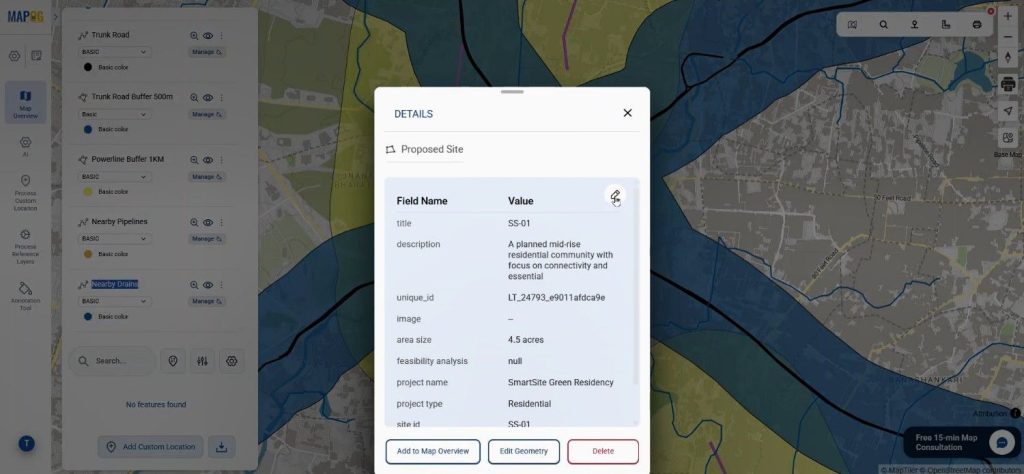
Once uploaded, each polygon represents a potential site.
Users can click these to view attributes, making initial feasibility insights easily accessible.
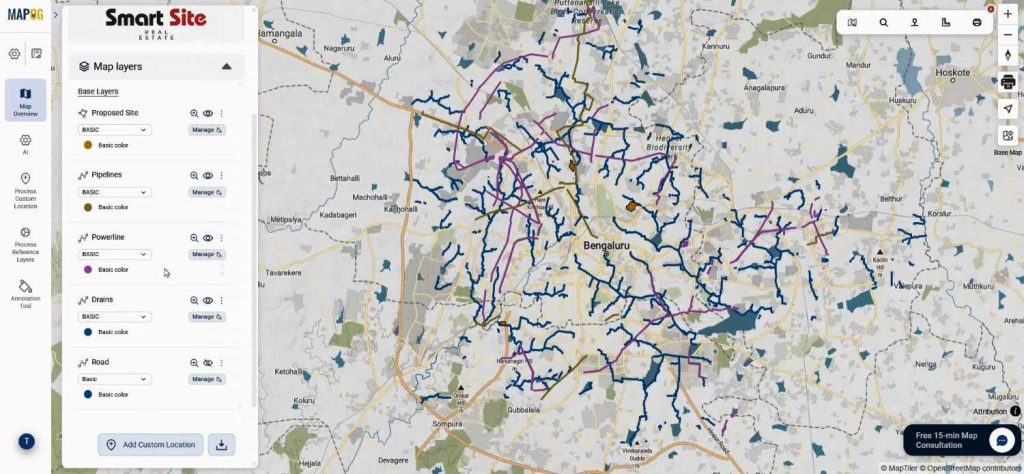
Step 2: Adding Infrastructure Layers
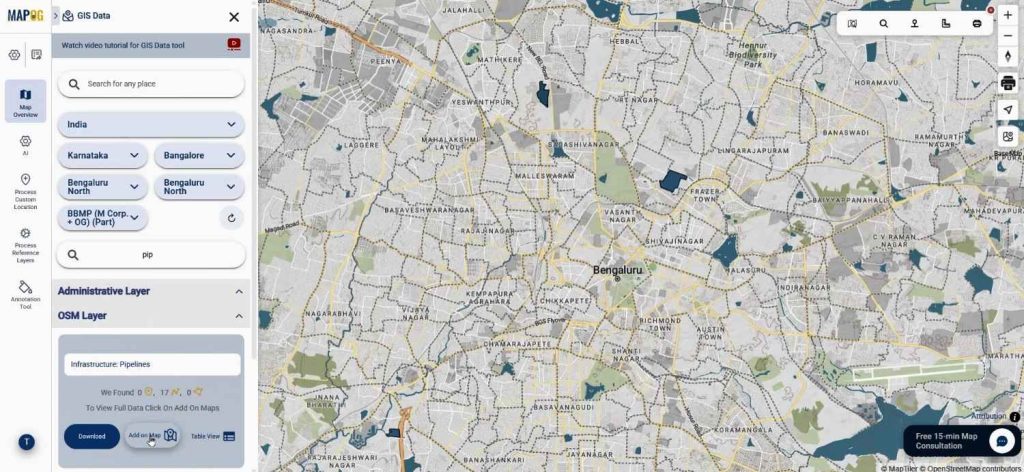
Next, users can add infrastructure layers through GIS data from process reference layers.
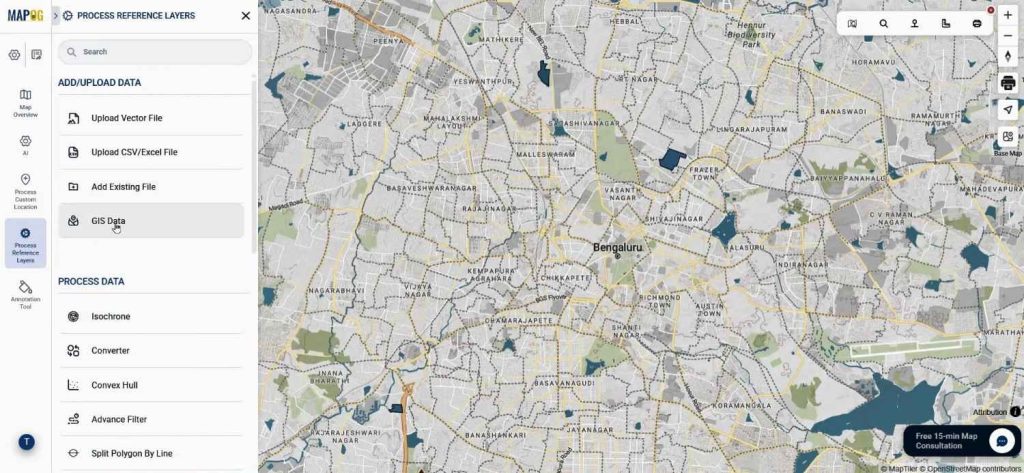
select country, state by this go to your exact location & search for pipeline data & add it on map.
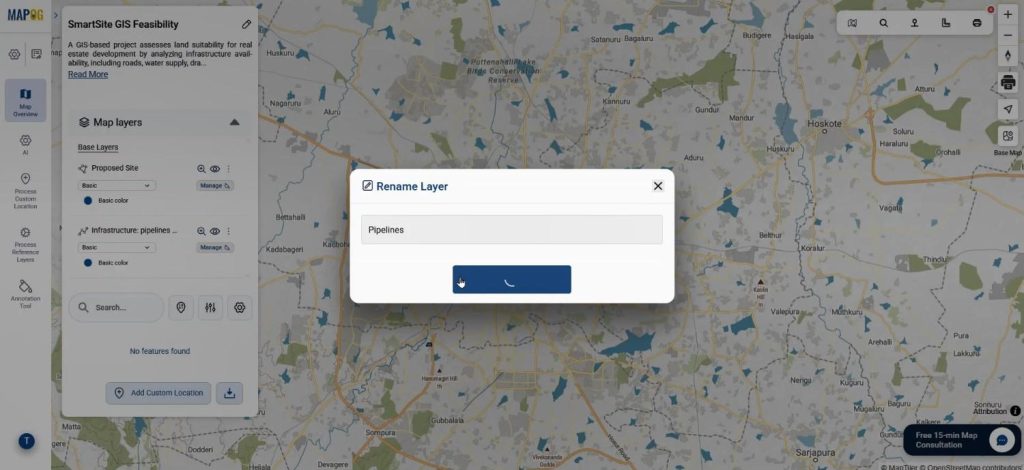
You can rename the layer.
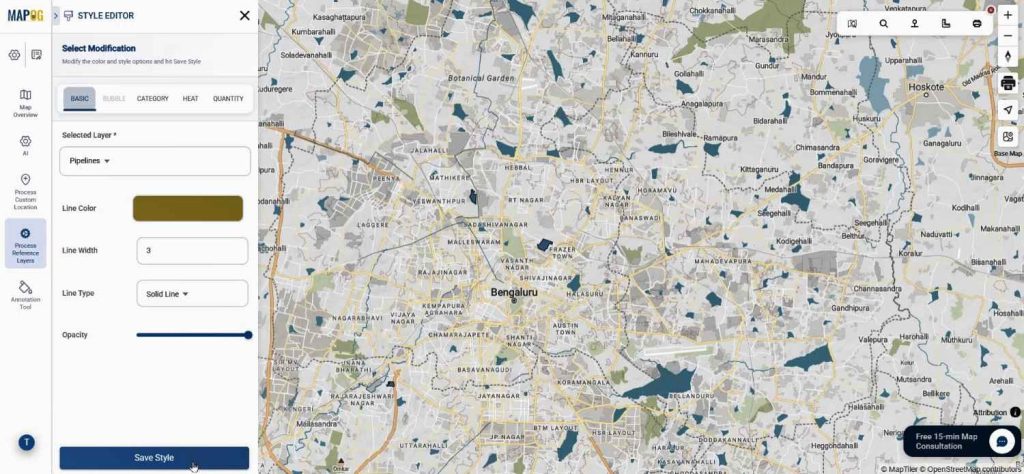
Using Add layer style change its color, size. Adjusting colors improves clarity.
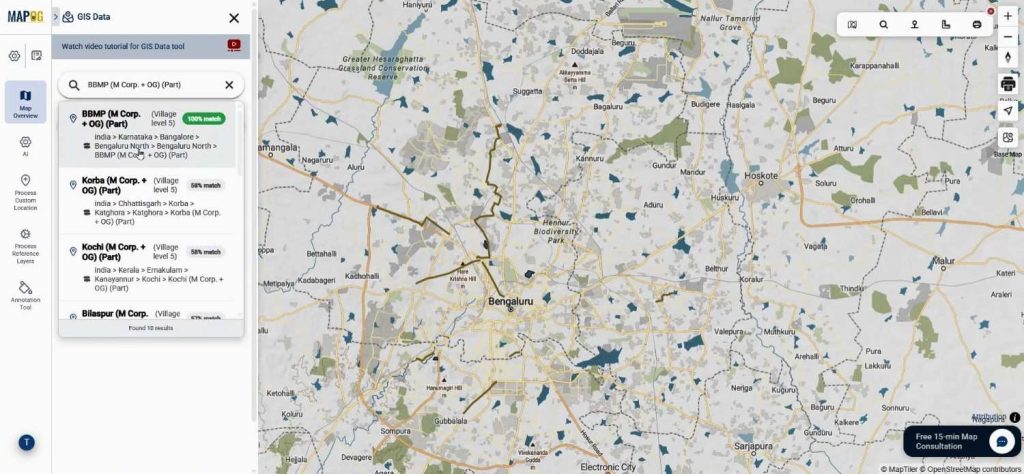
Instead of manually locating areas, users can search the exact place name in GIS data, and the system displays relevant data instantly.
Additionally, users add, rename, and style layers like powerlines, drains, and roads for better visualization. As a result, planners can quickly understand spatial relationships.
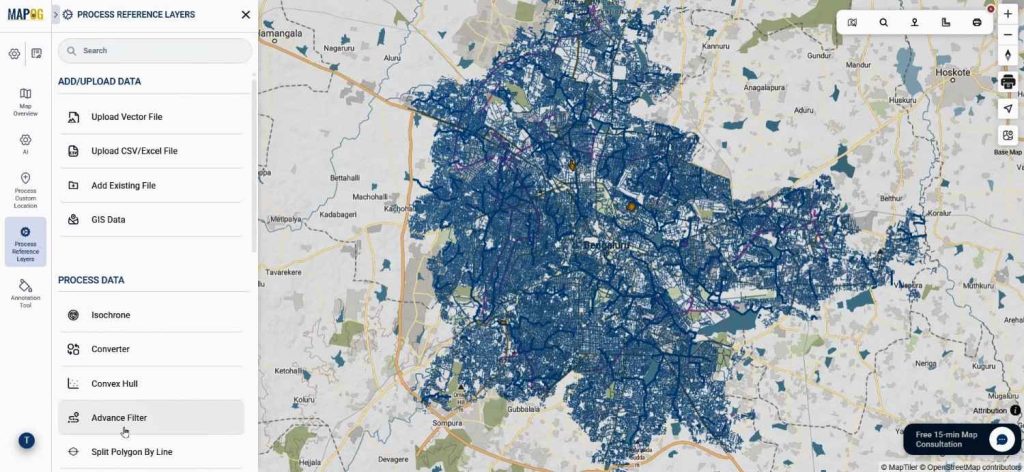
Step 3: Filtering Data Using Advance Filter
To refine trunk road analysis, users utilize the Advance Filter tool from the process reference layer, ensuring they include only relevant data.
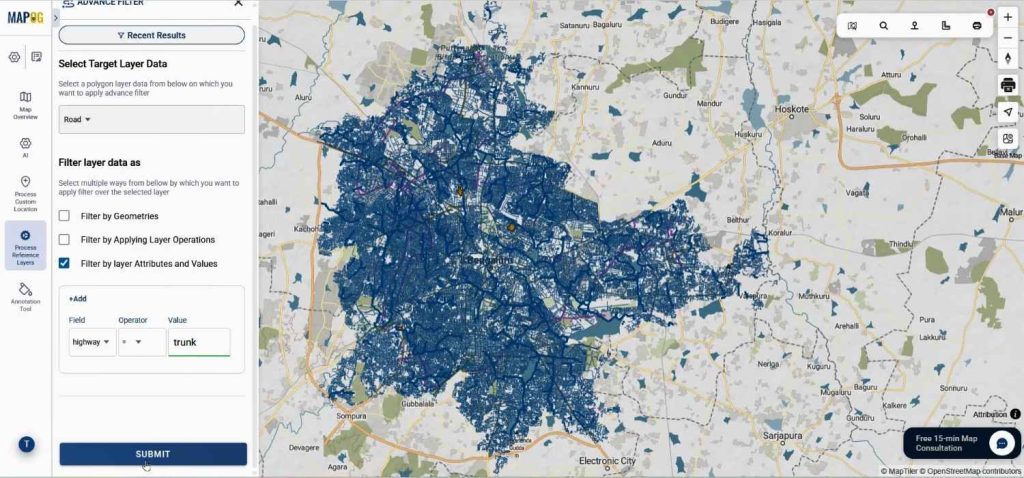
For instance, select road as target layer & enable the filter by layer attributes & values. Now set the field as highway, select the operation as “=” & set the value as trunk as we need to extract trunk road from the road layer & click on submit.
Now the result will come, we can download it or publish it directly on map to work on it.
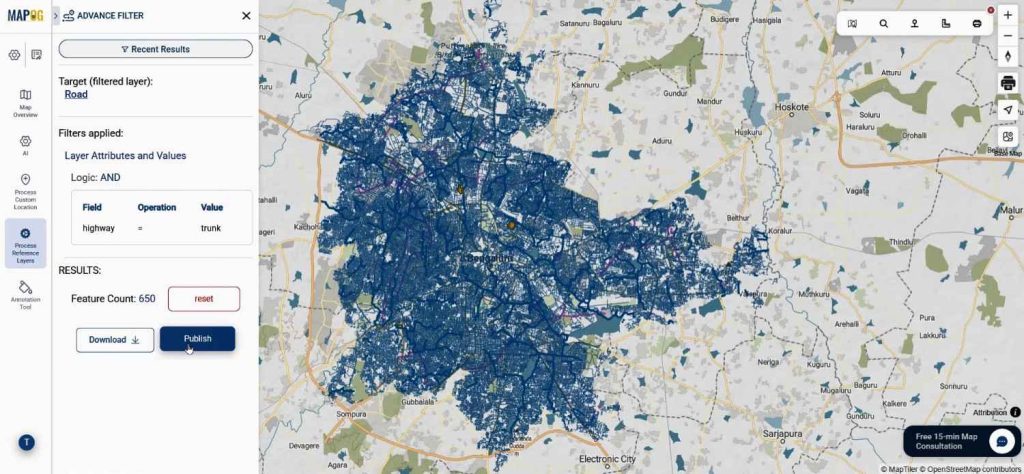
This allows planners to concentrate on high-accessibility routes, crucial for Real Estate Site Planning.
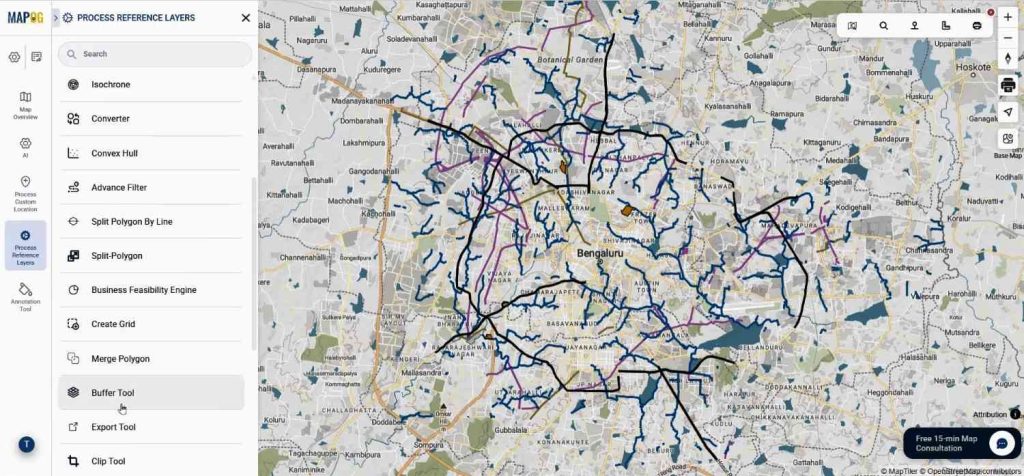
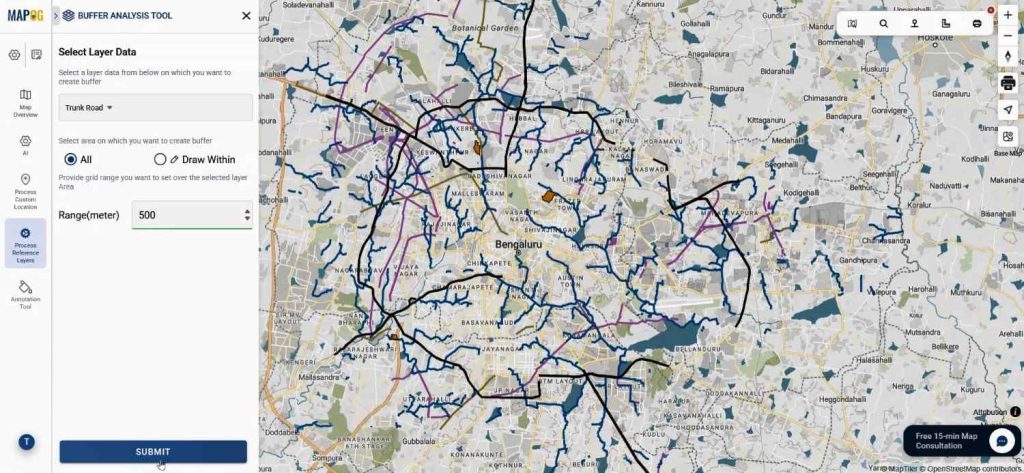
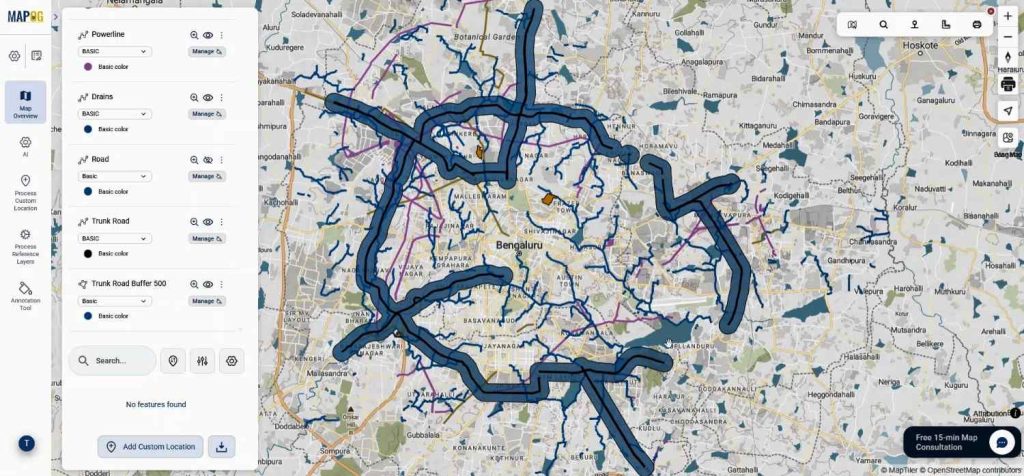
Step 4: Buffer Analysis for Accessibility
After filtering, come to process reference layers & click on buffer tool.
Select trunk road as main layer & range as 500 meters, then submit. A 500-meter buffer around trunk roads highlights most accessible areas.
Users then combine these buffers using the Merge Polygon tool.
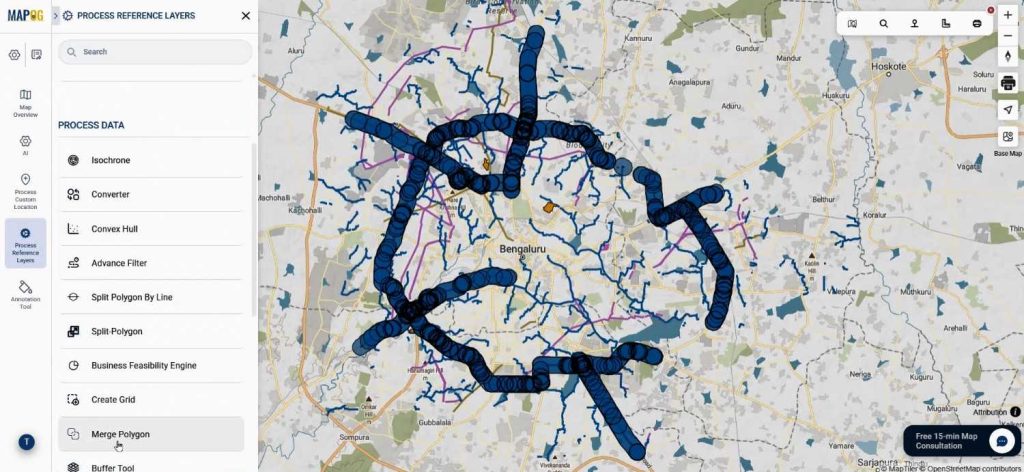
Here select the layer data as trunk road buffer & operation by attribute, now select proper attribute & value, save it in a new layer & submit.
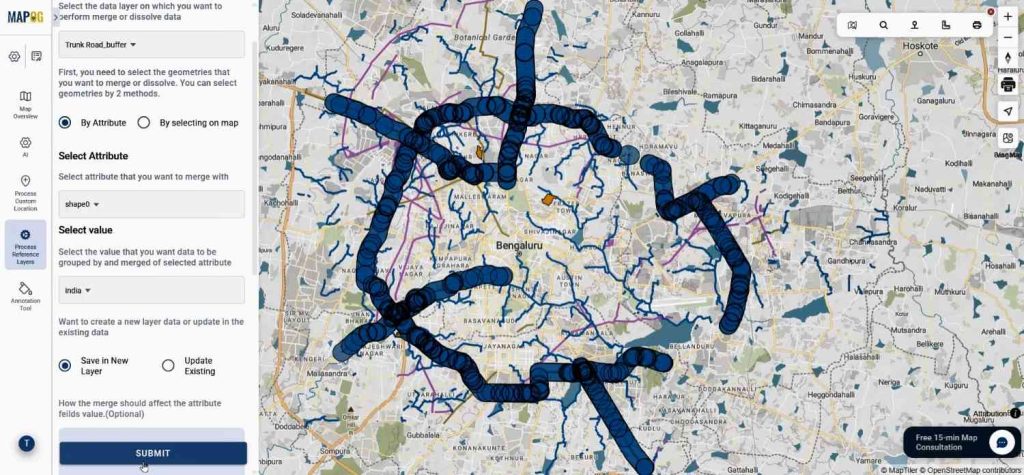
As a result, overlapping zones are unified, creating a smoother and more interpretable layer for Real Estate Site Planning.
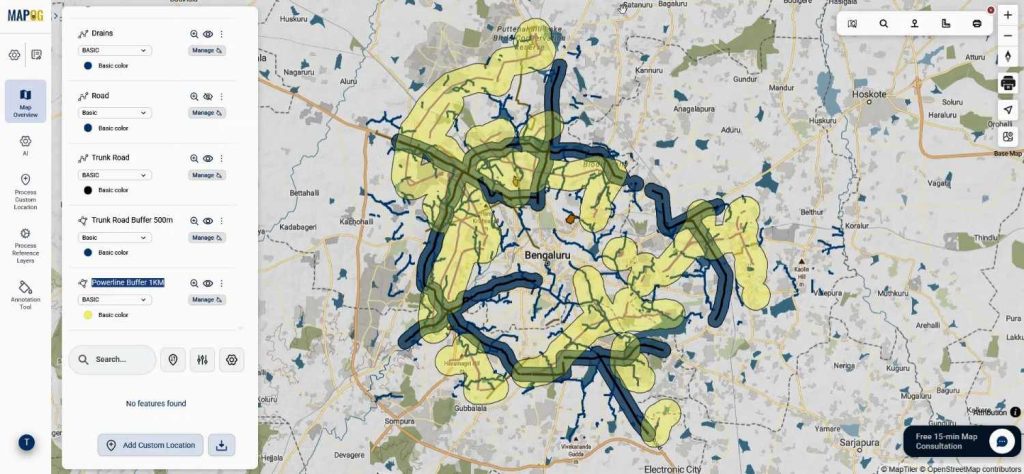
Similarly, users generate a 1 KM merged buffer around powerlines.
Step 5: Proximity Analysis Using Nearby Neighbor
To further strengthen the feasibility study, users apply the Near by Neighbor tool.
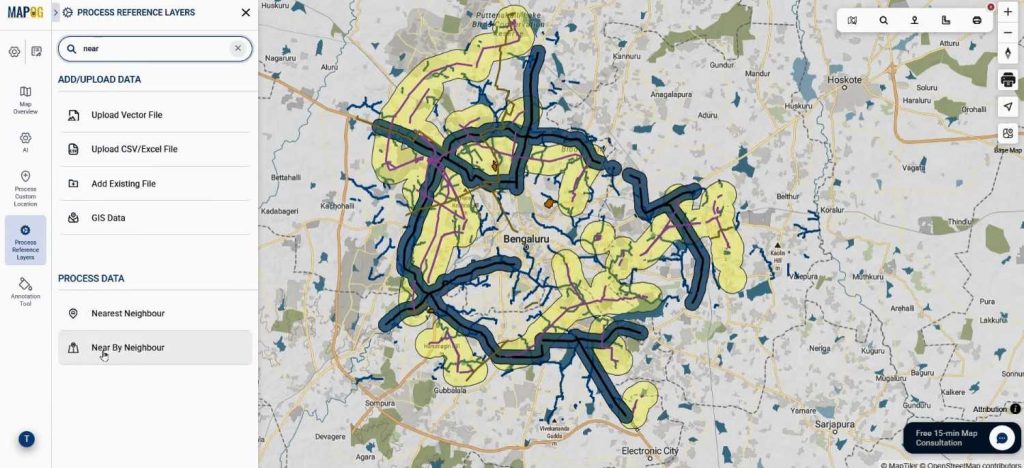
Select the main layer as pipelines & select suitable attributes from it, select the joining layer as proposed sites & select attributes. Set radius as 200 meter & limit as 10 & submit.
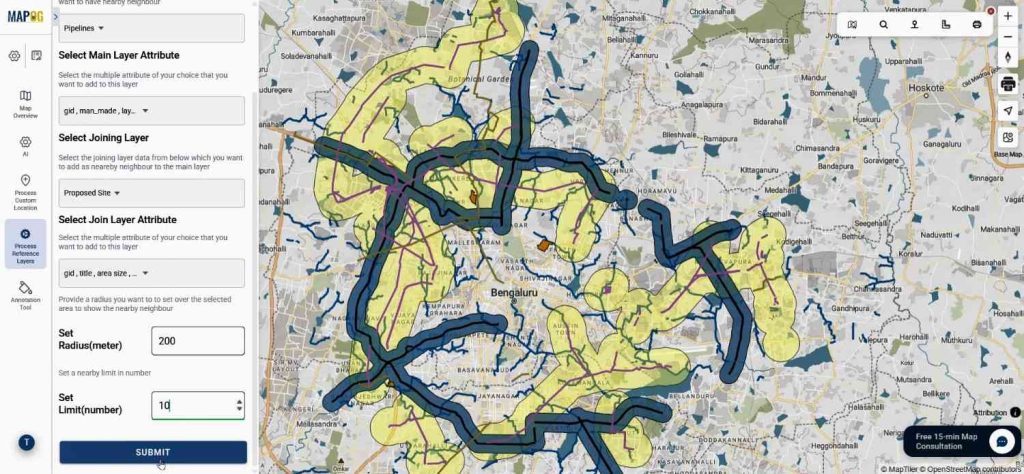
The system extracts pipelines within a 200-meter radius of the proposed sites. Rename the new layer.
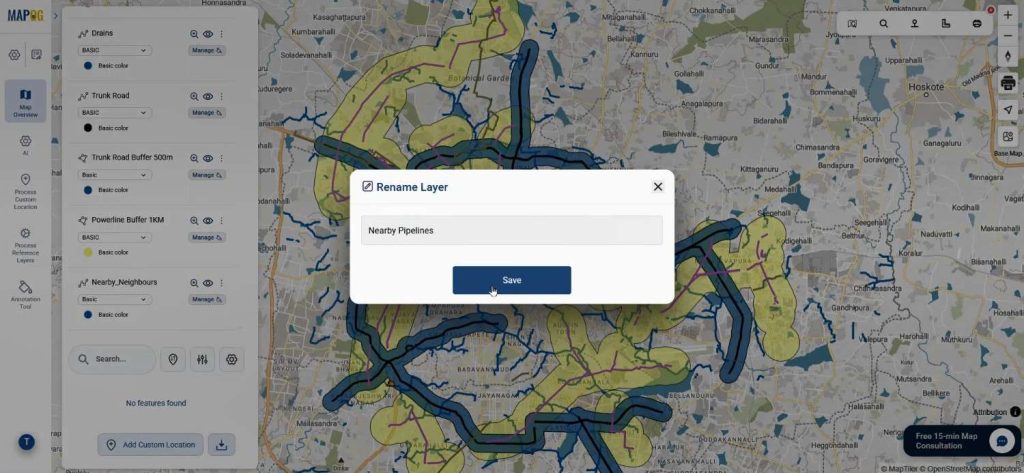
Change color & size from add layer style for better clarity.
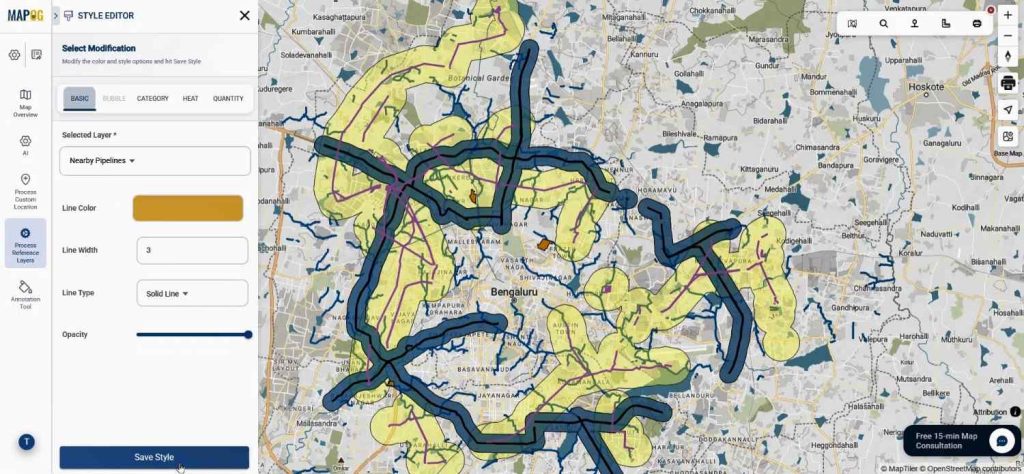
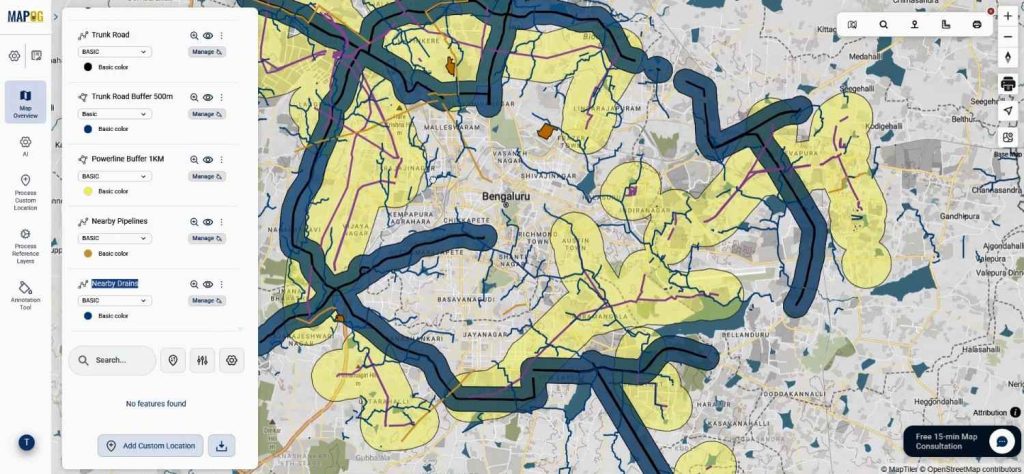
Likewise, drains can also be analyzed in the same way. Therefore, planners gain a clear understanding of nearby utilities, which directly impacts development costs.
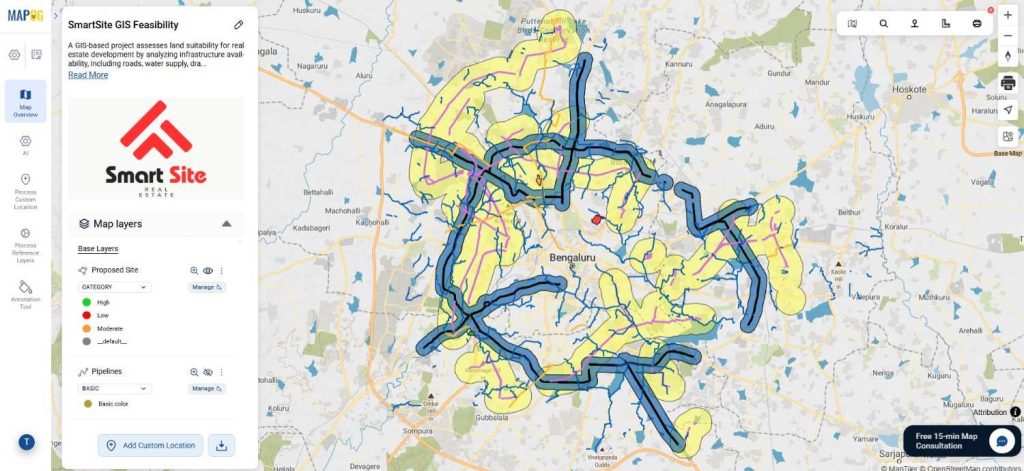
Step 6: Final Feasibility Evaluation
After all layers are analyzed, each site is manually reviewed.
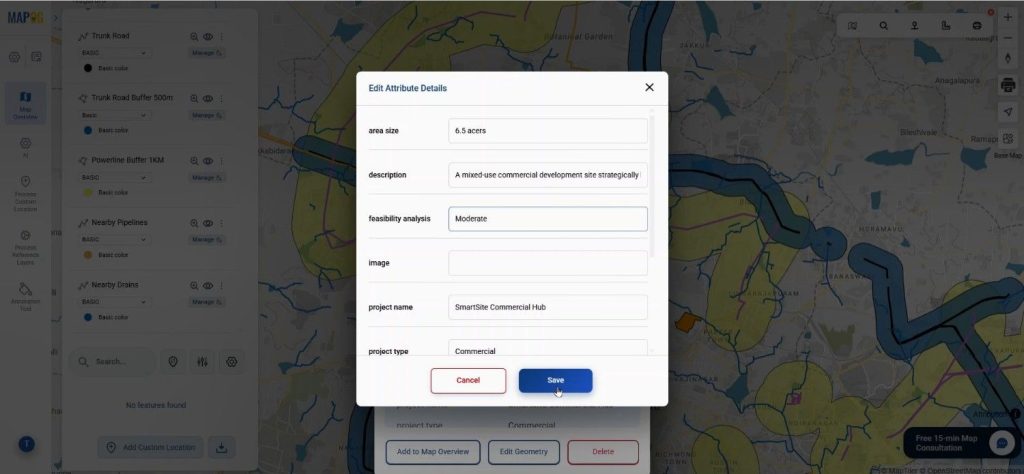
If a site falls within road and powerline buffers and has nearby pipelines and drains, edit its attributes.
it is marked as “High Feasibility” & save it.
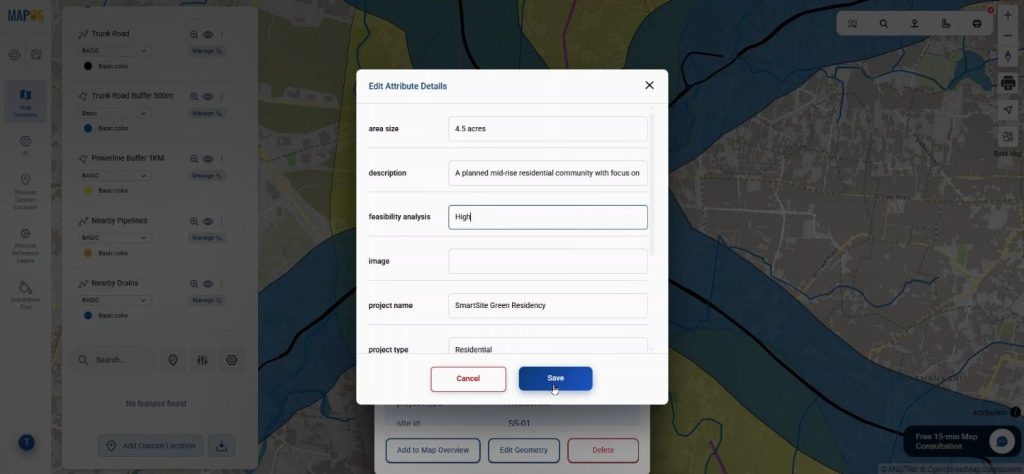
Otherwise, it may be labeled as moderate or low.
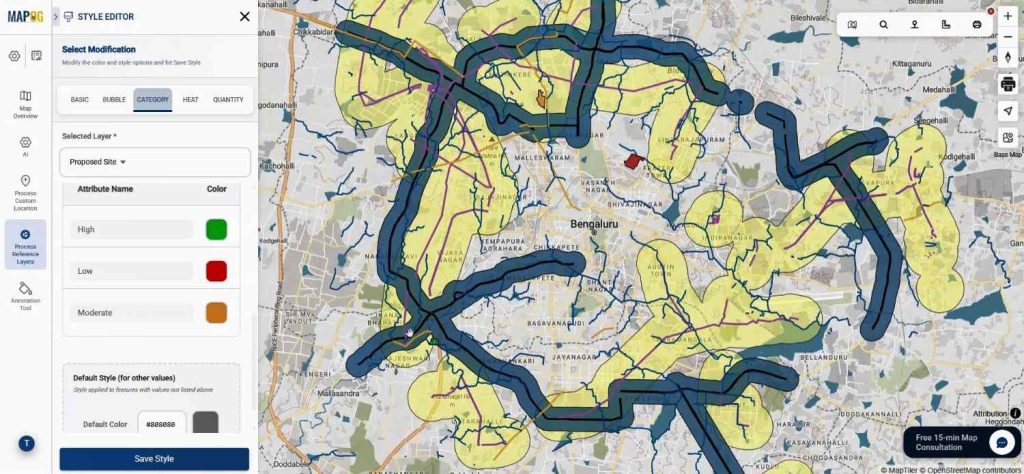
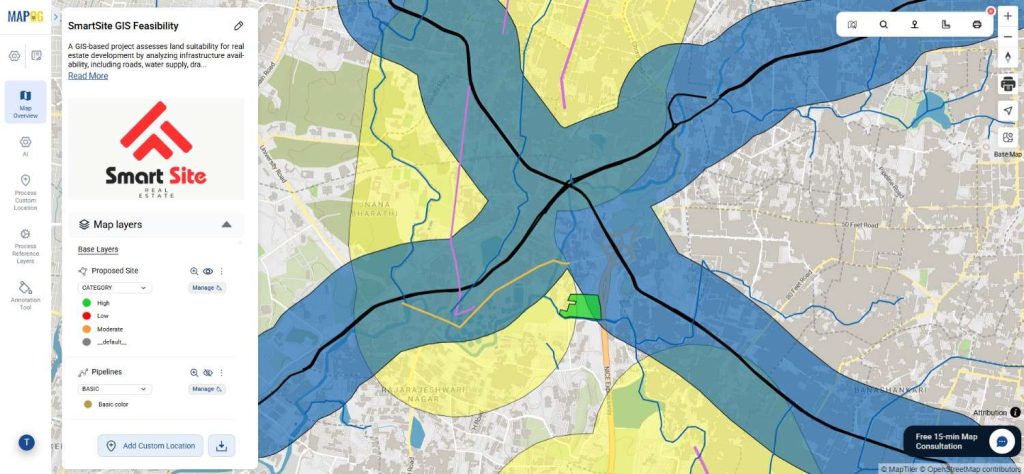
To visually represent it, click on add layer style of proposed site & choose category, select the feasibility attribute.
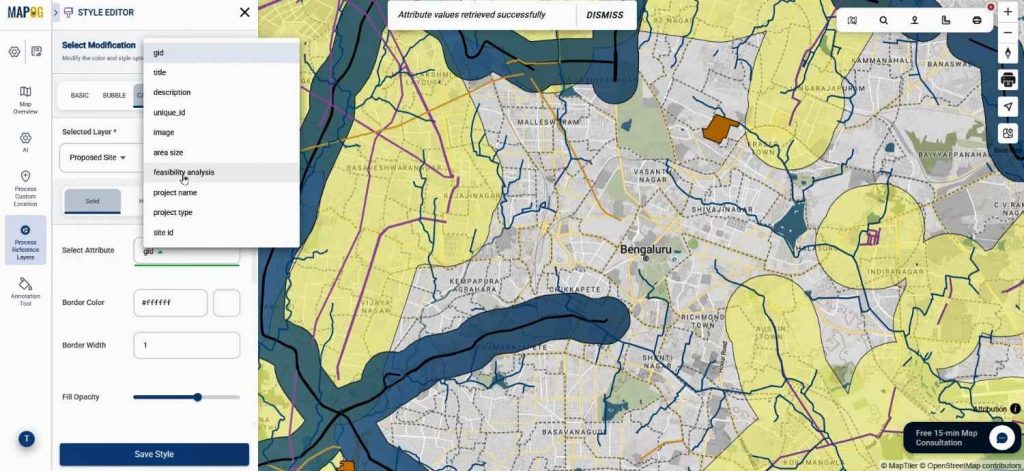
Now provide suitable colors for high, moderate & low feasibility to interpret the analysis better.
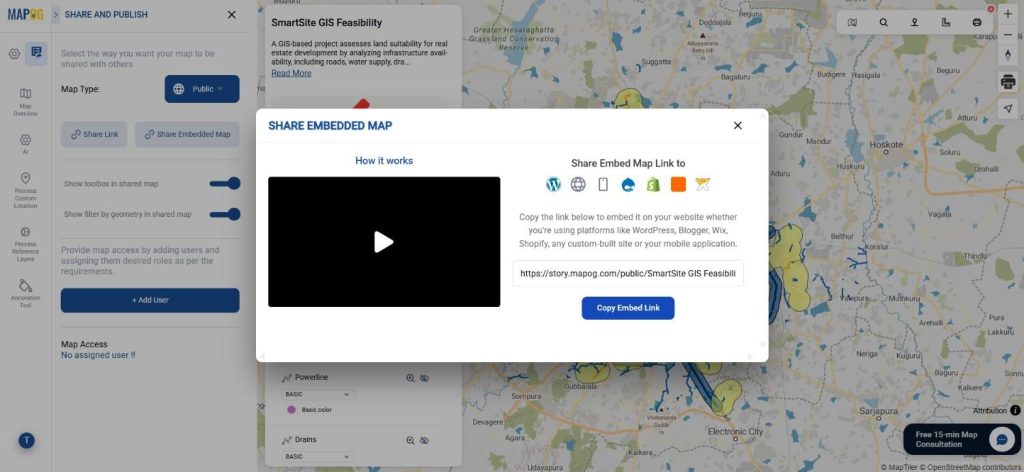
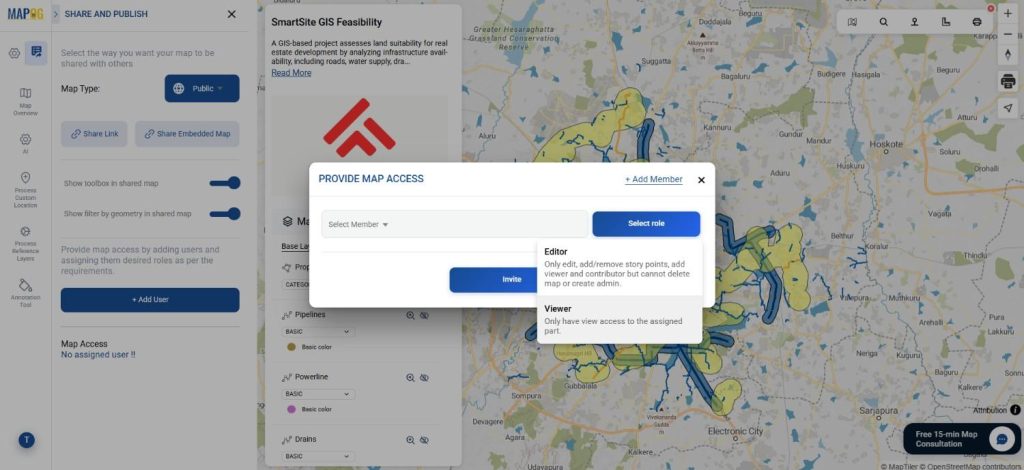
Finally, to share the map click on publish & share. Set the map type as public.
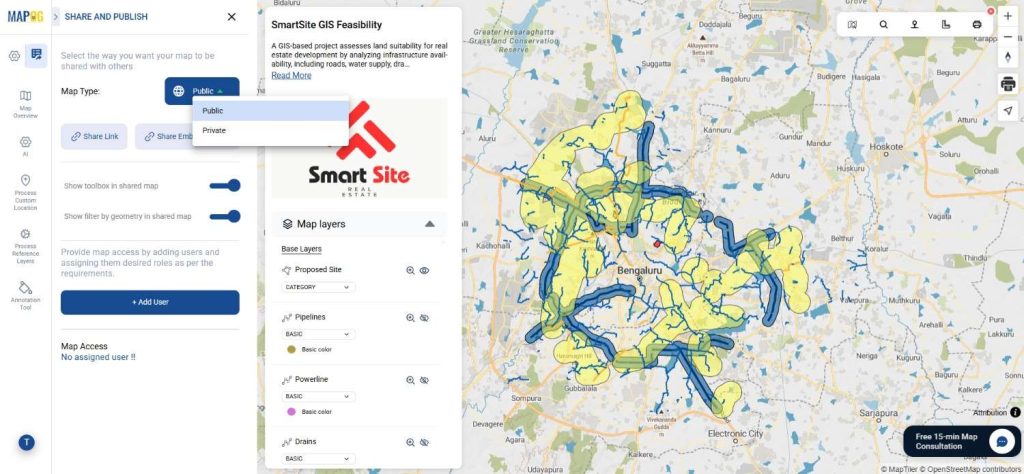
It can also be shared or embedded on websites.
Used collaboratively using the add user option.
Industry Applications & Benefits
Real Estate Site Planning using GIS provides significant benefits by early identification of unsuitable locations, enhancing decision-making through integrated data visualization, and minimizing the need for manual surveys.
This allows commercial developers to efficiently locate plots near essential infrastructure, thus improving ROI, while residential planners can strategically avoid flood-prone or poorly connected areas, making the planning process smarter and more reliable.
Conclusion
Real Estate Site Planning now emphasizes data-driven decisions rather than just location. Utilizing GIS tools such as Advance Filter, Merge Polygon, and Nearby Neighbor allows for precise site evaluation. For land development or feasibility analysis, MAPOG can enhance workflow efficiency.