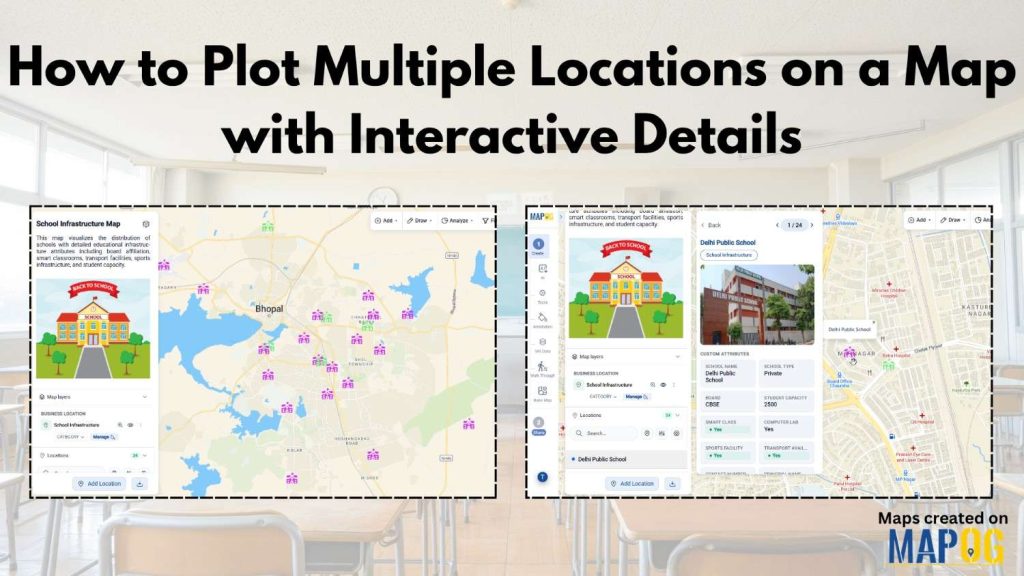
Organizations often struggle to plot multiple locations on a map when information is stored across spreadsheets, and documents. As the number of locations increases, it becomes difficult to track details, categorize, visualize, and quickly access location-specific information.
MAPOG addresses these challenges by providing an interactive GIS mapping platform where users can upload multiple locations, organize them, and visualize them on a single map. Additionally, users can attach detailed attributes, add images, categorize locations using custom styles, and share interactive maps with stakeholders. As a result, MAPOG transforms scattered location records into a centralized geographic view. Consequently, location management, analysis, and collaboration become more efficient, organized, and accessible.
Key Concept of Plotting Multiple Locations on a Map
Each location can contain additional information such as names, categories, descriptions, contact details, images, and custom attributes. Instead of managing records through spreadsheets, users can visualize all locations together and access detailed information by simply clicking on a location point.
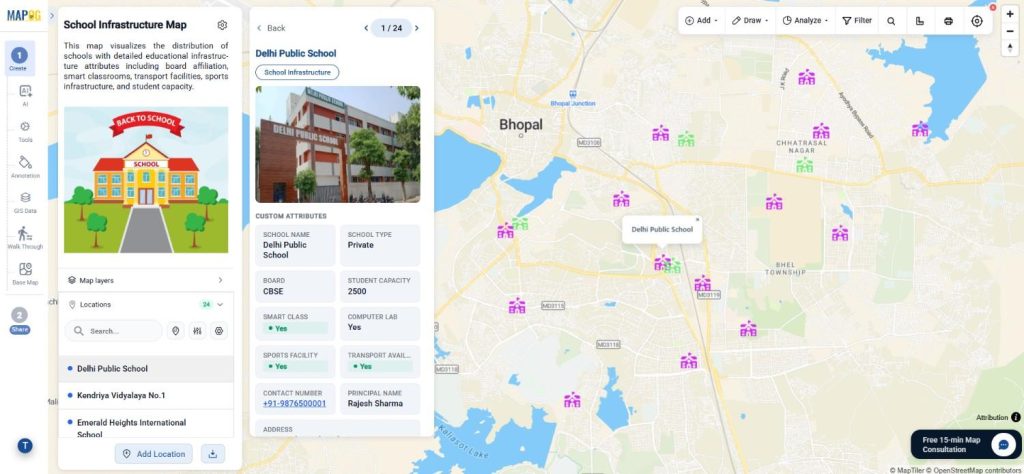
Step-by-Step Process to Plot Multiple Locations on a Map with Interactive Details
Step 1: Create a New Map
First, open MAPOG and navigate to the Create & Publish Maps section.
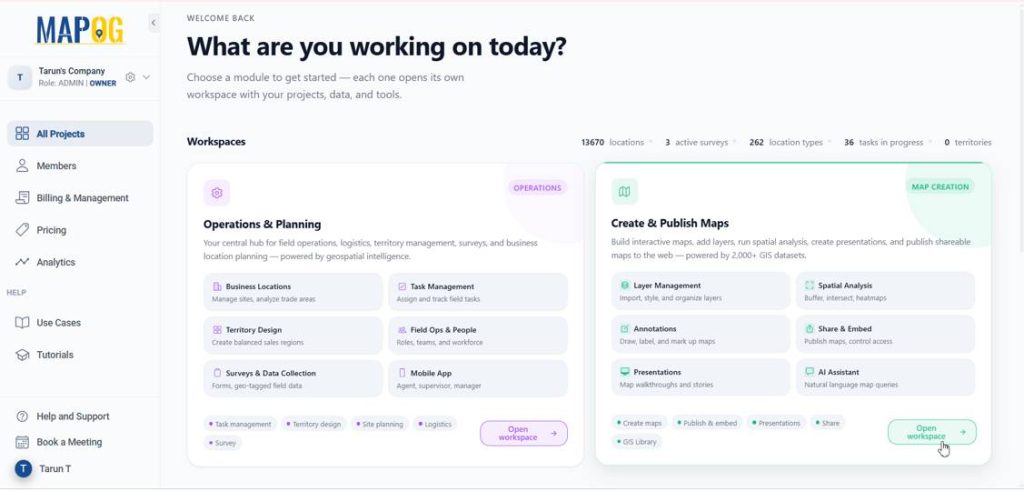
Click on open Workspace then click on Create New Map to start a new mapping project.
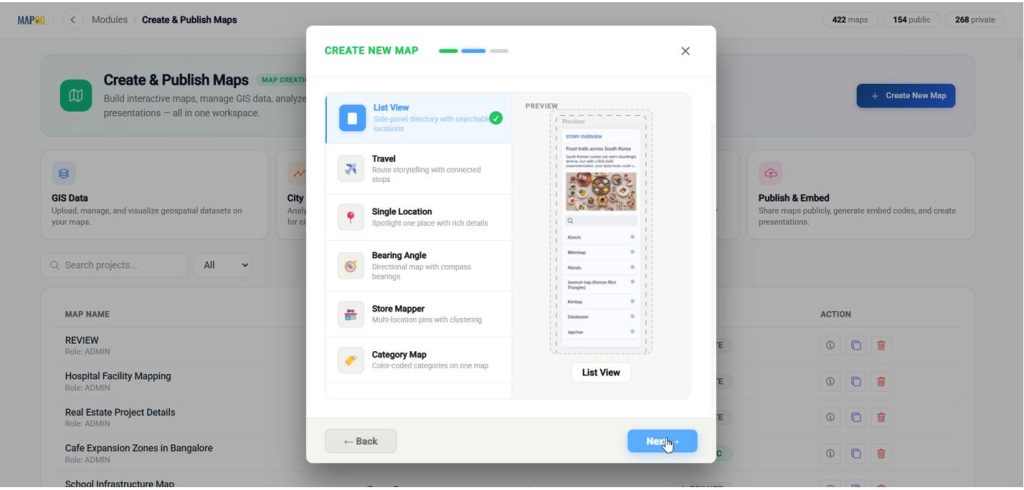
Select with template and click Next.
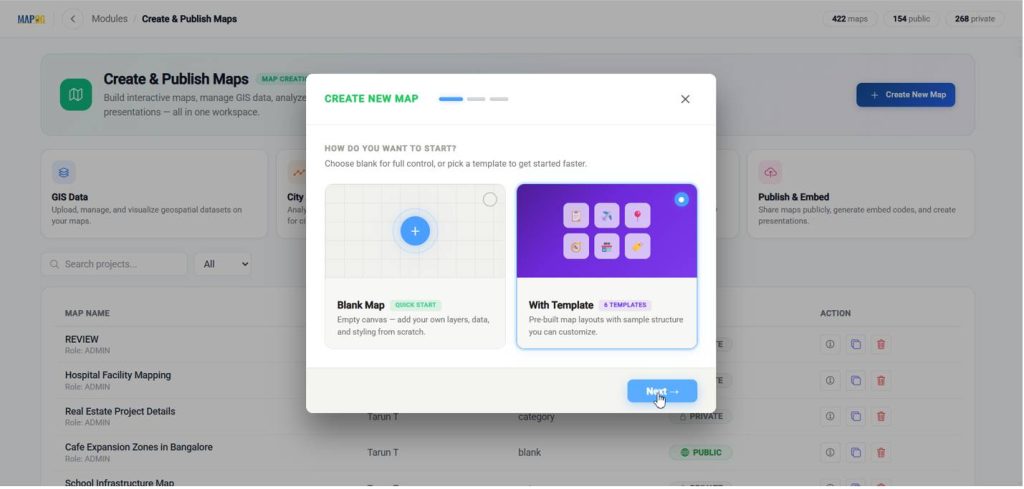
Next, choose the List View template and click Next.
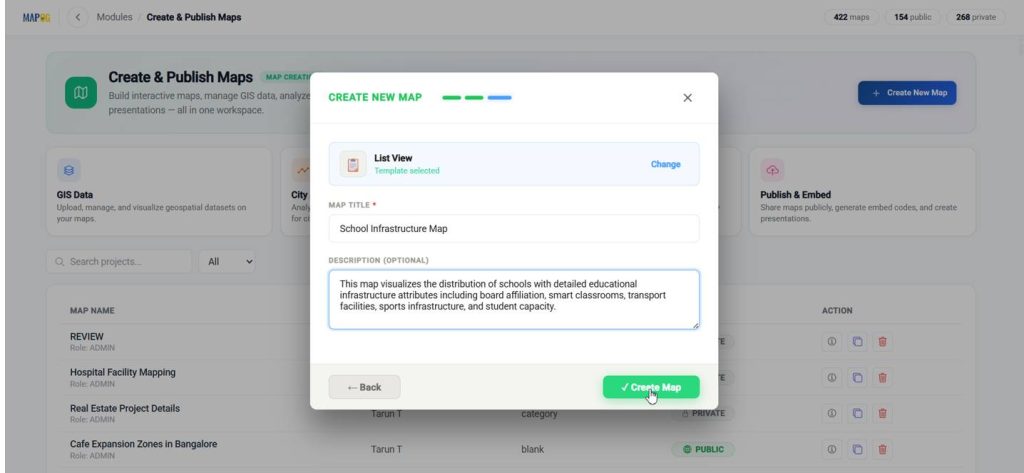
After that, enter the project title and description. Then, click Create Map to generate the workspace.
Step 2: Create a Business Location Template
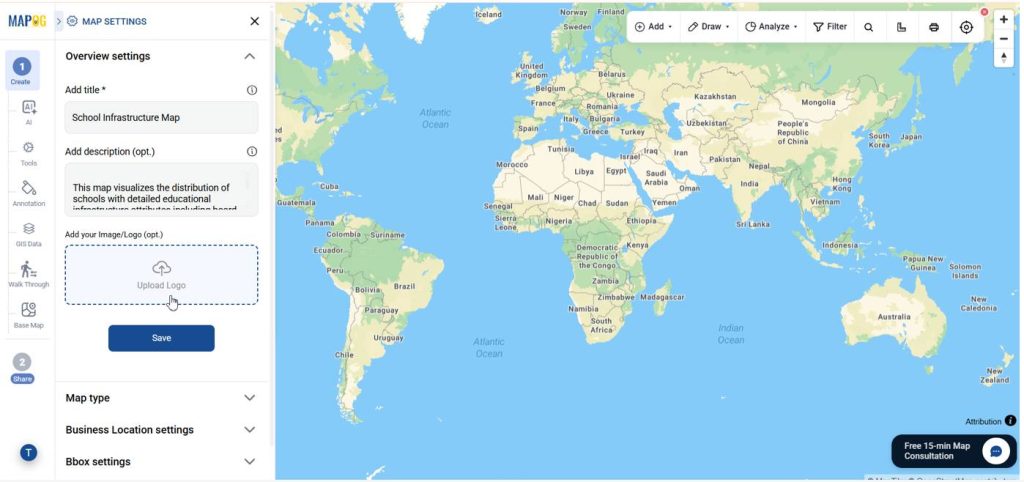
Now Click Settings and upload your image/Logo then save.
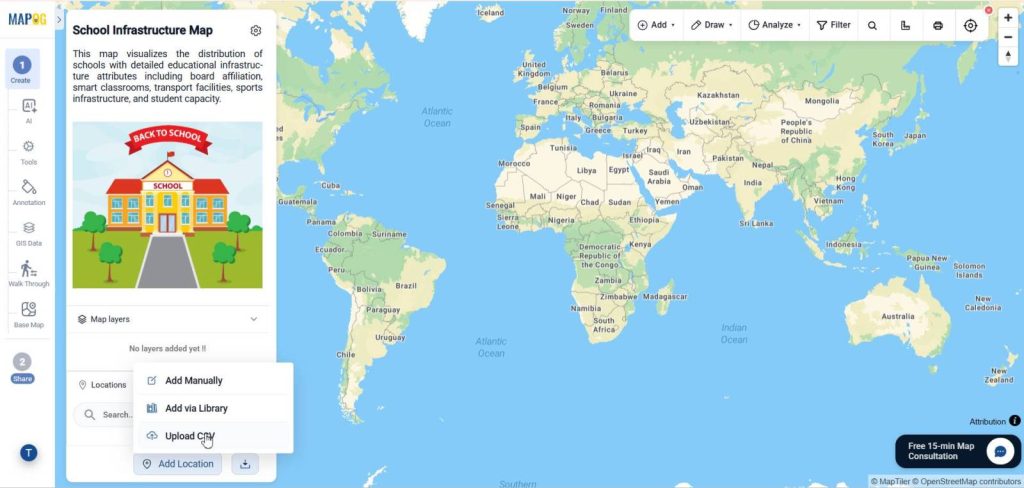
Once the workspace is created, go back and click the Add Location section. From there, select Upload CSV.
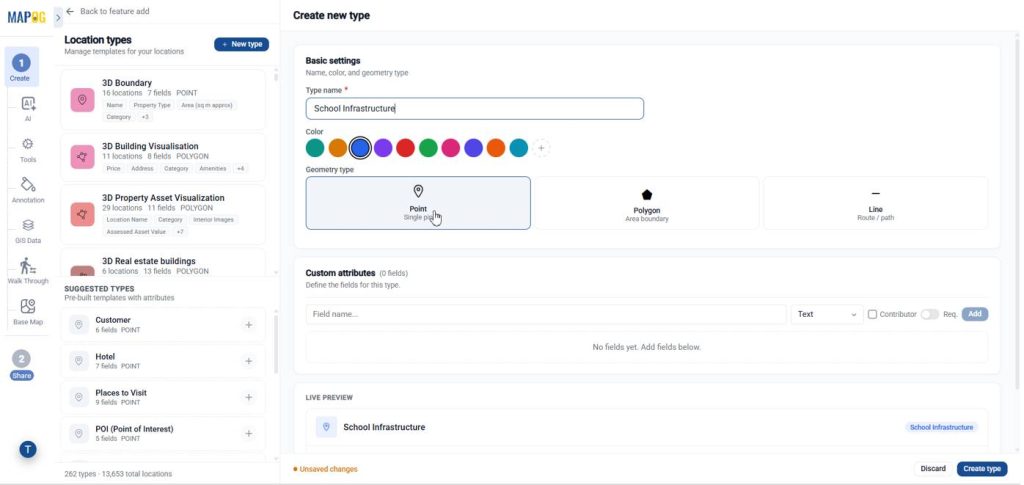
Now, from the Business Location Template settings, select New Type.
Then, enter a suitable template name. Next, choose an appropriate visualization color and geometry to display the locations on the map.
Step 3: Add Fields for Interactive Details
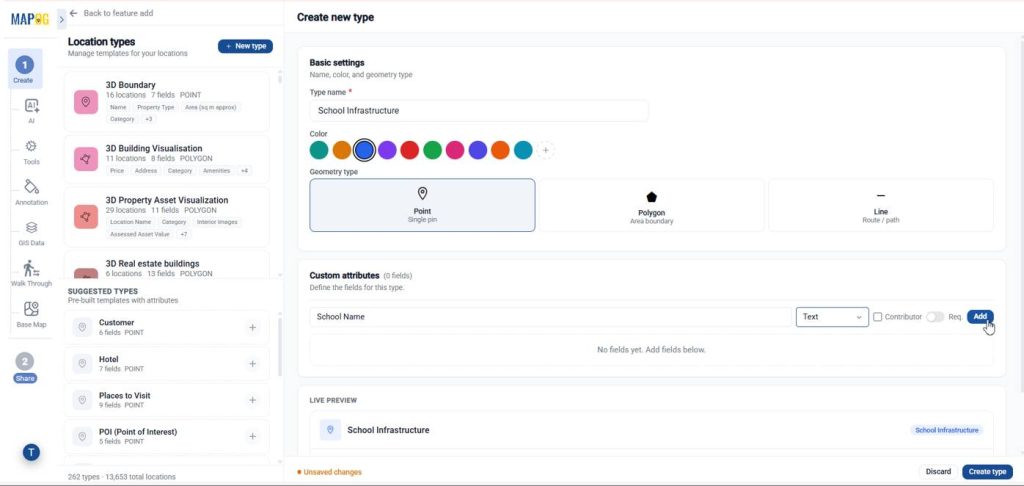
Afterward, begin creating the custom attribute fields that will store information about each location.
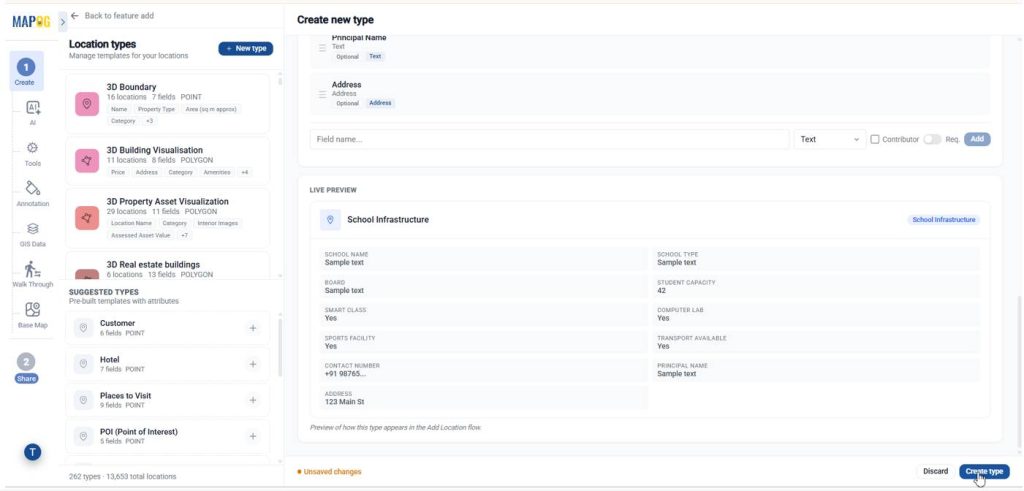
For the School Infrastructure example, fields may include:
- School Name
- School Type
- Student Capacity
Choose fields such as Text, Number, dropdown then click on Add.
After adding all fields, click Create Type.
Step 4: Upload Multiple Locations Using CSV
Select the newly created Business Location Template.
Now click Select File and upload the CSV containing multiple location records.
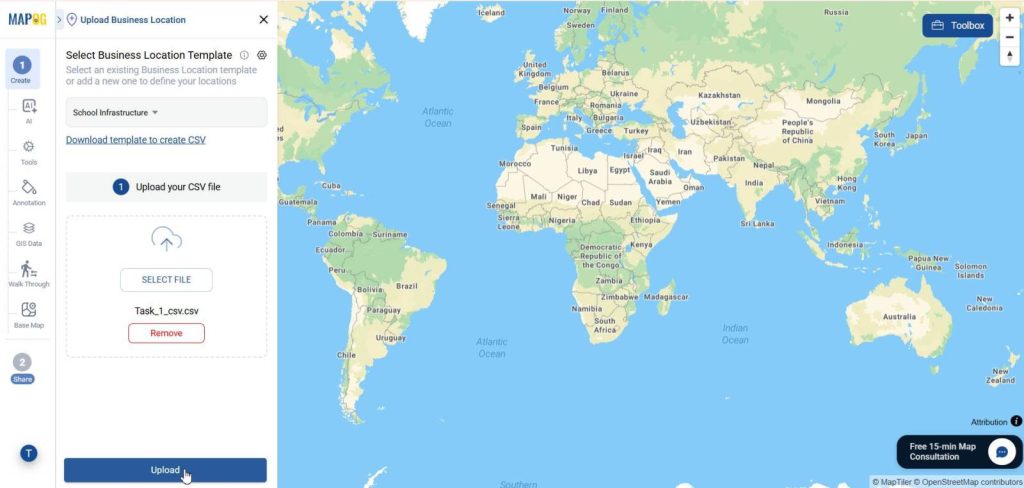
After uploading, select a Unique ID field to prevent duplicate records.
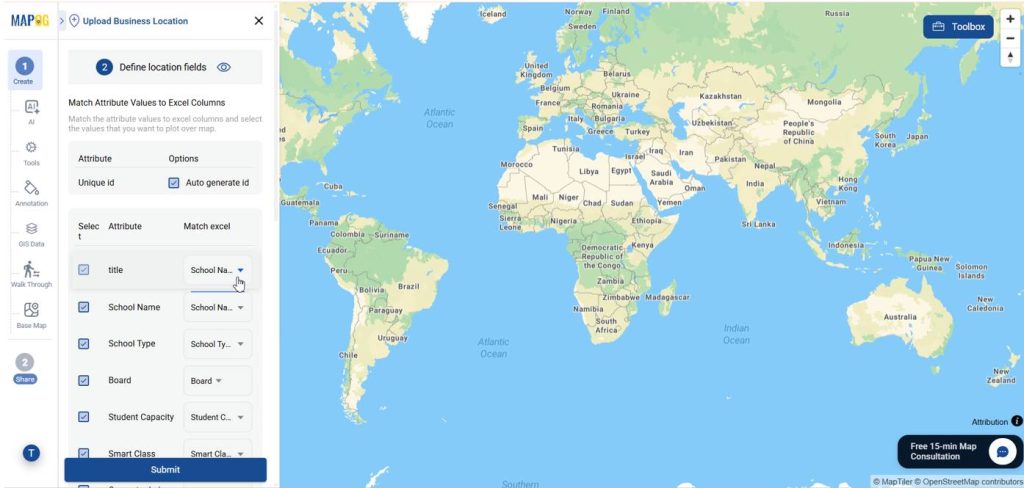
Next, match all CSV columns with their corresponding template fields.
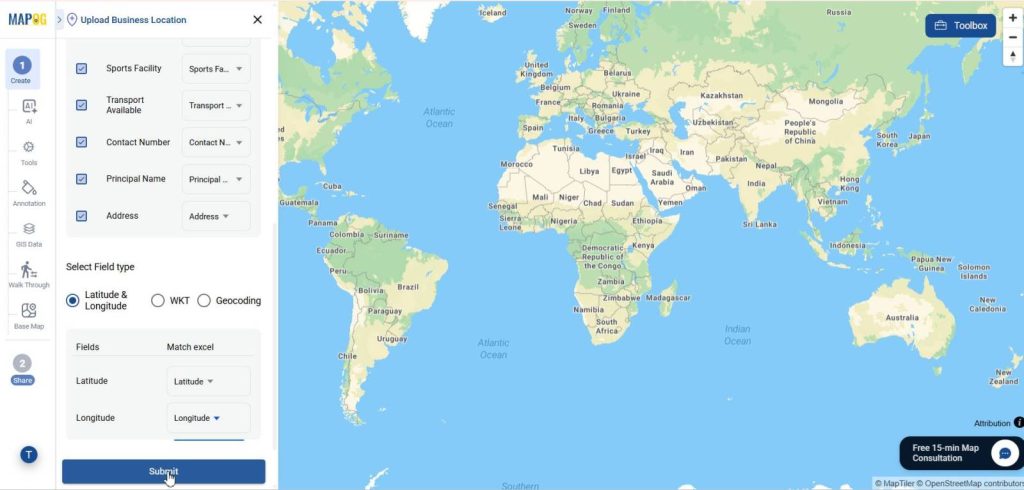
Select Latitude and Longitude as coordinate fields from the select field type for plotting the locations then click submit.
MAPOG will process and plot all locations on map.
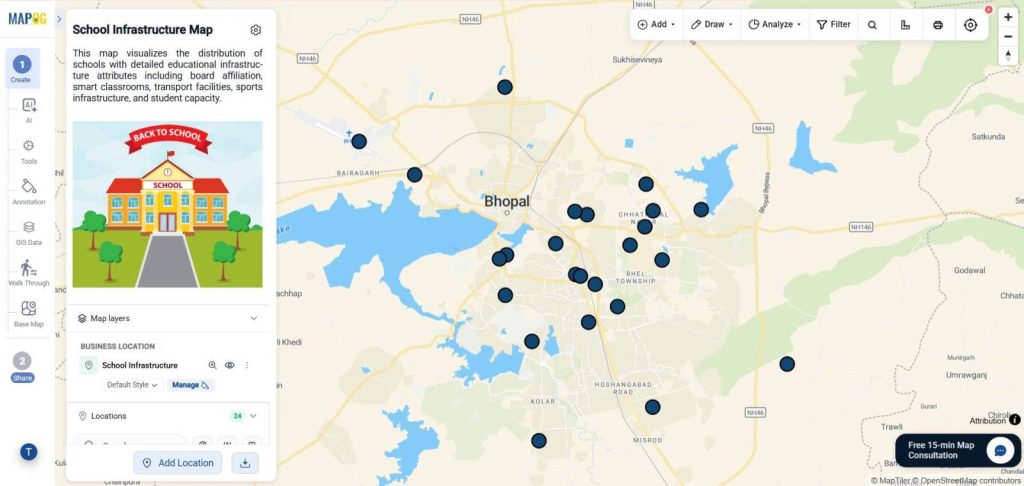
Step 5: Add Interactive Details and Images
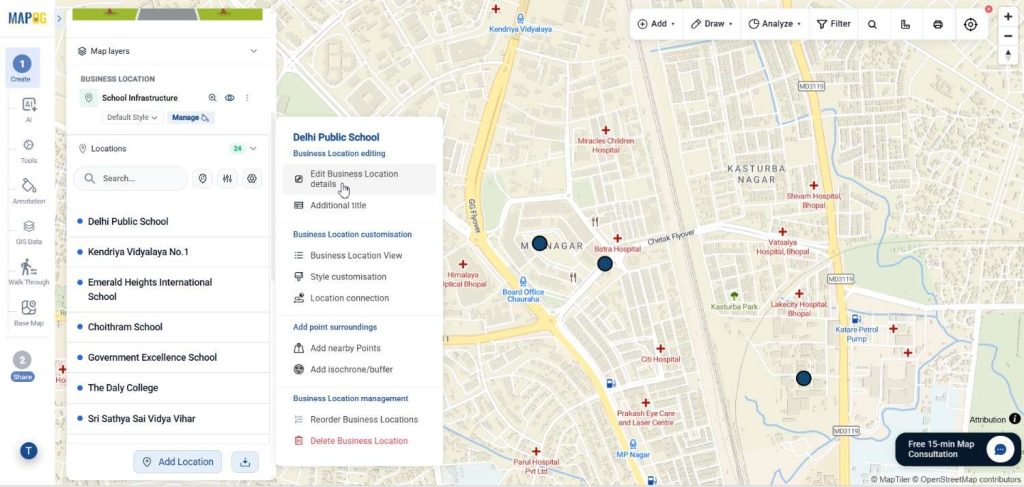
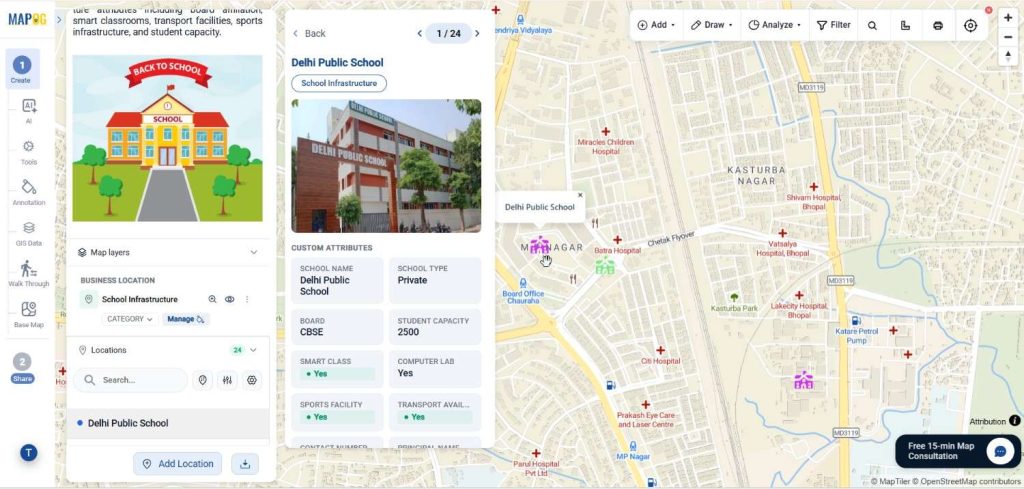
Click on any location point to open its information.
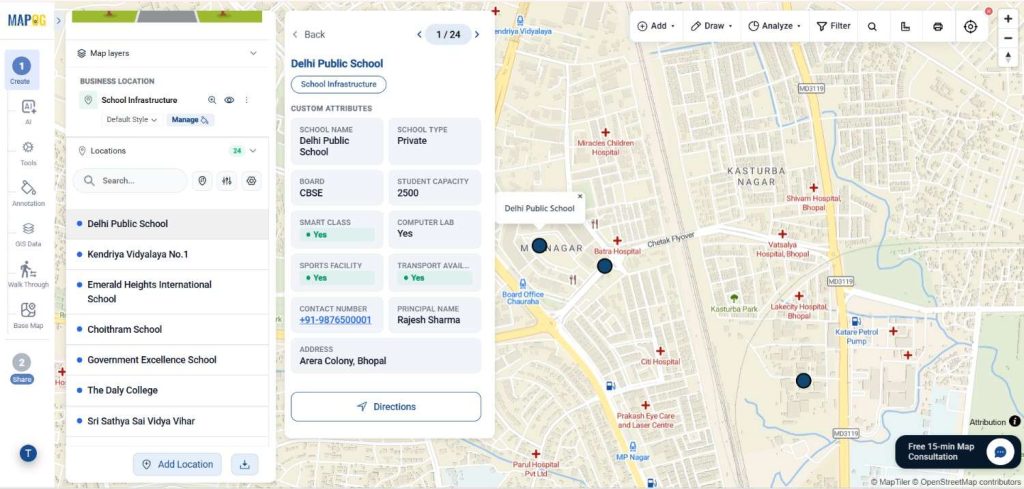
Users can also upload images or logos associated with the location by clicking on the edit toggle. Select the Edit Business Location details.
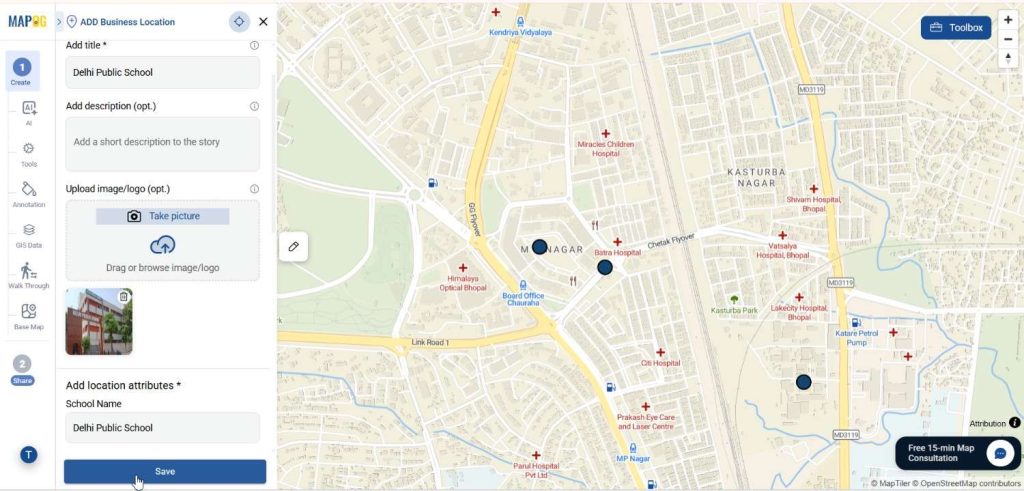
Add required details & upload image/logo then save.
After saving, we can view this image whenever users open that location.
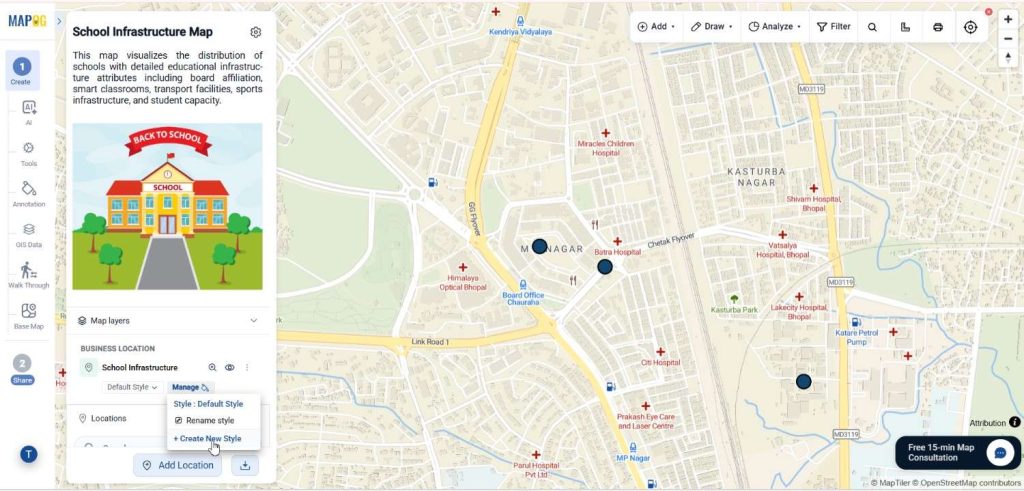
Step 6: Apply Layer Style and Category-Based Visualization
Next navigate to the Map Layers section and locate the School Infrastructure layer. Click Manage and select Create New Style.
This opens the Style Editor. Select the Category tab and choose Select attribute for categorization.
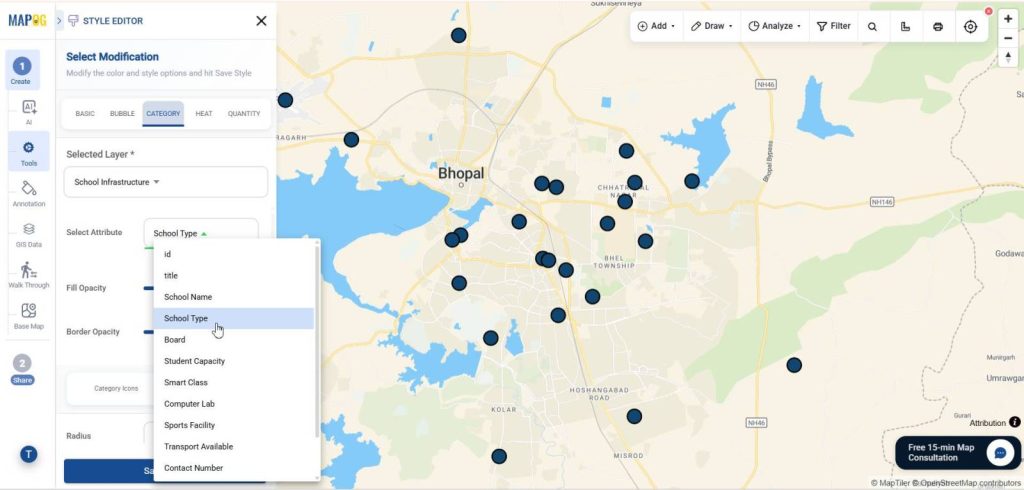
In category icons assign different colors or icons (can search), such as Government and Private schools.
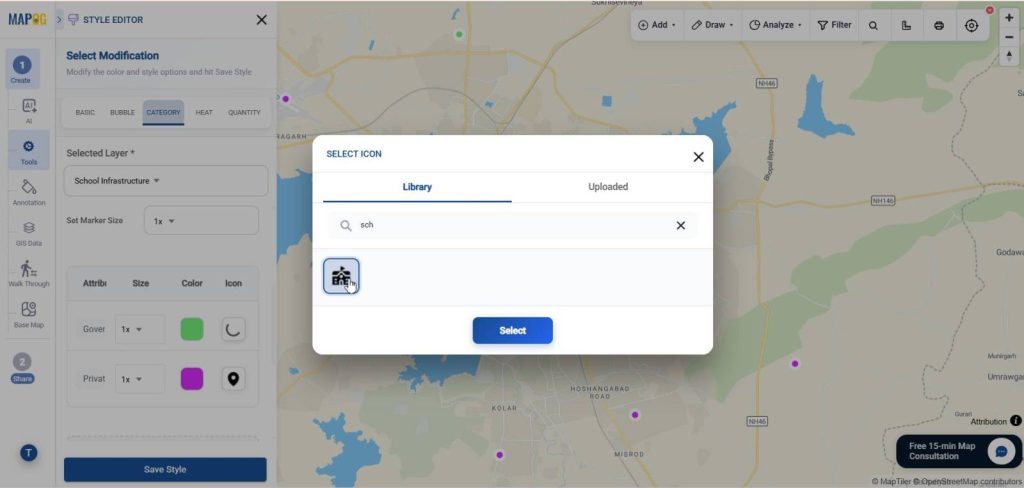
Save the style settings and click continue.
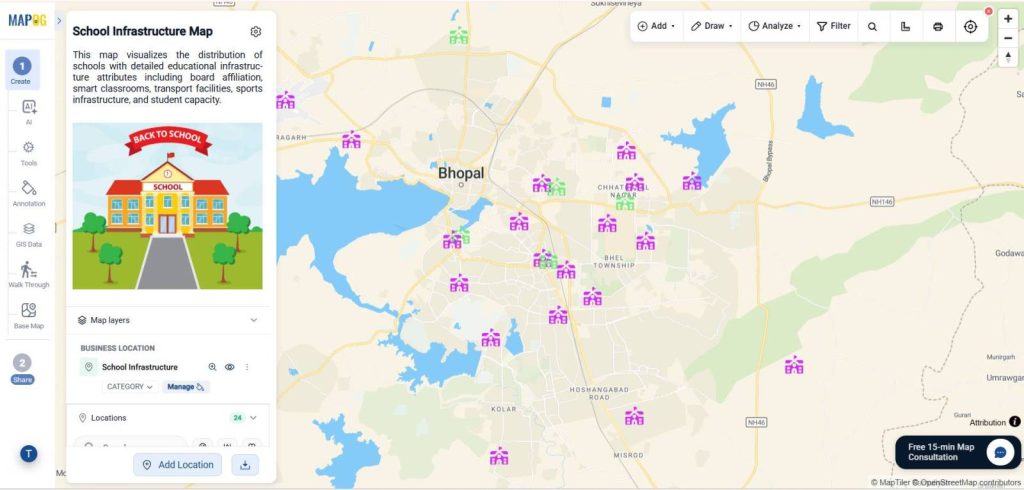
Step 7: Preview and Share the Map
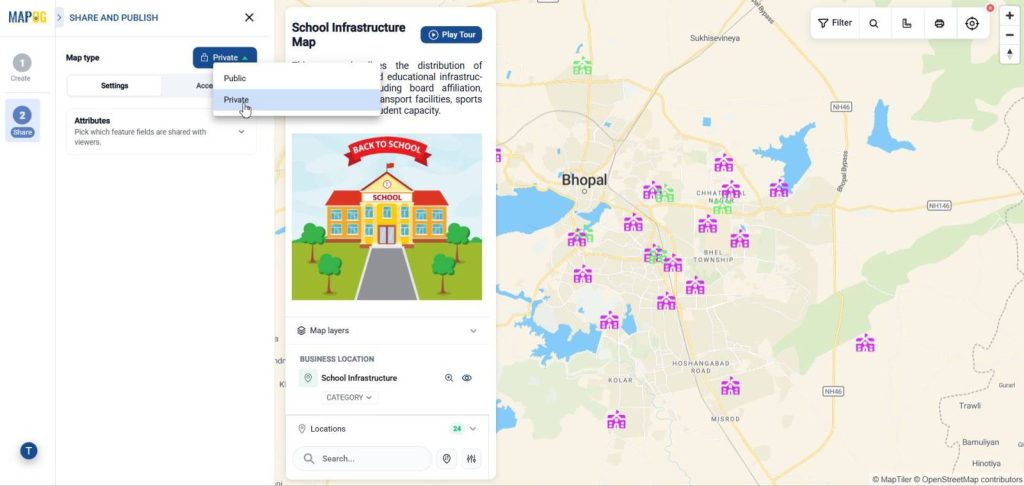
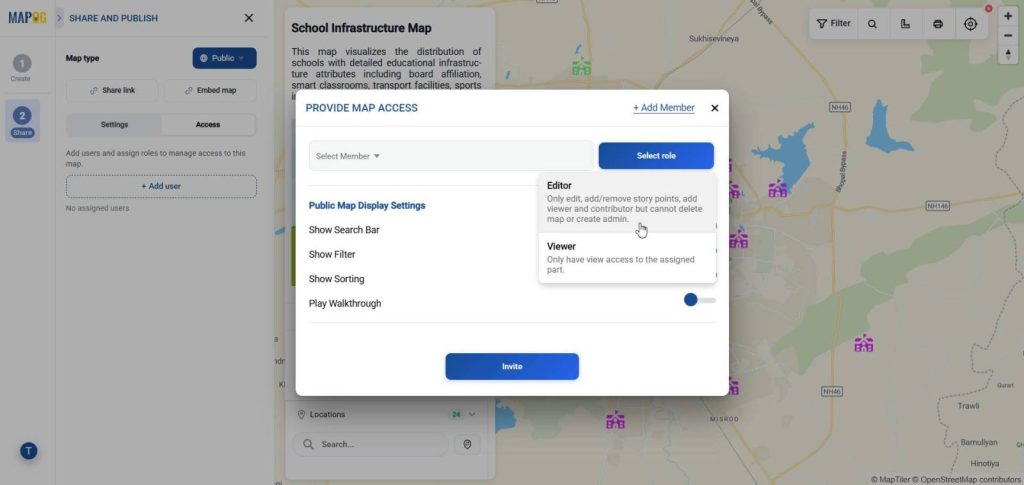
After completing the visualization process, move to the Share and publish section.
Users can choose whether the map should remain Private or be made Public depending on project requirements.
The map can be shared through a direct link or access in Public.
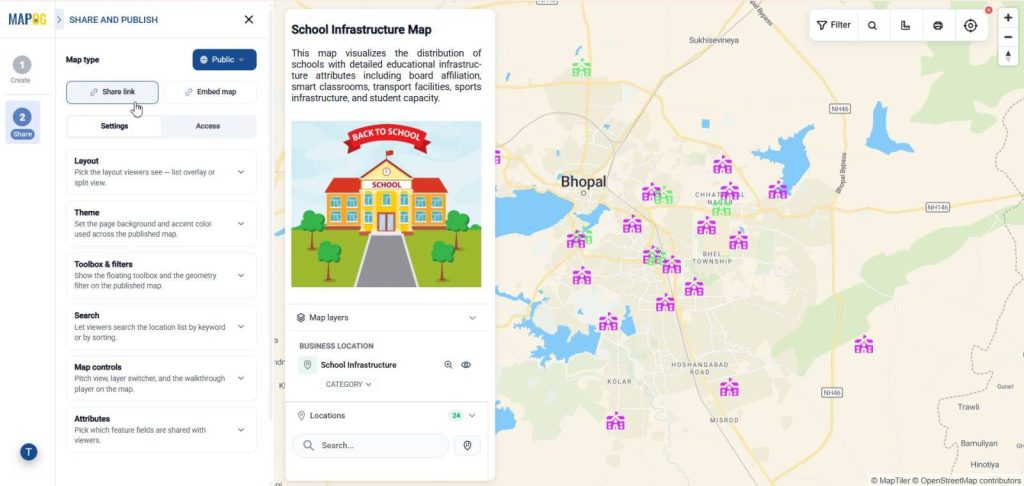
In access by clicking Add User then control who can view, or edit. Click Invite to share the map.
Applications of Interactive Location Mapping
Interactive location mapping can be applied across a wide range of industries and sectors. By combining geographic visualization with detailed location information, organizations can improve operational efficiency, decision-making, and gain better insights from their location data.
Conclusion
Plotting multiple locations on a map with interactive details helps organizations manage geographic data more efficiently. Instead of relying on spreadsheets and static records, users can visualize locations, store detailed information, add images, apply custom styling, group data by attributes, and share maps from a single platform. With MAPOG, we can map multiple locations, organize and analyze them in an interactive environment, making location-based decision-making faster and more effective.