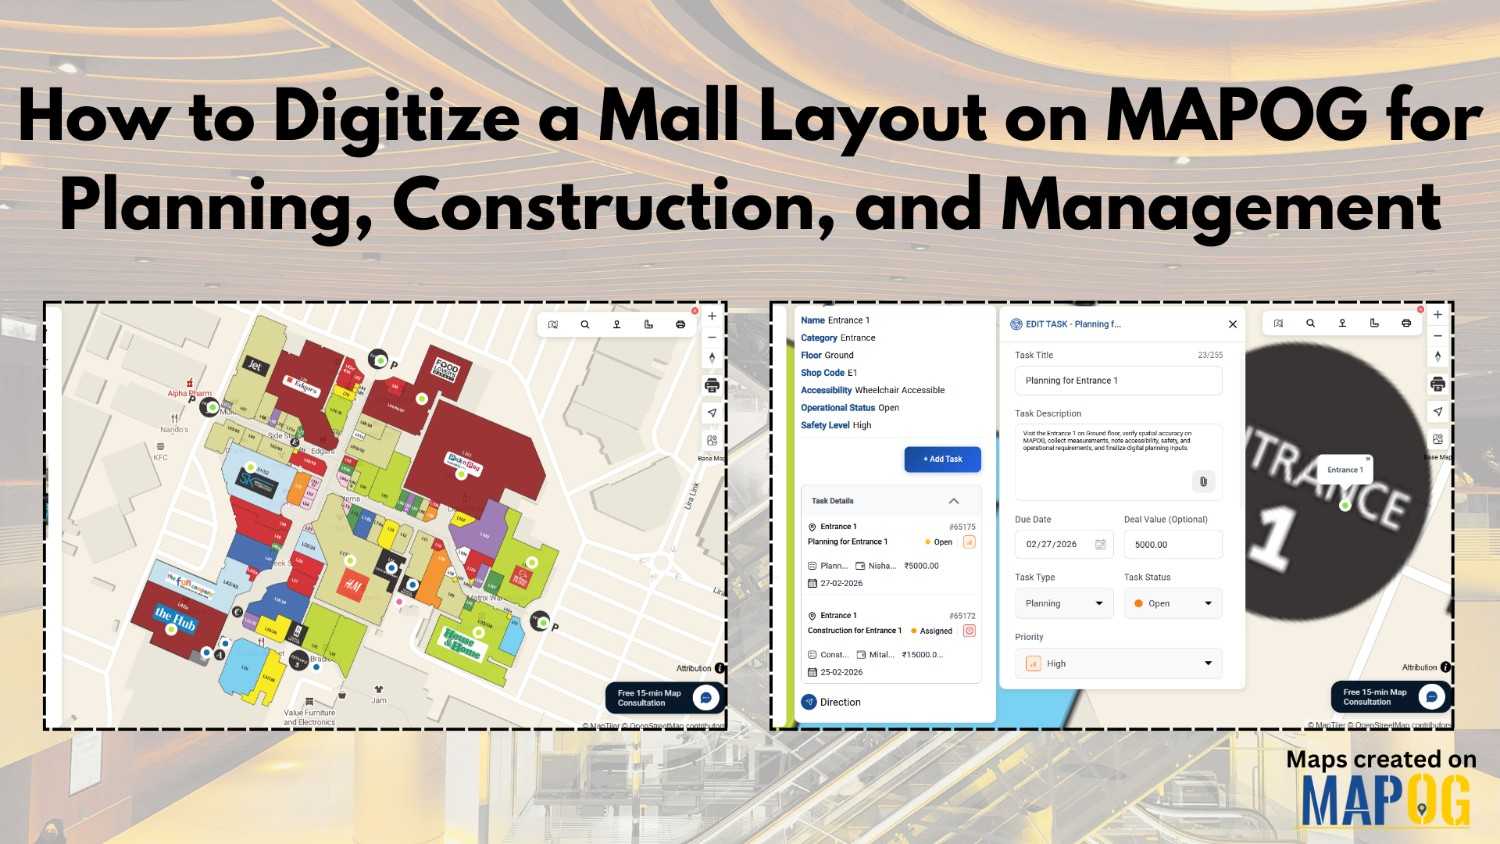
MAPOG Analysis

How to Draw 3D Buildings

How to Draw 3D Buildings on a Live or Dynamic Map

In the world of digital mapping, the concept of 3D mapping has changed how we visualize spaces. MAPOG is a mapping tool which allows users to draw realistic 3D buildings with ease, specifically for urban planning, real estate visualization, or educational use. Key Concepts of 3D Buildings You Should Know Drawing 3D buildings on a … Read more

Create an Interactive Map with Photos & Details at Each Location

Attaching images & details to any kind of map provide a value that people could easily relate to themselves. For example, instead of scrolling through long property listings or dealing with brochures, MAPOG provides a platform to create interactive maps that makes it simple to display available real estate rooms, buildings, or commercial spaces on … Read more

How to Create a Shareable Map Portfolio from Excel/CSV Data

Create a shareable map portfolio from Excel/CSV data to bring your projects to life in a visually compelling way. Although spreadsheets are excellent for storing detailed information, they often fall short in conveying the scale, diversity, and geographic reach of your work. While using MAPOG, you can transform that same data into an interactive map … Read more

How to Use a Mapping Platform to Plan Travel Itineraries

How to Use a Mapping Platform to Plan Travel Itineraries

Planning trips becomes easier and more engaging through interactive travel itinerary mapping. In fact, mapping platforms transform travel ideas into clear, visual routes that anyone can follow. Moreover, these tools integrate destinations, routes, and data layers, allowing travelers to Plan Travel Itineraries efficiently and explore confidently. Key Concept: Plan Travel Itineraries Interactive mapping unites all … Read more

Dynamic Map

What Is a Dynamic Map and How to Create One Online

In today’s fast-paced, connected world, dynamic maps have become essential tools for navigating both everyday life and complex journeys. Unlike traditional static maps, dynamic maps are interactive and responsive i.e. they allow users to zoom, pan, click for details, and customize views with layers or markers. From urban planning to planning efficient routes, these digital … Read more

Automated Tools to Calculate Bearing Angle and Distance on Maps

Automated Tools to Calculate Bearing Angle and Distance on Maps

In the world of navigation and surveying, bearing angle and distance measurements—from true north, clockwise in degrees, and along the ground—form the core of accurate mapping. Traditionally, these demanded manual calculations with compasses and trigonometric tables, risking errors in everything from land deeds to flight paths. However, automation has transformed this process. MAPOG computes bearing … Read more

Properties with nearby Amenities

How Real Estate Agents Can Use Map to Show Real Estate Properties with nearby Amenities?

Looking to make your real estate property listings stand out? With MAPOG, real estate agents can map real estate properties with nearby amenities easily to create interactive property maps that enhance clarity, transparency, and decision-making for potential buyers and renters. By integrating accurate location coordinates with valuable contextual data—such as proximity to schools, hospitals, shopping … Read more

Showing map view of customer locations with popups, created after uploading excel data of customer list

How to Upload Your Customer List (CSV or Excel) and Plot It on a Map

When you upload your customer list in Excel or CSV format, you’re storing useful details like names, addresses, and service records, but the data stays flat. That’s because spreadsheets don’t show you where customers are clustered, which areas are under served, or how your field teams move across zones. As a result, it’s hard to … Read more

final visuals of GeoJSON data on an interactive map

How To Visualize GeoJSON Data On Interactive Maps

Trying to visualize GeoJSON data can be challenging when moving from raw spatial data to an interactive map. Although GeoJSON is widely used to store geographic features and attributes, it lacks built-in styling and interactivity. This makes raw files difficult to interpret, especially for non-technical audiences. Moreover, converting GeoJSON into a usable map often requires … Read more

Cover image showing how to create 3D building maps online without coding.

How to Create 3D Building Maps Online Without Coding

To create 3D building maps online without coding once felt out of reach, especially for field teams or planners without access to costly software. Yet in disaster-prone or rapidly changing areas, visualizing buildings in 3D is often essential. It helps people assess risk, communicate clearly, and act faster. That’s where MAPOG comes in: a GIS … Read more