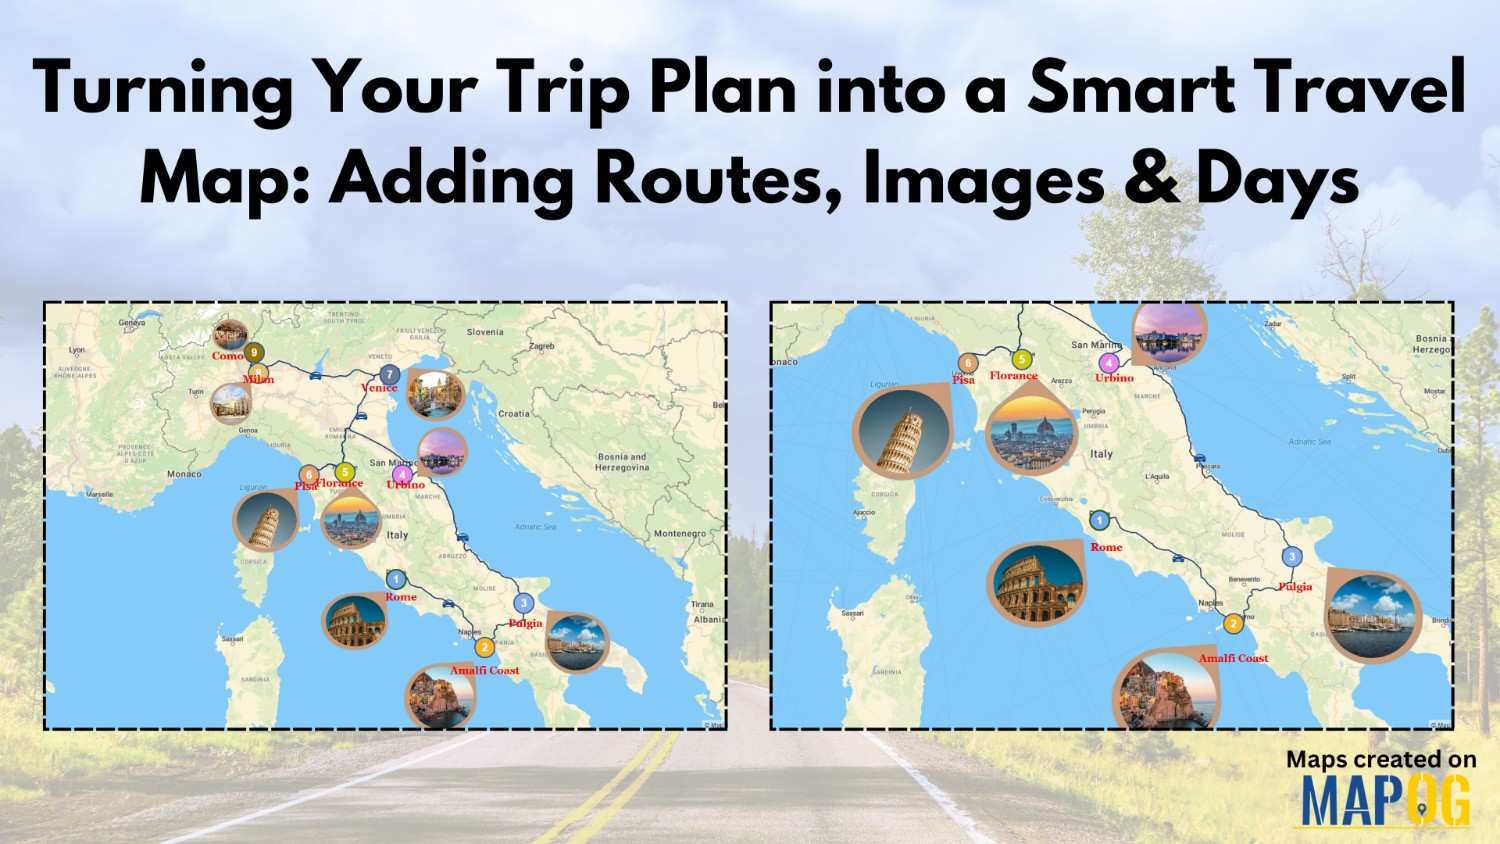
MAP STORY

Free Custom Mapping – Visualize, Plan & Share

Free Custom Mapping – Visualise, Plan & Share

Mapping is a powerful tool that helps individuals and businesses visualize data, plan strategies, and share insights. With free custom mapping solutions like MAPOG, you can create interactive and free custom maps that bring data to life. MAPOG allows users to integrate GIS data seamlessly, customise maps, and share them effortlessly. Whether for Travel Planning, … Read more

HOW GIS CAN HELP IN REDUCING URBAN HEAT ISLANDS WITH SMART MAPPING

How GIS and Smart Mapping Reduce Urban Heat Islands

GIS for Heat Island Reduction enables smart mapping to analyze temperature variations identify heat-prone areas, and optimize green spaces. It supports strategic tree planting, reflective surfaces, and heat-resistant materials. GIS-driven data aids urban planners in designing cooler, sustainable cities with improved land use, reducing heat retention and energy consumption. Key Concept: GIS for heat island … Read more

The Role of GIS in Cyber Security and Geospatial Intelligence

The Role of GIS in Cyber Security and Geospatial Intelligence 

In today’s data-driven world, maps are no longer just tools for navigation, they are powerful instruments for analysing patterns, making informed decisions, and solving complex problems. Whether Tracking Population and Literacy Data Attribute , Thematic Mapping for Data Analysis or a researcher visualising data, MAPOG is your go-to platform for creating professional, insightful maps. In … Read more

Facilitating warehouse location selection

Optimizing Warehouse Location Selection with GIS for Supply Chain Efficiency

GIS optimizes supply chains and logistics by enabling precise route planning, fleet tracking, warehouse Site Selection, Demand Forecasting, and Risk Assessment. It enhances inventory management, facilitating warehouse location selection, reduces transportation costs, improves delivery efficiency, and supports data-driven decision-making, ensuring streamlined operations, better resource utilisation, and improved customer satisfaction across supply networks. Key Concept in … Read more

Role of GIS In Irrigation Planning and Water Resource Management

Role of GIS In Irrigation Planning and Water Resource Management

GIS plays a vital role in irrigation planning and water resource management by optimising site selection, assessing water demand, designing irrigation networks, and analysing crop suitability. Additionally, it enhances decision-making through spatial analysis, monitors water distribution, prevents water logging, and integrates data for sustainable and efficient water resource utilisation. Key Concept in Monitoring GIS in … Read more

GIS In Air Quality Monitoring and Pollution Control

GIS plays a crucial role in air quality monitoring and pollution control. It maps sources, tracks emissions, and Identifies Hotspots for better decision-making. GIS supports in Air Quality mapping, Urban Planning, Evaluates Control Measures, and helps reduce key pollutants like PM, NOx, SO2, CO, O3, and VOCs through technology and regulations, promoting sustainability. Key Concept … Read more

GIS Tools for urban planning

Using GIS for Smart City Planning: From Traffic Management to Green Spaces

In today’s rapidly evolving urban landscapes, GIS for Smart City Planning plays a crucial role in building efficient, livable, and sustainable environments. By leveraging GIS in urban planning, city authorities can effectively manage traffic congestion, design accessible green spaces, and streamline infrastructure development. Geographic Information Systems empower planners with data-driven insights, helping them transform challenges … Read more

Retracing Gandhi’s Dandi March: A Digital Journey with Story on Map

Start a historical trail with MAPSTORY and follow the route and importance of “Gandhi’s Dandi Aviyan: A Path to Freedom with MAPSTORY” a critical event in the fight for India’s independence. Use MAPOG’s immersive mapping technology to explore the route and the significance of this historical march. Key Concepts This is a way to digitally … Read more

How to use GIS for Mapping Disease Affected Area

 Geographic Information System is an emerging field that combines spatial analysis, statistical modeling and data visualization. We can create maps by pinpointing the location of disease outbreak by using a “point to polygon tool” and help us lineate the affected area smoothly and effortlessly. Key concept  Analysis of disease affected areas by using point to … Read more