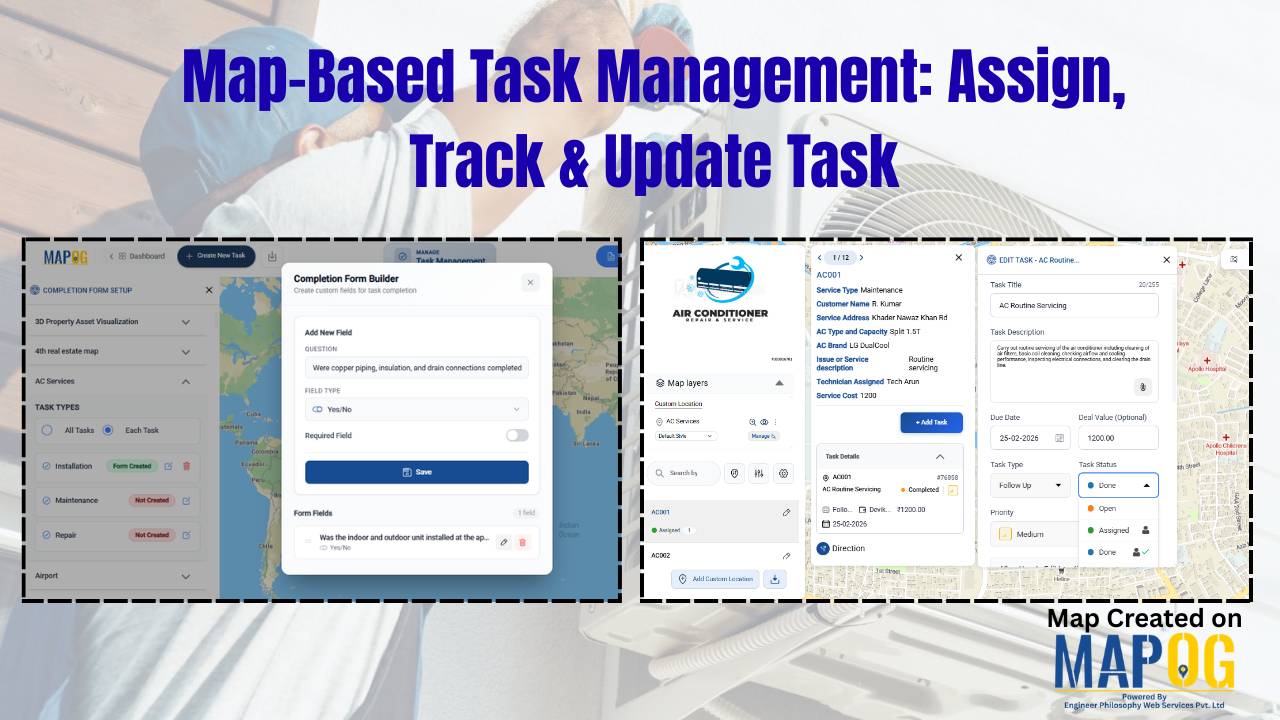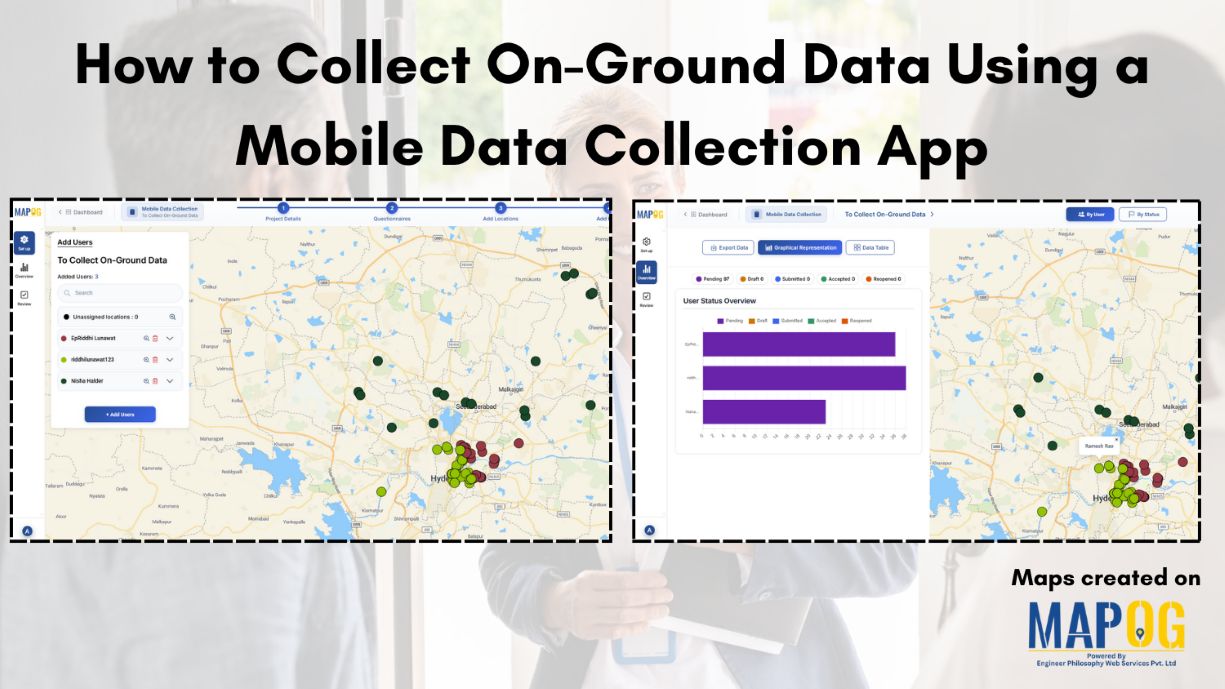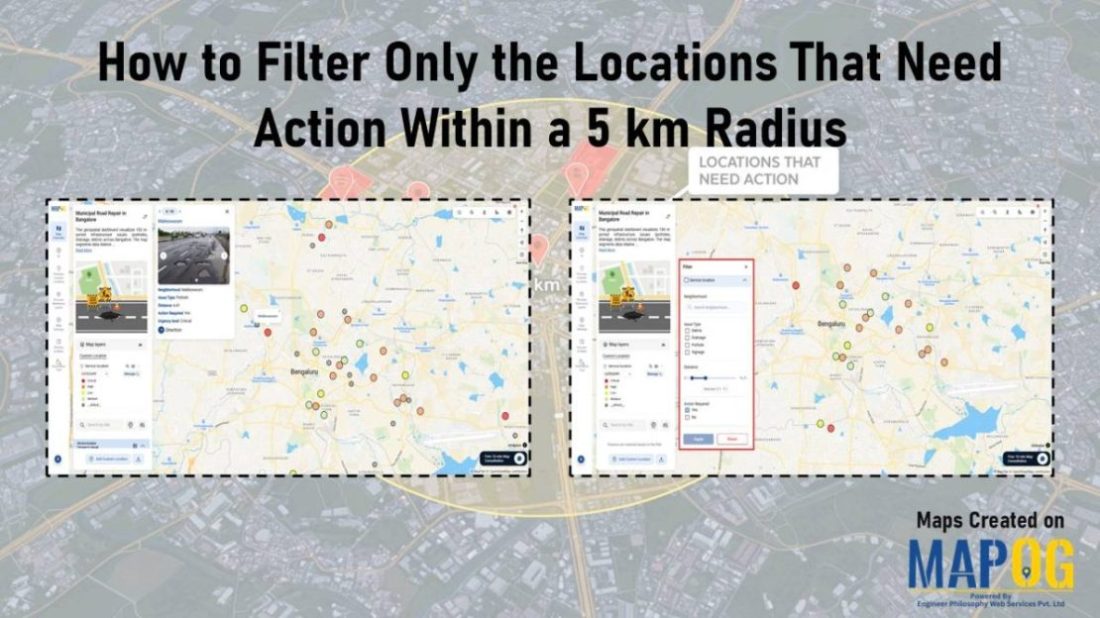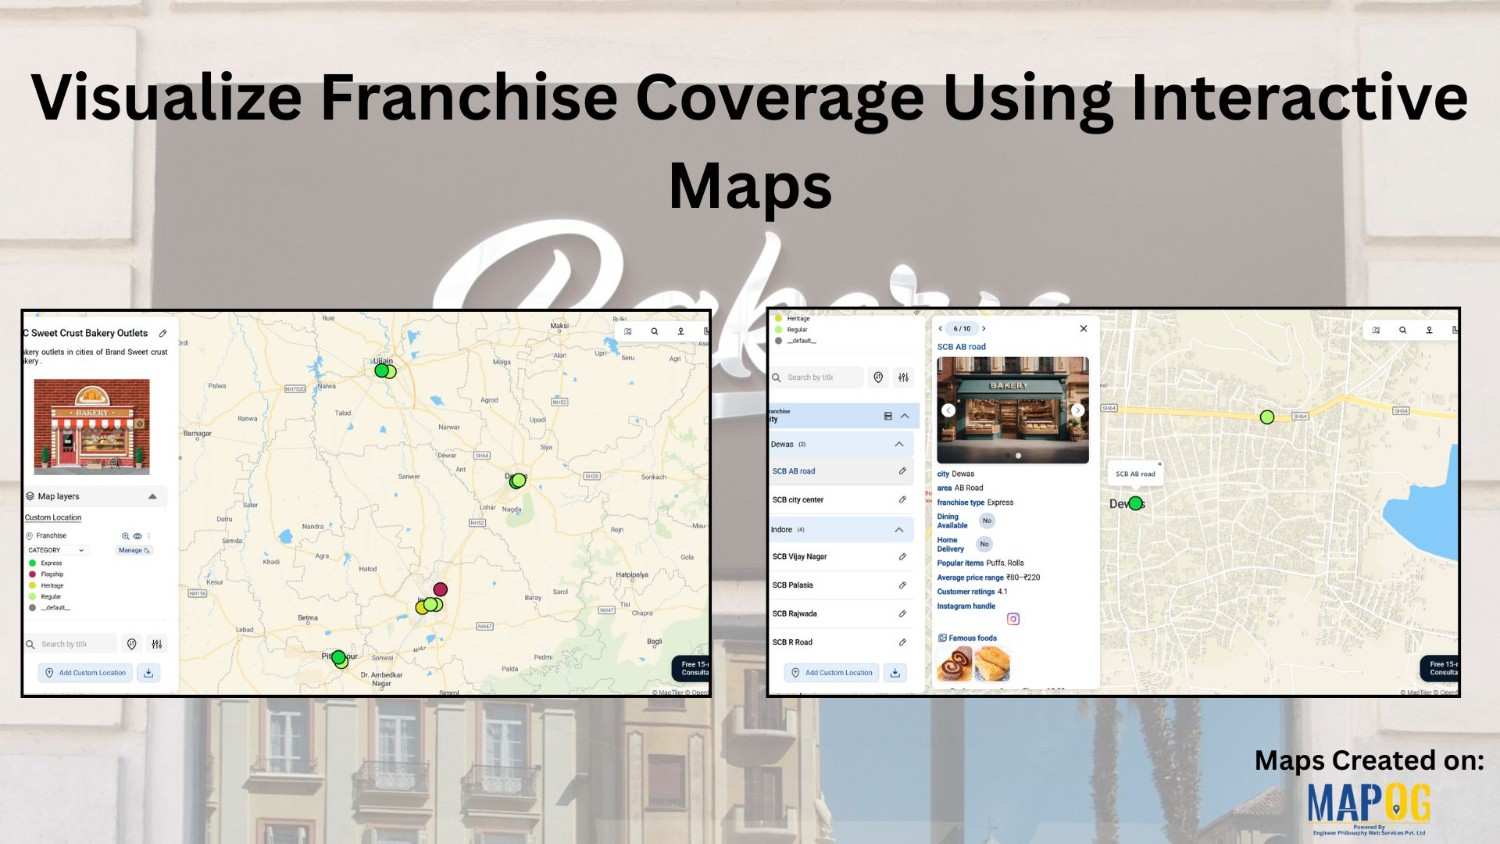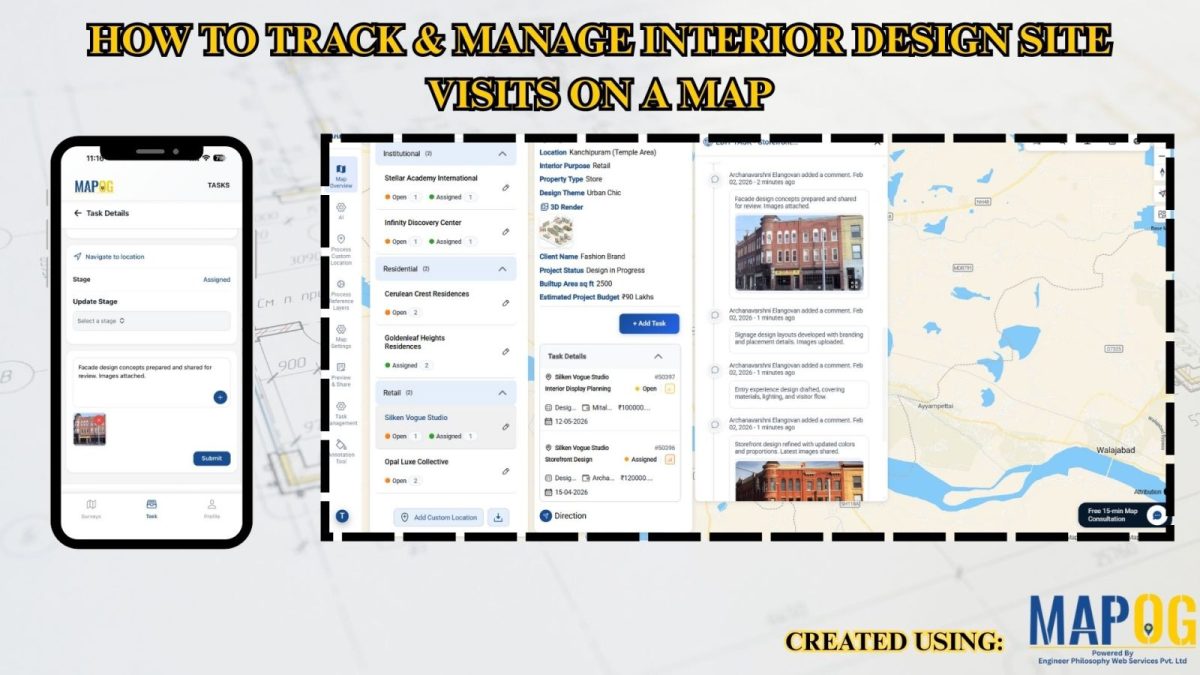
How to Track & Manage Interior Design Site Visits on a Map
Interior design teams often struggle with multiple site visits, scattered updates, delayed follow-ups, and low project visibility. When data is spread across tools, coordination slows and decisions take longer. Manage Interior Design Site Visits with MAPOG by bringing all locations, visit status, tasks, timelines, and teams into one clear, interactive map with real-time data, improving … Read more