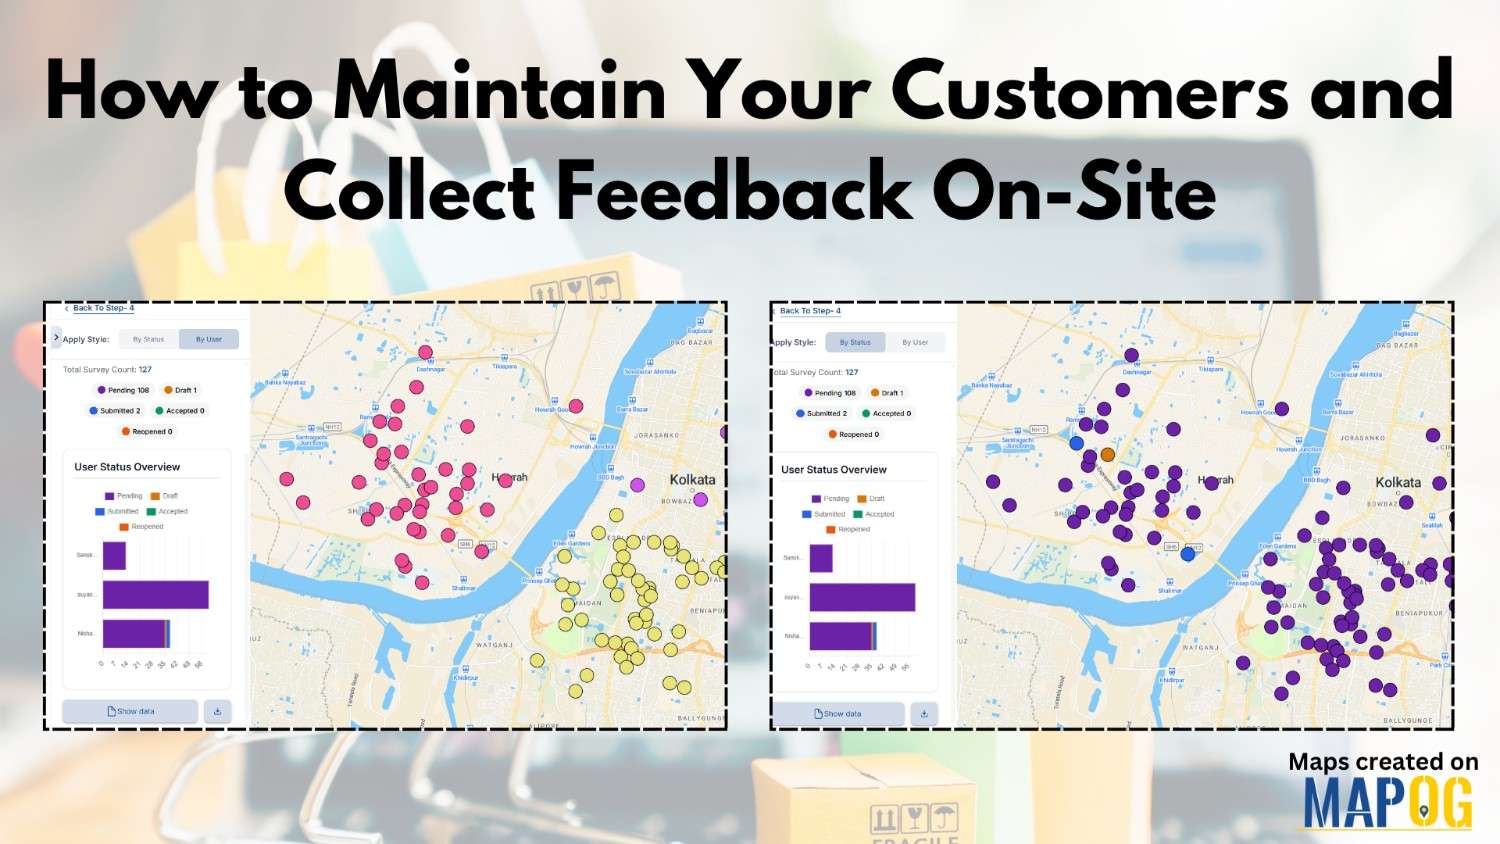
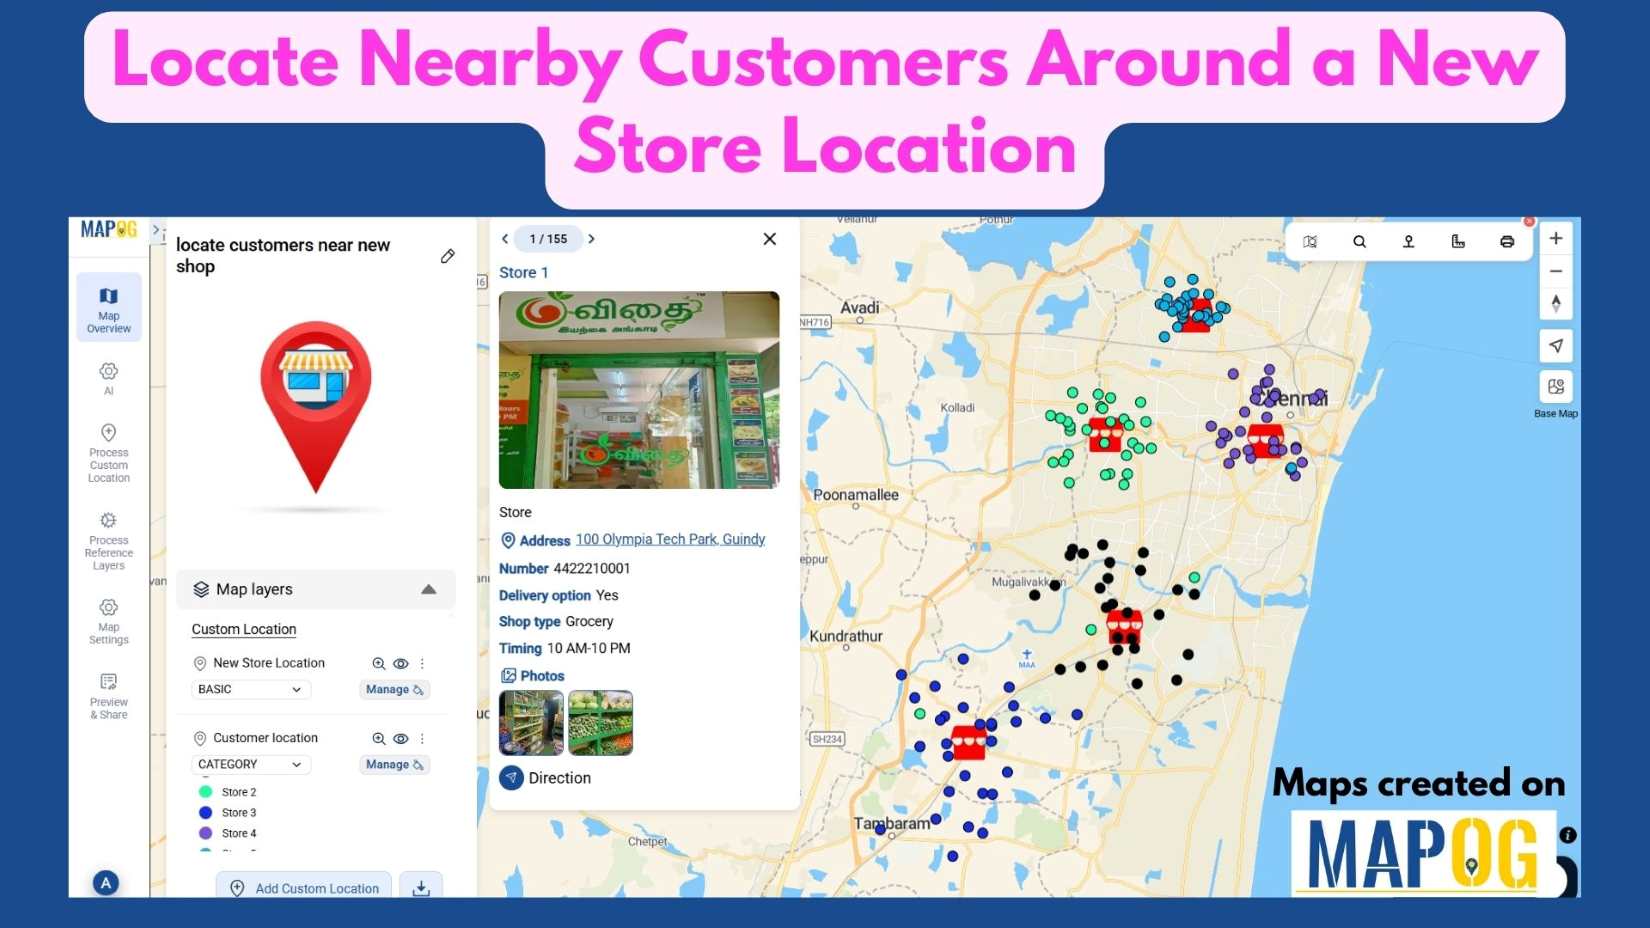
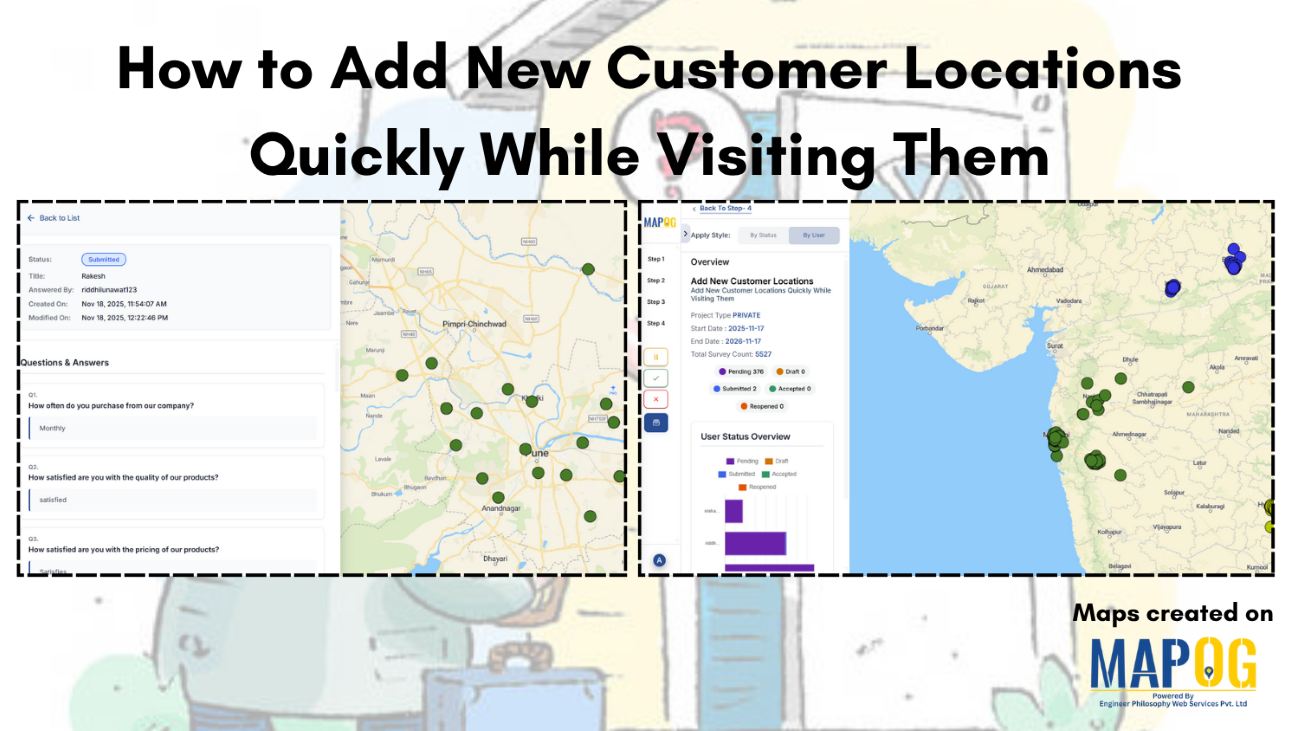
Blog

The Ultimate Guide to Uploading GIS Data Formats (CSV, KML, Shapefile)

Uploading GIS data is the crucial first step in any spatial analysis workflow. Whether for urban planning, environment, infrastructure, or disaster response, clean and structured data ensures accuracy in representing real-world features and relationships. Using correct formats allows mapping software to interpret boundaries and attributes effectively. MAPOG, a leading cloud-based GIS platform, supports various formats … Read more

Story Map Online Free: How to Create One Without GIS Skills

Learn how to create a story map online free using MAPOG—no GIS skills needed, just intuitive storytelling with images, text, and location. Whether you’re showcasing heritage sites, tracking environmental changes, or exploring social patterns, Story Maps convert static information into engaging experiences. For example, you can plan travel routes with story maps or explore the … Read more

Creating a Story Map of Monuments and Share or Embed It Anywhere

A Story Map of Monuments using MAPOG transforms how we explore cultural heritage. Instead of static lists, it offers a visual journey through India’s architectural legacy—organized by district or state. Whether you’re promoting tourism, documenting history, or supporting heritage conservation, a story Map of Monuments using MAPOG brings depth and context that traditional formats can’t … Read more

How to Create Interactive Maps Without Any Technical Skills

How to Create and Embed Live Maps on Your Website in Minutes

In today’s data-driven world, learning how to create and embed live maps into your blog or Website can instantly boost engagement and clarity. Whether you’re showcasing public services, identifying urban gaps, or promoting inclusivity, interactive maps transform static content into immersive, insightful experiences no GIS skills required. With MAPOG, a no-code mapping tool, anyone can … Read more

Create interactive maps using MAPOG without technical skills

Create Interactive Maps Without Any Technical Skills – A Visual Guide

Creating interactive maps no longer requires technical skills or expertise in geographic information systems. Today, even individuals without a background in GIS can visualise and analyse spatial data to better understand real-world issues. Whether you’re a teacher, student, or policy planner, interactive maps can powerfully communicate patterns, challenges, and opportunities in education, healthcare, infrastructure, and … Read more

Best Places to Visit in All Indian States

Top places to Visit Across India – Visual Travel Guide on Map

India is more than a destination it’s a vibrant journey through culture, nature, and heritage. With the MAPOG code-free mapping platform, you can effortlessly transform your travel plans or blog into an interactive visual experience, highlighting top places to visit across India. From sacred sites to scenic wonders, bring India’s diversity to life all in … Read more

Mapping Borewell Locations Near Rivers and Lakes with GIS-Based Tools

Mapping borewell locations near rivers and lakes is not only vital for understanding groundwater dependencies but also essential for ensuring sustainable usage. In fact, in regions where surface water and groundwater interact closely, analyzing borewell proximity to these natural water bodies becomes even more crucial. Moreover, with the help of GIS-based tools like MAPOG, users … Read more

Create Map to Identify Groundwater Decline and Recharge Gaps Using GIS Tools

Groundwater mapping using GIS tools is becoming essential as groundwater decline and recharge gaps raise serious concerns—especially in regions that rely heavily on underground water resources. Fortunately, by using GIS technology, stakeholders can now visualize, Role of GIS In Irrigation Planning and Water Resource Management to these changes more efficiently than ever before. Moreover, with … Read more

How to Map and Share Retail Store Locations for Your Franchise?

In today’s data-driven world, the ability to map retail store locations for your franchise is one of the smartest moves you can make. Just as visualizing a Safari Itinerary on a map helps travelers craft immersive and efficient journeys, or mapping Spatial Retail Store Analysis with GIS tools enables cities to improve safety and planning, … Read more

Interactive Population Maps

Interactive Population Map with Heat Bubble and Category Styling

Analysing and interpreting population data across various geographic regions can be done visually with Interactive Population Maps with Heat Bubble and Category Styling. It is simple to quickly identify high and low concentration areas on these maps because they use heat bubbles, which vary in size and colour, to represent population density or totals. Furthermore, … Read more